Climate for Station: Ft Mckavett, Texas, United States
Loading live weather...
Climate Analysis & Overview
Fort McKavett, located in the heart of Texas, is experiencing a warming trend in high temperatures over the past decade, despite a slight cooling in lows. The region is also seeing more concentrated rainfall events, indicating a shift towards less frequent but heavier precipitation.
Climate Classification and Geography
Fort McKavett, situated at 30.8272°N, 100.1103°W, falls under the Köppen climate classification of Cfa, indicating a humid subtropical climate. This classification is characterised by hot summers and mild winters, with precipitation distributed throughout the year. The local geography, marked by rolling plains and proximity to the Edwards Plateau, influences the climate by moderating temperature extremes and impacting precipitation patterns.
Temperature Trends: A Mixed Signal
Over the last decade, Fort McKavett has experienced a warming trend in high temperatures, with an increase of 1.42°C (2.56°F). This warming trend is significant and aligns with broader regional patterns across Texas, where rising temperatures are becoming more prevalent. Conversely, the low temperatures have shown a slight cooling, decreasing by 0.10°C (0.18°F). When examining the all-time trends, the highs have risen by 0.12°C (0.22°F), while the lows have decreased by 0.06°C (0.11°F). This indicates a long-term cooling trend for lows, contrasting with the recent warming of highs.
Precipitation Patterns: Concentration Intensifies
The Precipitation Concentration Index (PCI) has increased from a baseline of 17.3 to a current value of 18.3, suggesting a marginal increase in the concentration of rainfall events. This means that rainfall is becoming more concentrated in fewer, more intense events, rather than being evenly distributed throughout the year. Such changes can have significant implications for agriculture and water management, as they may lead to periods of drought followed by heavy rainfall.
Temperature Extremes: Records Hold Steady
The record high temperature for Fort McKavett stands at 44.4°C (111.9°F), while the record low is -21.1°C (-5.98°F). These extremes highlight the potential for significant temperature variability in the region, which can be exacerbated by the ongoing trends in temperature changes.
Regional Climate Goals and Implications
As part of the United States' efforts to address climate change, regional goals include reducing greenhouse gas emissions and enhancing resilience to climate impacts. The trends observed in Fort McKavett, particularly the warming of high temperatures and the increasing concentration of precipitation, underscore the importance of these goals. Recent weather events, such as severe storms and heatwaves, further highlight the need for adaptive strategies to mitigate the impacts of these climatic shifts.
Station Statistics
10-Year Trend
High: +1.17 °C/decade
Low: -0.40 °C/decade
Rain: -0.75 mm/decade
25-Year Trend
High: +0.59 °C/decade
Low: -0.07 °C/decade
Rain: -0.10 mm/decade
50-Year Trend
High: +0.33 °C/decade
Low: -0.16 °C/decade
Rain: -0.05 mm/decade
All-Time Trend
High: +0.12 °C/decade
Low: -0.06 °C/decade
Rain: -0.04 mm/decade
Percentage Above-Average Days
Last 12 Months: 65.9%
This Year: 72.7%
Precipitation Concentration Index (PCI) ℹ️
Last 12 Months: 18.6
Historical Average: 17.0
Percentile Rank of Last 12 Months ℹ️
High: 75th percentile
Low: 44th percentile
Rain: 46th percentile
Change in Variance ℹ️
High: -3.9%
Low: -0.2%
Intraday: +7.8%
Data Coverage
72.6%
First Year of Data
1878
Station Location
Historical Weather Records
| Max High | Avg High | Min High | Max Avg | Avg Avg | Min Avg | Max Low | Avg Low | Min Low | Max Precipitation | Avg Precipitation | Max Snow | Avg Snow | |
|---|---|---|---|---|---|---|---|---|---|---|---|---|---|
| Record | 44.4 °C | — | -11.1 °C | — | — | — | 26.1 °C | — | -21.1 °C | 125.0 mm | — | 102.0 mm | — |
| January | 31.7 °C | 15.6 °C | -8.9 °C | — | — | — | 17.8 °C | -0.6 °C | -21.1 °C | 47.5 mm | 0.8 mm | 38.0 mm | 0.1 mm |
| February | 34.4 °C | 17.7 °C | -9.4 °C | — | — | — | 18.9 °C | 1.8 °C | -14.4 °C | 36.6 mm | 1.0 mm | 102.0 mm | 0.3 mm |
| March | 33.3 °C | 22.1 °C | -2.8 °C | — | — | — | 21.1 °C | 6.6 °C | -12.2 °C | 58.9 mm | 1.4 mm | 0.0 mm | 0.0 mm |
| April | 38.9 °C | 26.7 °C | 1.1 °C | — | — | — | 21.7 °C | 10.8 °C | -6.1 °C | 53.3 mm | 1.3 mm | 0.0 mm | 0.0 mm |
| May | 41.7 °C | 30.2 °C | 10.6 °C | — | — | — | 23.9 °C | 16.1 °C | -1.1 °C | 95.3 mm | 2.2 mm | 0.0 mm | 0.0 mm |
| June | 44.4 °C | 33.7 °C | 20.0 °C | — | — | — | 26.1 °C | 20.1 °C | 8.9 °C | 125.0 mm | 2.3 mm | 0.0 mm | 0.0 mm |
| July | 42.8 °C | 34.8 °C | 21.1 °C | — | — | — | 25.6 °C | 21.1 °C | 11.1 °C | 104.1 mm | 1.7 mm | 0.0 mm | 0.0 mm |
| August | 42.2 °C | 34.5 °C | 20.6 °C | — | — | — | 26.1 °C | 20.5 °C | 10.6 °C | 85.9 mm | 2.0 mm | 0.0 mm | 0.0 mm |
| September | 40.0 °C | 31.0 °C | 12.2 °C | — | — | — | 25.6 °C | 16.8 °C | 1.1 °C | 63.5 mm | 2.1 mm | 0.0 mm | 0.0 mm |
| October | 36.7 °C | 26.4 °C | 3.9 °C | — | — | — | 23.9 °C | 11.3 °C | -5.6 °C | 109.0 mm | 2.0 mm | 0.0 mm | 0.0 mm |
| November | 34.4 °C | 20.2 °C | -2.8 °C | — | — | — | 22.2 °C | 5.3 °C | -10.6 °C | 114.3 mm | 1.4 mm | 5.0 mm | 0.0 mm |
| December | 31.1 °C | 16.4 °C | -11.1 °C | — | — | — | 19.4 °C | 0.8 °C | -13.9 °C | 41.9 mm | 0.7 mm | 76.0 mm | 0.1 mm |
Data Visualisations
Remove WatermarksCurrent Year Climate Trends vs Historical


Max Temperature this Year | 1 of 6
Climate 12-Month Moving Averages


Max Temperature 12-Month MA | 1 of 6
Daily Data Points and Averages Throughout the Year

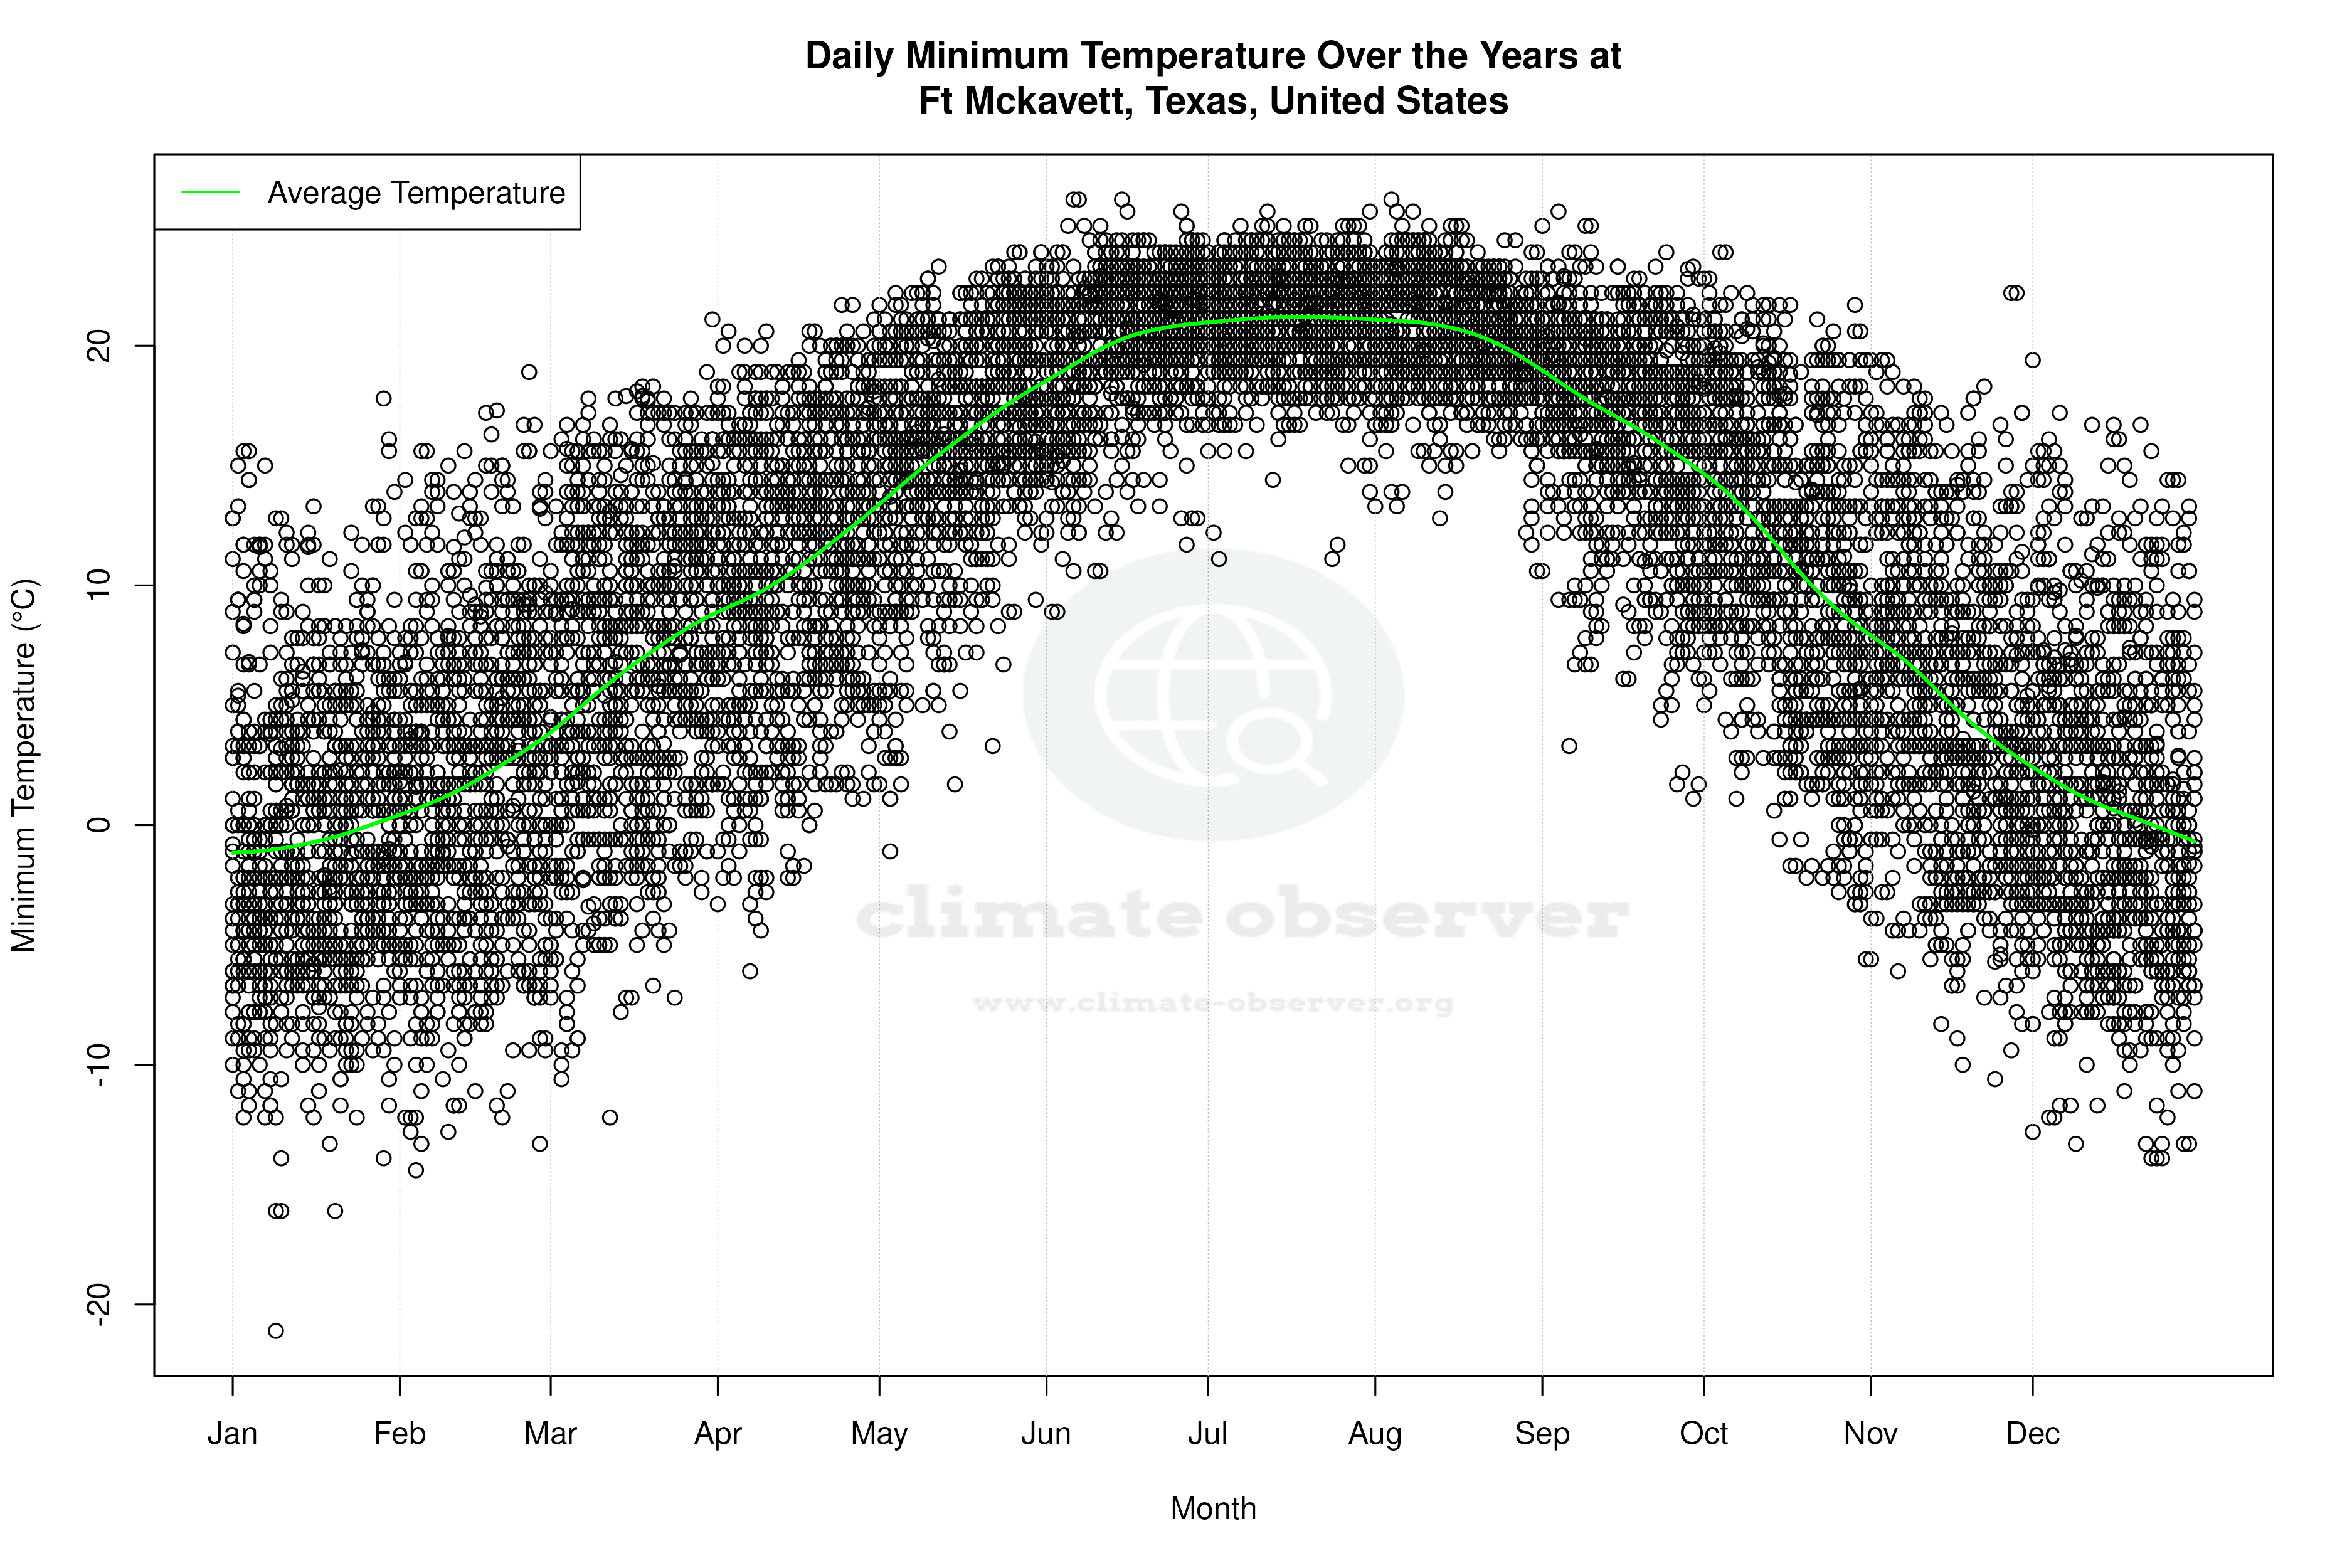


Average Max Temperature Throughout Year | 1 of 5
