Climate for Station: Deseret, Utah, United States
Loading live weather...
Climate Analysis & Overview
Deseret, Utah, experiences a complex climate narrative where long-term warming of 0.12°C (0.22°F) in highs contrasts sharply with a recent decade of cooling lows by 1.62°C (2.92°F). Precipitation events are becoming more concentrated, with the PCI rising from 12.40 to 13.27. This shift may challenge local climate resilience strategies.
Deseret's Climatic Dichotomy
Deseret, located in Millard County, Utah, falls under the Köppen climate classification of BSk, indicating a cold semi-arid climate. This classification is influenced by its geographical setting, nestled between the Great Basin's vast expanses and the Wasatch Range's imposing peaks. The region's climate is marked by a stark contrast between the long-term warming of high temperatures and the recent cooling of low temperatures. Over the past decade, high temperatures have shown a modest increase of 0.12°C (0.22°F), while low temperatures have experienced a notable cooling trend of 1.62°C (2.92°F). This divergence suggests a complex interplay of factors, possibly including atmospheric circulation patterns and localised microclimatic effects.
Historical Extremes and Recent Trends
Deseret's temperature records highlight the extremities of its climate. The highest recorded temperature stands at 43.9°C (111.0°F), while the lowest plunges to -35.6°C (-32.1°F). These values underscore the area's potential for extreme weather events. The all-time trends reveal a warming of highs by 0.12°C (0.22°F), indicating a gradual rise in maximum temperatures. Conversely, lows have increased by 0.14°C (0.25°F) over the long term, suggesting a slight warming trend in minimum temperatures. This nuanced picture of temperature trends is crucial for understanding the broader climate dynamics at play.
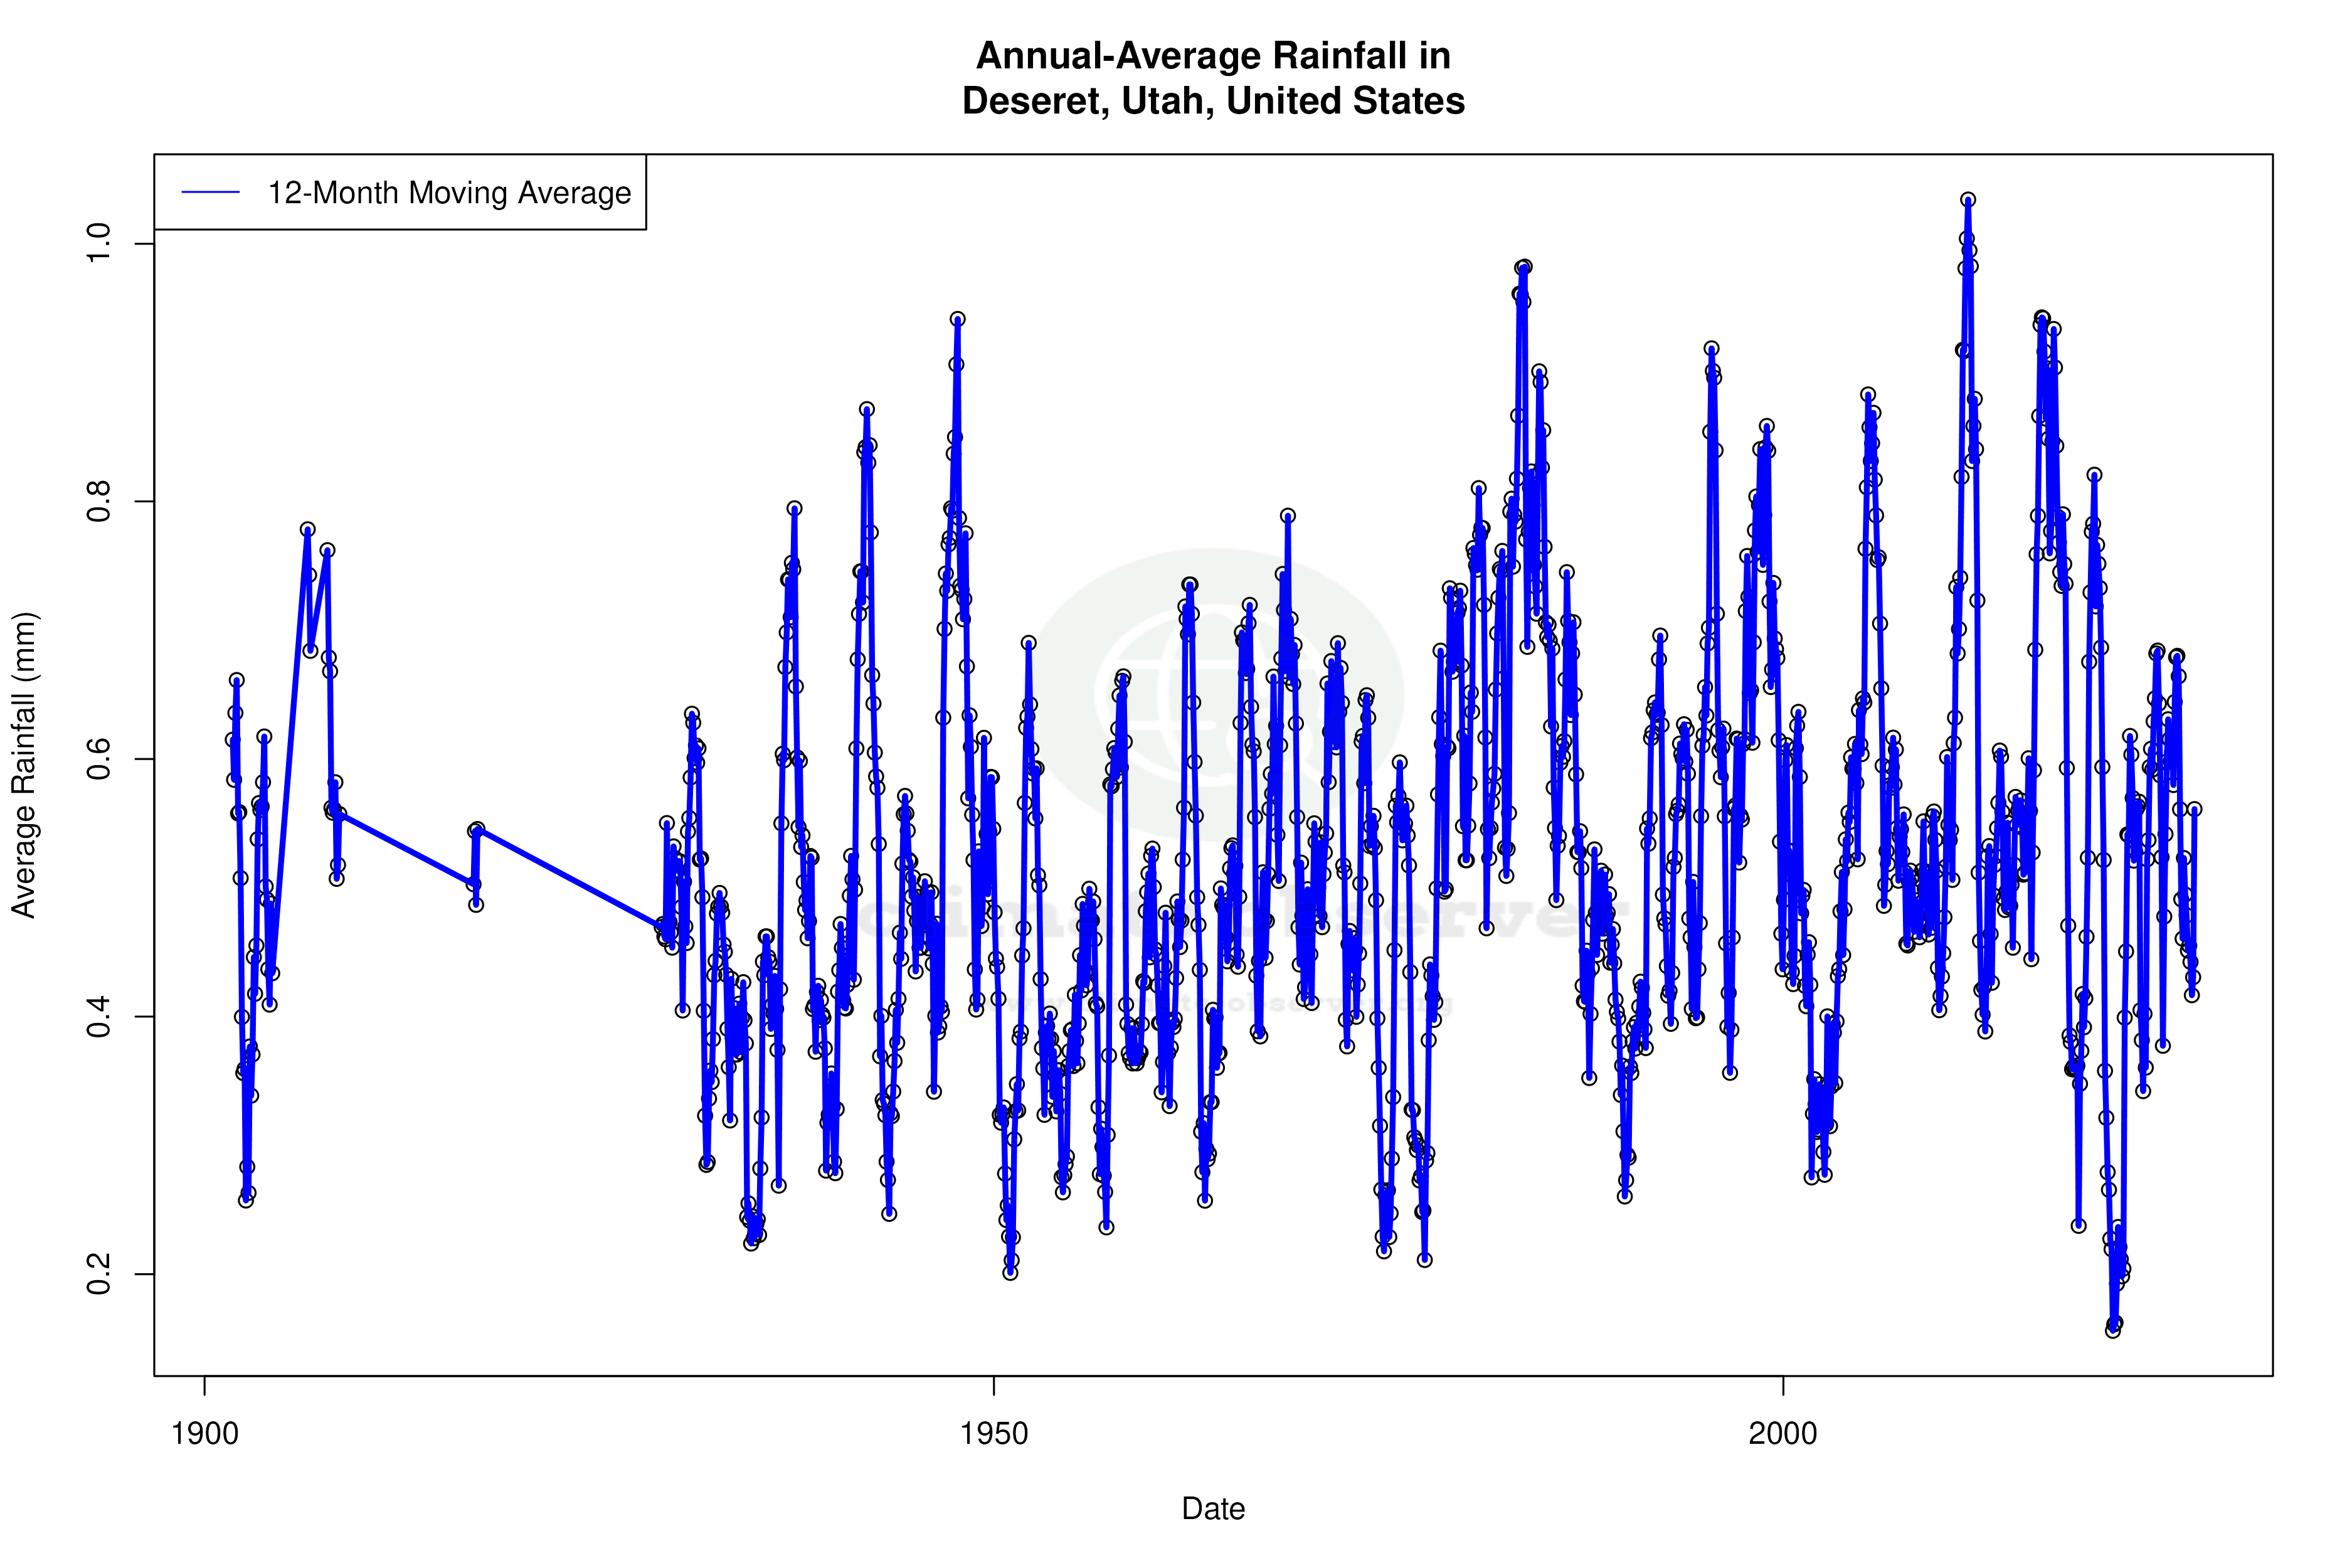
Precipitation Patterns: A Shift Towards Concentration
The Precipitation Concentration Index (PCI) offers insights into how rainfall is distributed over time. Deseret's PCI has increased from 12.40 to 13.27, indicating a shift towards more concentrated precipitation events. This means that rainfall is occurring in fewer, more intense bursts rather than being evenly distributed throughout the year. Such changes can have significant implications for water management and agriculture, potentially increasing the risk of flooding and soil erosion during heavy rainfall events.
Regional Implications and Climate Goals
Deseret's climate profile is set against the backdrop of broader regional climate goals in the United States, which aim to enhance resilience against climate change impacts. The cooling trend in low temperatures over the past decade may offer some temporary relief from heat stress, but the increasing concentration of precipitation events poses challenges for infrastructure and water resources. Understanding these dynamics is essential for developing adaptive strategies that align with national climate objectives and ensure sustainable development in the region.
Station Statistics
10-Year Trend
High: +1.01 °C/decade
Low: -0.86 °C/decade
Rain: -0.24 mm/decade
25-Year Trend
High: +0.56 °C/decade
Low: +0.02 °C/decade
Rain: +0.00 mm/decade
50-Year Trend
High: +0.33 °C/decade
Low: +0.33 °C/decade
Rain: -0.01 mm/decade
All-Time Trend
High: +0.11 °C/decade
Low: +0.13 °C/decade
Rain: +0.01 mm/decade
Percentage Above-Average Days
Last 12 Months: 55.6%
This Year: 87.2%
Precipitation Concentration Index (PCI) ℹ️
Last 12 Months: 15.8
Historical Average: 15.3
Percentile Rank of Last 12 Months ℹ️
High: 99th percentile
Low: 88th percentile
Rain: 39th percentile
Change in Variance ℹ️
High: +10.2%
Low: -1.5%
Intraday: +1.9%
Data Coverage
80.6%
First Year of Data
1899
Station Location
Historical Weather Records
| Max High | Avg High | Min High | Max Avg | Avg Avg | Min Avg | Max Low | Avg Low | Min Low | Max Precipitation | Avg Precipitation | Max Snow | Avg Snow | |
|---|---|---|---|---|---|---|---|---|---|---|---|---|---|
| Record | 43.9 °C | — | -19.4 °C | 32.0 °C | — | -20.0 °C | 28.3 °C | — | -35.6 °C | 50.8 mm | — | 381.0 mm | — |
| January | 17.8 °C | 3.6 °C | -17.2 °C | 8.3 °C | -1.7 °C | -20.0 °C | 8.9 °C | -10.3 °C | -35.6 °C | 24.1 mm | 0.5 mm | 305.0 mm | 4.5 mm |
| February | 23.3 °C | 7.6 °C | -14.4 °C | 13.1 °C | 0.5 °C | -15.7 °C | 9.4 °C | -7.1 °C | -33.9 °C | 50.8 mm | 0.6 mm | 178.0 mm | 4.3 mm |
| March | 28.9 °C | 13.3 °C | -5.0 °C | 18.0 °C | 4.8 °C | -5.9 °C | 18.3 °C | -3.5 °C | -25.6 °C | 25.1 mm | 0.8 mm | 216.0 mm | 3.3 mm |
| April | 32.8 °C | 18.3 °C | 1.1 °C | 20.9 °C | 8.9 °C | -3.5 °C | 15.6 °C | -0.1 °C | -14.4 °C | 26.9 mm | 0.8 mm | 203.0 mm | 1.6 mm |
| May | 39.4 °C | 23.7 °C | 2.8 °C | 27.2 °C | 14.4 °C | 0.1 °C | 19.4 °C | 4.4 °C | -11.1 °C | 45.7 mm | 0.8 mm | 381.0 mm | 0.3 mm |
| June | 42.2 °C | 29.7 °C | 6.7 °C | 30.5 °C | 20.9 °C | 6.3 °C | 25.6 °C | 8.8 °C | -5.6 °C | 24.1 mm | 0.4 mm | 0.0 mm | 0.0 mm |
| July | 43.9 °C | 34.2 °C | 17.1 °C | 32.0 °C | 25.6 °C | 13.5 °C | 28.3 °C | 13.2 °C | 0.0 °C | 29.2 mm | 0.4 mm | 0.0 mm | 0.0 mm |
| August | 41.7 °C | 32.8 °C | 17.2 °C | 31.0 °C | 24.2 °C | 12.8 °C | 25.0 °C | 12.2 °C | -3.3 °C | 40.0 mm | 0.5 mm | 137.0 mm | 0.0 mm |
| September | 41.7 °C | 27.5 °C | 6.7 °C | 27.8 °C | 18.6 °C | 4.7 °C | 19.4 °C | 6.4 °C | -7.2 °C | 38.6 mm | 0.6 mm | 127.0 mm | 0.1 mm |
| October | 33.9 °C | 20.0 °C | -2.8 °C | 23.0 °C | 10.4 °C | -5.3 °C | 15.0 °C | 0.1 °C | -19.4 °C | 46.2 mm | 0.7 mm | 140.0 mm | 0.3 mm |
| November | 26.1 °C | 11.3 °C | -9.4 °C | 15.6 °C | 3.1 °C | -10.7 °C | 11.1 °C | -5.6 °C | -23.9 °C | 24.1 mm | 0.5 mm | 203.0 mm | 2.1 mm |
| December | 20.6 °C | 4.4 °C | -19.4 °C | 12.5 °C | -1.6 °C | -19.2 °C | 9.4 °C | -9.6 °C | -35.6 °C | 26.7 mm | 0.6 mm | 254.0 mm | 4.2 mm |
Data Visualisations
Remove WatermarksCurrent Year Climate Trends vs Historical


Max Temperature this Year | 1 of 6
Climate 12-Month Moving Averages


Max Temperature 12-Month MA | 1 of 6
Daily Data Points and Averages Throughout the Year


Average Max Temperature Throughout Year | 1 of 5
