Climate for Station: Glenville, West Virginia, United States
Loading live weather...
Climate Analysis & Overview
Glenville, West Virginia, is experiencing a cooling trend, with both high and low temperatures showing a decline over the past decade and all-time records. Precipitation patterns have become more evenly distributed, reflecting a slight decrease in the Precipitation Concentration Index (PCI). These changes align with broader regional climate goals aimed at understanding and mitigating climate variability.
Climate Classification and Geography
Glenville is located in the heart of West Virginia, nestled within the Appalachian Mountains. This region is classified under the Köppen climate classification as a humid continental climate, characterized by cold winters and warm summers. The surrounding mountainous terrain influences local weather patterns, often leading to significant temperature variations and precipitation events. The area's geographical features play a crucial role in shaping its climate data.
Temperature Trends: A Cooling Pattern
Over the past decade, Glenville has experienced a noticeable cooling trend. The 10-year trends show a decrease in high temperatures by -0.11°C (-0.20°F) and a more pronounced fall in low temperatures by -1.42°C (-2.56°F). When considering the all-time trends, there is a consistent cooling with high temperatures decreasing by -0.08°C (-0.14°F) and low temperatures by -0.02°C (-0.04°F). These trends highlight a persistent cooling pattern, which is significant given the broader context of global warming concerns.
Precipitation Patterns: A Shift Towards Even Distribution
The Precipitation Concentration Index (PCI) provides insight into how rainfall is distributed throughout the year. Glenville's PCI has decreased from a baseline of 10.82 to a current value of 9.92, indicating a more even distribution of precipitation events. This slight change suggests that rainfall is becoming less concentrated in intense events, which can have implications for local water management and agricultural practices.
Temperature Extremes: Record Highs and Lows
Glenville has experienced significant temperature extremes, with a record high of 41.7°C (107.1°F) and a record low of -33.9°C (-29.0°F). These extremes underscore the variability inherent in the region's climate, influenced by its continental positioning and elevation. Such records are critical for understanding the potential range of future climate conditions in the area.
Regional Climate Goals and Implications
The observed trends in Glenville align with broader climate goals in the United States, which aim to better understand and adapt to climate variability. The cooling trends and more evenly distributed precipitation patterns could offer valuable insights into regional climate dynamics. These findings are particularly relevant in the context of recent weather events, such as severe storms and droughts, which have prompted increased focus on climate resilience and adaptation strategies.
Station Statistics
10-Year Trend
High: +0.06 °C/decade
Low: -1.21 °C/decade
Rain: -0.05 mm/decade
25-Year Trend
High: +0.43 °C/decade
Low: +0.31 °C/decade
Rain: -0.05 mm/decade
50-Year Trend
High: +0.14 °C/decade
Low: +0.49 °C/decade
Rain: +0.03 mm/decade
All-Time Trend
High: -0.08 °C/decade
Low: -0.01 °C/decade
Rain: -0.07 mm/decade
Percentage Above-Average Days
Last 12 Months: 55.1%
This Year: 20.0%
Precipitation Concentration Index (PCI) ℹ️
Last 12 Months: 9.9
Historical Average: 11.1
Percentile Rank of Last 12 Months ℹ️
High: 49th percentile
Low: 57th percentile
Rain: 51st percentile
Change in Variance ℹ️
High: -7.4%
Low: -2.1%
Intraday: -19.1%
Data Coverage
81.9%
First Year of Data
1889
Station Location
Historical Weather Records
| Max High | Avg High | Min High | Max Avg | Avg Avg | Min Avg | Max Low | Avg Low | Min Low | Max Precipitation | Avg Precipitation | Max Snow | Avg Snow | |
|---|---|---|---|---|---|---|---|---|---|---|---|---|---|
| Record | 41.7 °C | — | -20.6 °C | 30.7 °C | — | -22.3 °C | 30.0 °C | — | -33.9 °C | 129.3 mm | — | 711.0 mm | — |
| January | 26.7 °C | 6.2 °C | -20.6 °C | 16.1 °C | -1.2 °C | -22.3 °C | 14.4 °C | -5.5 °C | -31.7 °C | 55.6 mm | 3.1 mm | 406.0 mm | 6.8 mm |
| February | 27.8 °C | 7.7 °C | -17.2 °C | 17.0 °C | 0.6 °C | -16.6 °C | 16.1 °C | -4.8 °C | -33.9 °C | 57.4 mm | 3.1 mm | 330.0 mm | 6.0 mm |
| March | 37.2 °C | 13.4 °C | -10.0 °C | 20.5 °C | 5.3 °C | -12.5 °C | 17.8 °C | -0.8 °C | -24.4 °C | 65.8 mm | 3.3 mm | 457.0 mm | 3.7 mm |
| April | 35.0 °C | 19.8 °C | -0.6 °C | 23.7 °C | 11.2 °C | -2.3 °C | 21.7 °C | 4.0 °C | -13.3 °C | 55.9 mm | 3.2 mm | 178.0 mm | 0.6 mm |
| May | 37.2 °C | 24.9 °C | 5.6 °C | 26.9 °C | 16.5 °C | 2.2 °C | 23.9 °C | 9.3 °C | -5.6 °C | 85.3 mm | 3.7 mm | 13.0 mm | 0.0 mm |
| June | 38.3 °C | 28.7 °C | 10.0 °C | 29.1 °C | 21.1 °C | 10.2 °C | 30.0 °C | 14.4 °C | -0.6 °C | 98.0 mm | 3.9 mm | 495.0 mm | 1.1 mm |
| July | 41.7 °C | 30.5 °C | 16.1 °C | 30.7 °C | 23.5 °C | 15.2 °C | 30.0 °C | 16.9 °C | 3.3 °C | 129.3 mm | 4.2 mm | 424.0 mm | 0.4 mm |
| August | 41.7 °C | 29.9 °C | 17.8 °C | 29.6 °C | 23.0 °C | 12.9 °C | 23.9 °C | 16.2 °C | 2.8 °C | 94.0 mm | 3.4 mm | 0.0 mm | 0.0 mm |
| September | 40.0 °C | 27.1 °C | 8.3 °C | 28.1 °C | 19.3 °C | 7.4 °C | 24.4 °C | 12.2 °C | -1.7 °C | 88.9 mm | 2.9 mm | 279.0 mm | 0.1 mm |
| October | 35.0 °C | 20.8 °C | 2.2 °C | 26.7 °C | 12.6 °C | 0.3 °C | 22.2 °C | 5.3 °C | -11.1 °C | 79.2 mm | 2.5 mm | 102.0 mm | 0.1 mm |
| November | 31.7 °C | 13.6 °C | -10.0 °C | 20.7 °C | 6.2 °C | -7.2 °C | 18.9 °C | -0.0 °C | -17.8 °C | 88.9 mm | 2.8 mm | 711.0 mm | 1.5 mm |
| December | 27.8 °C | 7.8 °C | -15.0 °C | 16.9 °C | 1.3 °C | -20.0 °C | 15.0 °C | -3.6 °C | -31.7 °C | 55.9 mm | 3.0 mm | 445.0 mm | 3.8 mm |
Data Visualisations
Remove WatermarksCurrent Year Climate Trends vs Historical


Max Temperature this Year | 1 of 6
Climate 12-Month Moving Averages


Max Temperature 12-Month MA | 1 of 6
Daily Data Points and Averages Throughout the Year


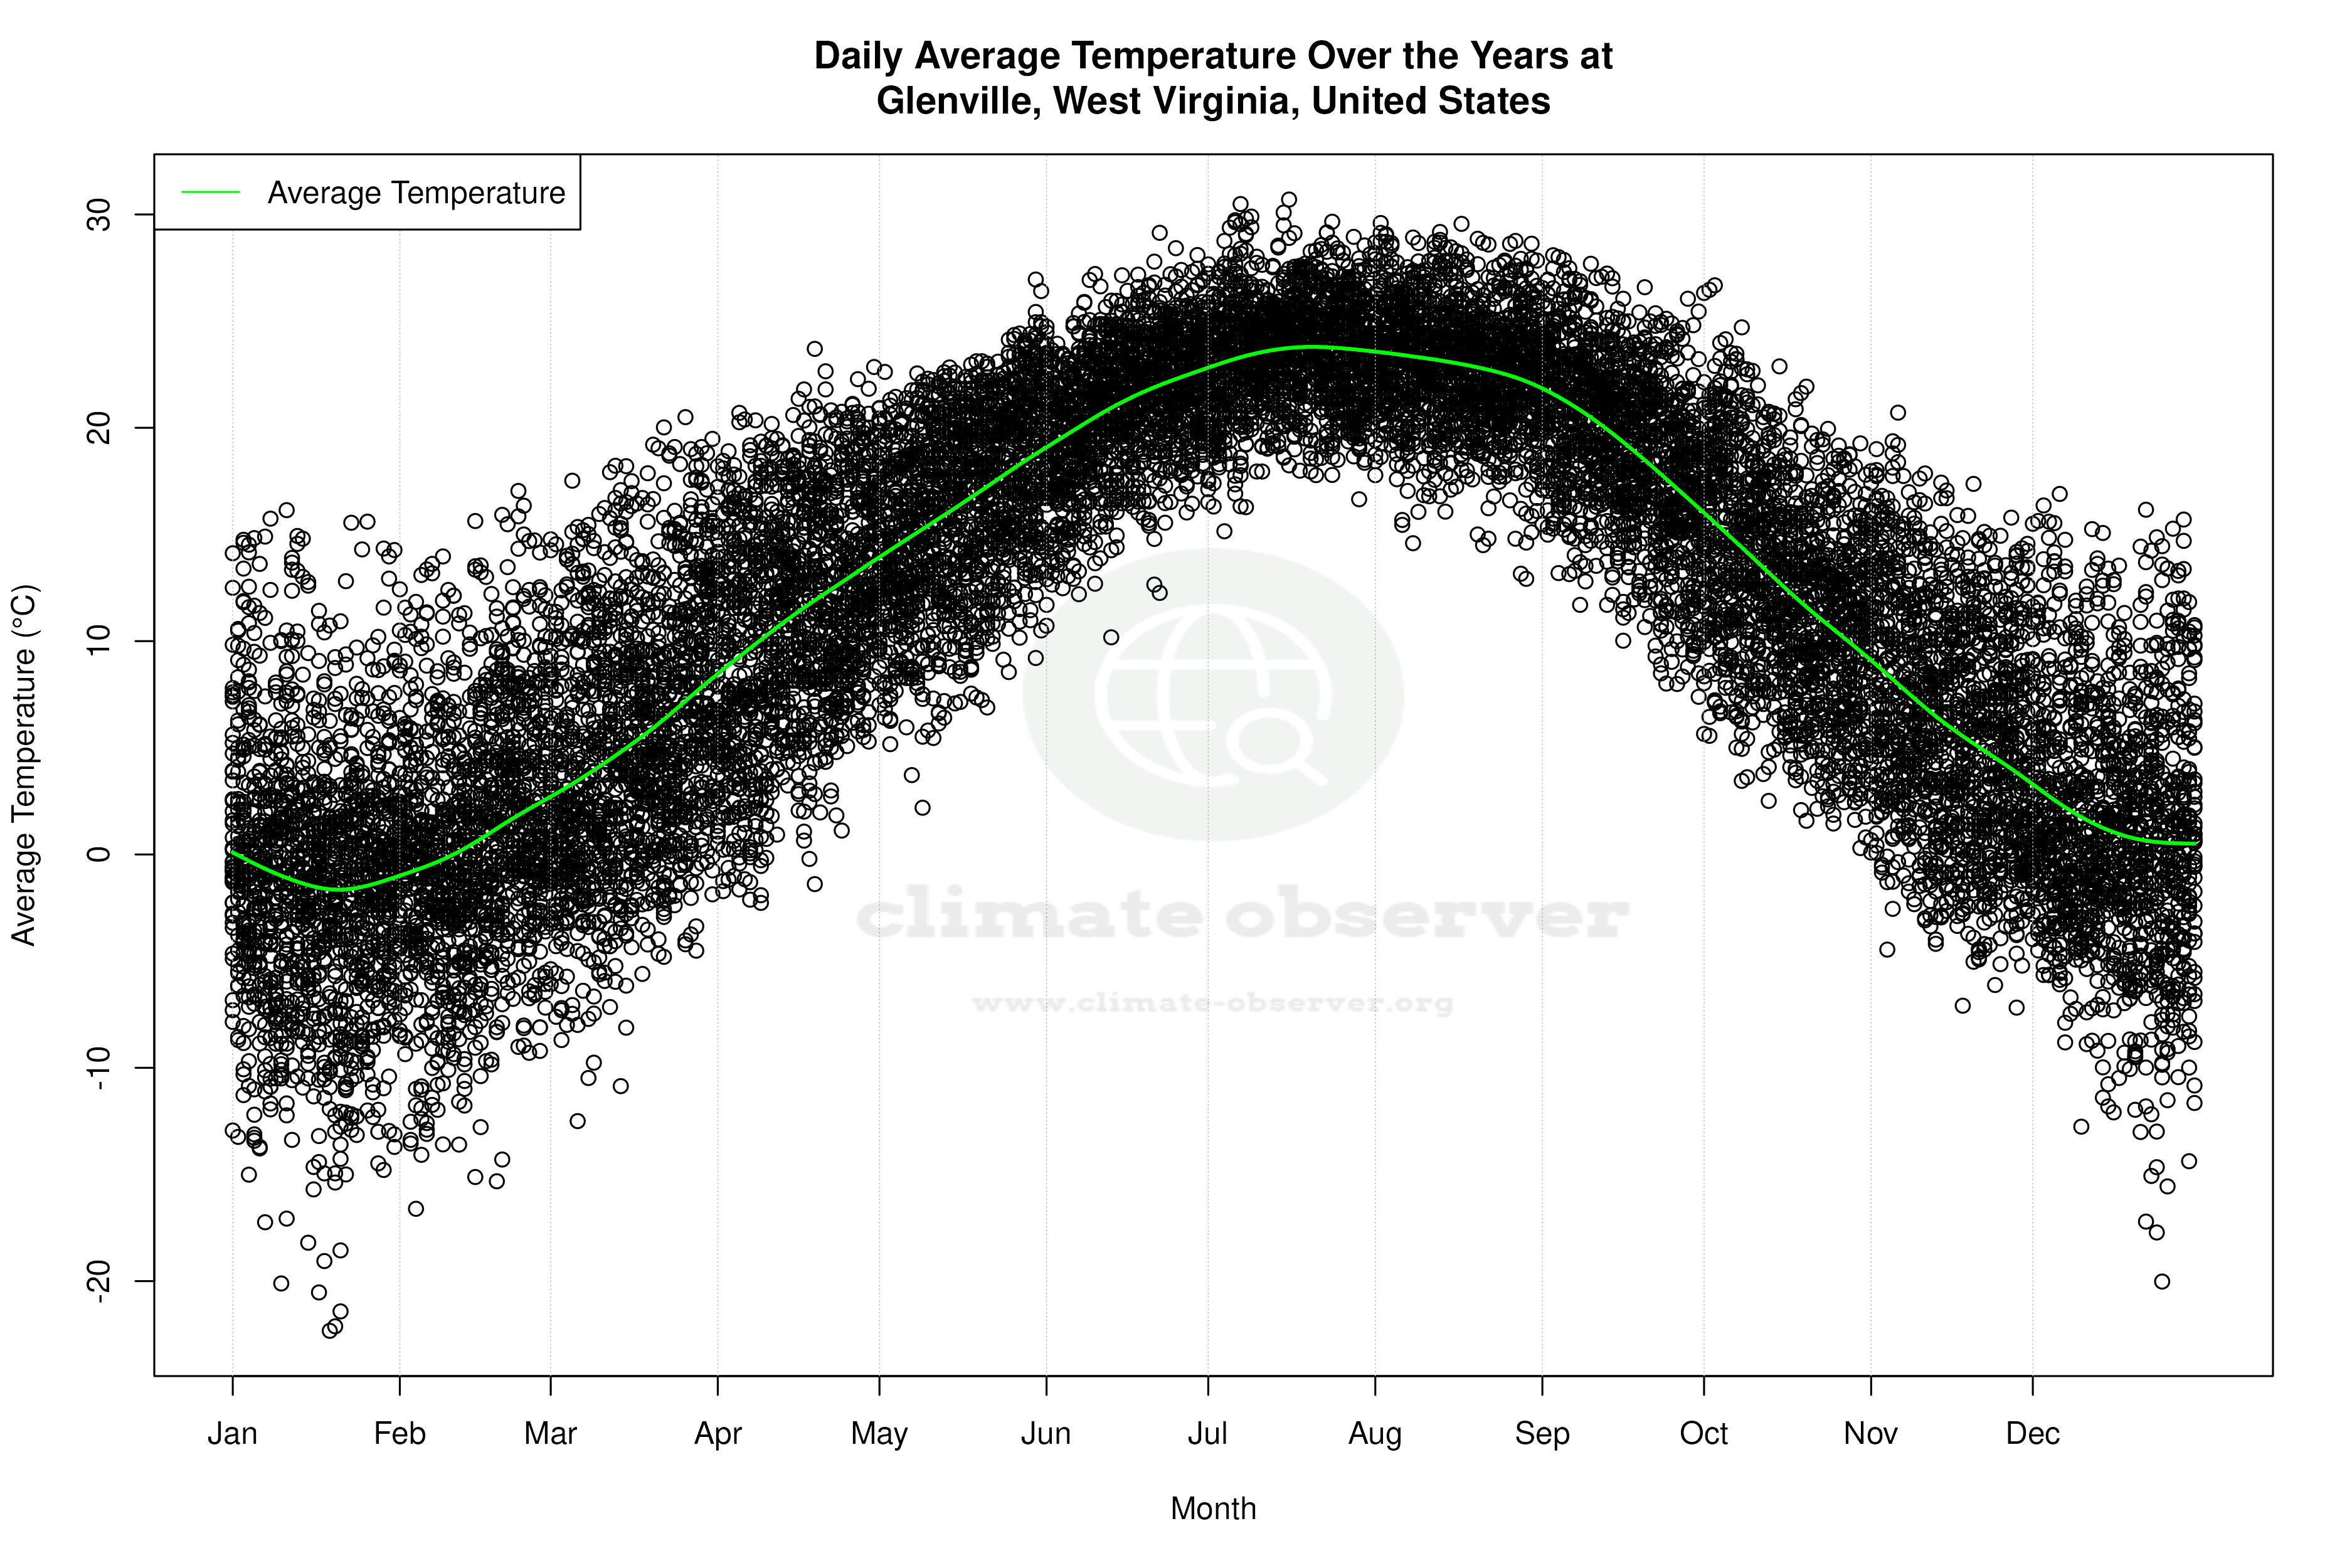


Average Max Temperature Throughout Year | 1 of 5
