Climate for Station: Innoko Flats Alaska, Alaska, United States
Loading live weather...
Climate Analysis & Overview
The Innoko Flats in Alaska is experiencing a cooling trend, with significant temperature decreases over the past decade. Despite the cooling, the region's climate remains dynamic, influenced by its unique geography and the absence of concentrated precipitation patterns.
Climate Classification and Geographic Influence
Innoko Flats, located in the Unorganized Borough of Alaska, falls under the Köppen climate classification of Dfc, which denotes a subarctic climate with cool summers and no dry season. The region's geography, marked by flat terrain and proximity to the Innoko River, plays a crucial role in its climatic patterns. The vast, open landscape allows for significant temperature fluctuations, while the river can modulate local temperatures and humidity levels.
Decadal Cooling Patterns
Over the past ten years, Innoko Flats has experienced a notable cooling trend. High temperatures have decreased by 2.06°C (3.71°F), and lows have fallen by 1.51°C (2.72°F). This recent cooling is more pronounced than the all-time trends, which show a more modest fall in highs by 0.06°C (0.11°F) and lows by 0.09°C (0.17°F). These trends suggest a shift towards cooler conditions in the short term, despite the long-term stability.
Temperature Extremes and Records
Innoko Flats has recorded extreme temperatures, with an all-time high of 42.8°C (109.0°F) and a low of -40.6°C (-41.1°F). These extremes highlight the region's capacity for significant thermal variation, a characteristic of its subarctic climate. Such records are crucial for understanding the potential range of temperature fluctuations that can occur in this area.
Precipitation Patterns and Monitoring Gaps
The Precipitation Concentration Index (PCI) for Innoko Flats remains undefined, indicating a monitoring gap in precipitation data. PCI measures how precipitation is distributed over time, with higher values indicating more concentrated rainfall events. The absence of PCI data suggests that precipitation patterns remain unquantified, leaving a gap in understanding the region's hydrological dynamics.
Regional Climate Context
The cooling trends in Innoko Flats occur against the backdrop of broader climate goals in the United States, which aim to mitigate climate change impacts. While the region is cooling, other parts of the country may experience warming, underscoring the complexity and variability of climate patterns across different locales. Recent weather events, such as unusual cold snaps or warm spells, may further influence local climate perceptions and policy discussions.
Station Statistics
10-Year Trend
High: -2.21 °C/decade
Low: -1.53 °C/decade
Rain: N/A
25-Year Trend
High: -1.08 °C/decade
Low: -0.72 °C/decade
Rain: N/A
50-Year Trend
High: -0.15 °C/decade
Low: -0.12 °C/decade
Rain: N/A
All-Time Trend
High: -0.15 °C/decade
Low: -0.12 °C/decade
Rain: N/A
Percentage Above-Average Days
Last 12 Months: 45.3%
This Year: 45.1%
Precipitation Concentration Index (PCI) ℹ️
Last 12 Months: N/A
Historical Average: N/A
Percentile Rank of Last 12 Months ℹ️
High: 45th percentile
Low: 55th percentile
Rain: N/A
Change in Variance ℹ️
High: -9.9%
Low: -6.7%
Intraday: -18.9%
Data Coverage
74.8%
First Year of Data
1988
Station Location
Historical Weather Records
| Max High | Avg High | Min High | Max Avg | Avg Avg | Min Avg | Max Low | Avg Low | Min Low | Max Precipitation | Avg Precipitation | Max Snow | Avg Snow | |
|---|---|---|---|---|---|---|---|---|---|---|---|---|---|
| Record | 51.1 °C | — | -37.2 °C | 44.1 °C | — | -39.4 °C | 38.3 °C | — | -40.6 °C | — | — | — | — |
| January | 7.8 °C | -14.0 °C | -37.2 °C | 3.2 °C | -16.3 °C | -39.4 °C | 1.7 °C | -18.5 °C | -40.6 °C | — | — | — | — |
| February | 17.8 °C | -11.1 °C | -36.1 °C | 12.1 °C | -14.5 °C | -38.6 °C | 1.7 °C | -17.4 °C | -40.6 °C | — | — | — | — |
| March | 18.9 °C | -6.0 °C | -25.0 °C | 12.6 °C | -10.8 °C | -29.8 °C | 1.7 °C | -14.9 °C | -32.8 °C | — | — | — | — |
| April | 35.0 °C | 4.0 °C | -18.9 °C | 24.6 °C | -1.3 °C | -21.8 °C | 17.2 °C | -6.1 °C | -26.1 °C | — | — | — | — |
| May | 47.8 °C | 13.2 °C | -7.2 °C | 37.4 °C | 7.8 °C | -13.3 °C | 28.3 °C | 2.6 °C | -20.0 °C | — | — | — | — |
| June | 34.4 °C | 19.1 °C | 3.9 °C | 26.2 °C | 13.4 °C | 1.8 °C | 20.0 °C | 8.2 °C | -1.7 °C | — | — | — | — |
| July | 32.2 °C | 19.4 °C | 8.3 °C | 28.0 °C | 14.2 °C | 4.2 °C | 23.3 °C | 9.8 °C | 0.6 °C | — | — | — | — |
| August | 40.0 °C | 16.5 °C | 3.9 °C | 35.1 °C | 12.0 °C | 0.9 °C | 30.6 °C | 8.4 °C | -1.7 °C | — | — | — | — |
| September | 51.1 °C | 10.5 °C | -30.6 °C | 44.1 °C | 6.4 °C | -8.1 °C | 38.3 °C | 3.3 °C | -34.4 °C | — | — | — | — |
| October | 26.7 °C | -0.4 °C | -35.0 °C | 24.9 °C | -3.1 °C | -38.6 °C | 22.2 °C | -5.4 °C | -22.8 °C | — | — | — | — |
| November | 5.0 °C | -9.3 °C | -28.3 °C | 3.5 °C | -11.5 °C | -30.1 °C | 2.2 °C | -13.6 °C | -32.2 °C | — | — | — | — |
| December | 3.9 °C | -13.4 °C | -31.7 °C | 2.7 °C | -15.6 °C | -33.7 °C | 0.6 °C | -17.7 °C | -35.6 °C | — | — | — | — |
Data Visualisations
Remove WatermarksCurrent Year Climate Trends vs Historical


Max Temperature this Year | 1 of 6
Climate 12-Month Moving Averages


Max Temperature 12-Month MA | 1 of 6
Daily Data Points and Averages Throughout the Year
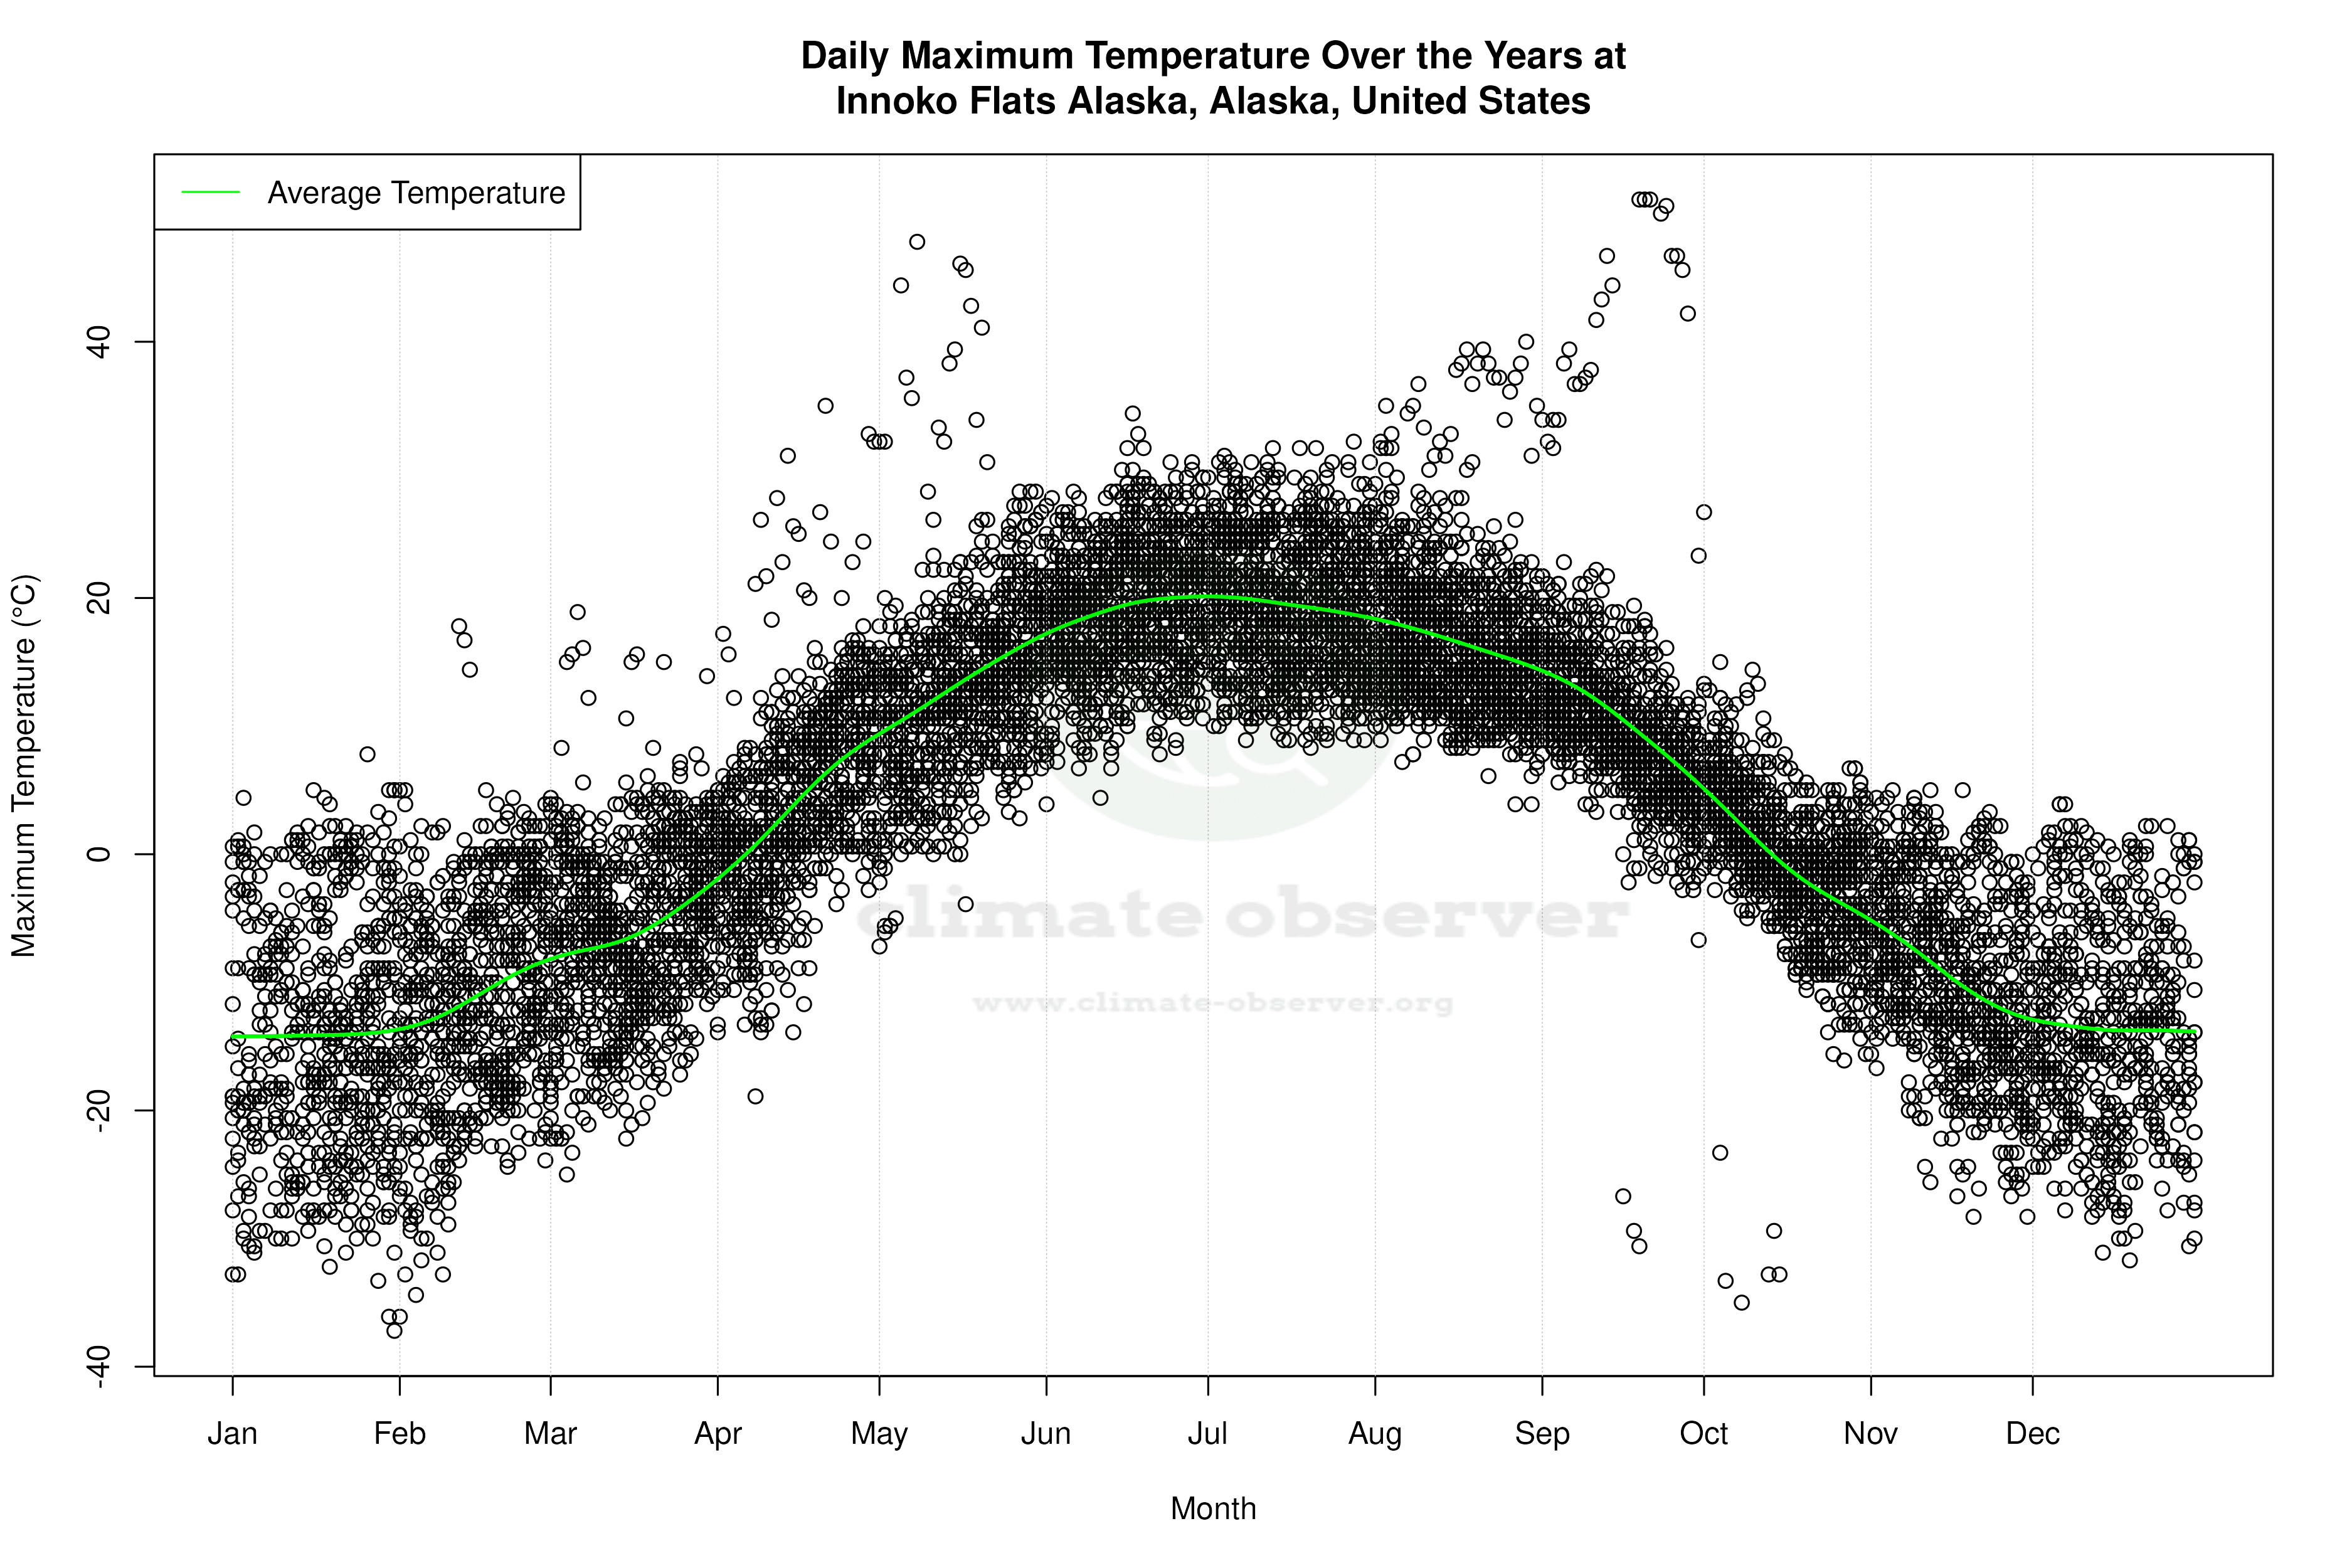


Average Max Temperature Throughout Year | 1 of 5