Climate for Station: Ft Myers Page Fld Ap, Florida, United States
Loading live weather...
Climate Analysis & Overview
Fort Myers Page Field Airport is experiencing a warming trend, with both high and low temperatures rising over the past decade and all-time records. The precipitation pattern shows a slight increase in concentration, indicating more intense rainfall events. These changes align with broader regional climate goals to monitor and adapt to evolving weather patterns.
Subtropical Climate Dynamics
Fort Myers Page Field Airport, located at 26.585°N, 81.8614°W, sits within a humid subtropical climate zone, characterised by hot, humid summers and mild winters. The Gulf of Mexico's proximity plays a significant role in moderating temperatures and influencing local weather patterns. Over the past decade, the region has seen a notable warming trend, with high temperatures increasing by 0.45°C (0.81°F) and lows by 0.39°C (0.70°F). This is more pronounced than the all-time trends, where highs have risen by 0.16°C (0.29°F) and lows by 0.13°C (0.24°F). Such trends suggest a gradual warming, consistent with broader global climate patterns.
Temperature Extremes and Records
Temperature extremes at Fort Myers reflect the region's subtropical climate. The highest recorded temperature is 39.4°C (102.9°F), while the lowest plummeted to -4.4°C (24.1°F). These records highlight the range of temperatures the area can experience, despite its typically mild winters. The warming trends, both in the short and long term, suggest that such extremes may become more frequent or intense, posing challenges for local infrastructure and ecosystems.
Precipitation Patterns and Changes
The Precipitation Concentration Index (PCI) at Fort Myers has seen a slight increase from a baseline of 13.88 to 14.15. The PCI measures how rainfall is distributed over time, with higher values indicating more concentrated precipitation events. This marginal increase suggests a shift towards more intense rainfall events, which can lead to challenges such as flooding and erosion. Understanding these changes is vital for planning and adaptation strategies, particularly in a region prone to tropical storms and hurricanes.
Regional Climate Context
The observed trends at Fort Myers Page Field Airport are part of a larger narrative of climate change affecting the southeastern United States. As regional climate goals focus on resilience and adaptation, monitoring these trends becomes crucial. Recent weather events, such as hurricanes and severe storms, underscore the importance of understanding and preparing for the impacts of a warming climate. The data from Fort Myers provides valuable insights into how local conditions are evolving and what may be expected in the future.
Station Statistics
10-Year Trend
High: +0.32 °C/decade
Low: +0.22 °C/decade
Rain: -0.58 mm/decade
25-Year Trend
High: +0.63 °C/decade
Low: +0.76 °C/decade
Rain: -0.02 mm/decade
50-Year Trend
High: +0.22 °C/decade
Low: +0.35 °C/decade
Rain: -0.05 mm/decade
All-Time Trend
High: +0.16 °C/decade
Low: +0.13 °C/decade
Rain: -0.03 mm/decade
Percentage Above-Average Days
Last 12 Months: 69.9%
This Year: 77.5%
Precipitation Concentration Index (PCI) ℹ️
Last 12 Months: 10.6
Historical Average: 14.9
Percentile Rank of Last 12 Months ℹ️
High: 92nd percentile
Low: 89th percentile
Rain: 9th percentile
Change in Variance ℹ️
High: -18.2%
Low: -12.5%
Intraday: -19.9%
Data Coverage
83.5%
First Year of Data
1892
Station Location
Historical Weather Records
| Max High | Avg High | Min High | Max Avg | Avg Avg | Min Avg | Max Low | Avg Low | Min Low | Max Precipitation | Avg Precipitation | Max Snow | Avg Snow | |
|---|---|---|---|---|---|---|---|---|---|---|---|---|---|
| Record | 39.4 °C | — | 4.4 °C | 33.3 °C | — | 1.7 °C | 28.3 °C | — | -4.4 °C | 252.0 mm | — | 0.0 mm | — |
| January | 31.1 °C | 23.6 °C | 6.7 °C | 25.6 °C | 17.6 °C | 4.1 °C | 22.8 °C | 12.2 °C | -2.8 °C | 63.5 mm | 1.6 mm | 0.0 mm | 0.0 mm |
| February | 33.3 °C | 24.6 °C | 4.4 °C | 25.8 °C | 19.1 °C | 5.5 °C | 22.2 °C | 12.9 °C | -2.8 °C | 128.5 mm | 1.8 mm | 0.0 mm | 0.0 mm |
| March | 34.4 °C | 26.7 °C | 11.1 °C | 27.8 °C | 21.1 °C | 6.5 °C | 25.0 °C | 14.9 °C | 0.6 °C | 142.2 mm | 1.8 mm | 0.0 mm | 0.0 mm |
| April | 35.6 °C | 29.1 °C | 17.2 °C | 28.9 °C | 23.4 °C | 12.8 °C | 25.6 °C | 17.1 °C | 3.9 °C | 118.6 mm | 1.7 mm | 0.0 mm | 0.0 mm |
| May | 37.2 °C | 31.4 °C | 21.1 °C | 31.1 °C | 25.9 °C | 18.3 °C | 27.8 °C | 19.9 °C | 10.0 °C | 135.4 mm | 3.1 mm | 0.0 mm | 0.0 mm |
| June | 39.4 °C | 32.3 °C | 23.3 °C | 33.3 °C | 27.4 °C | 21.6 °C | 27.8 °C | 22.4 °C | 14.9 °C | 168.7 mm | 8.1 mm | 0.0 mm | 0.0 mm |
| July | 38.3 °C | 32.6 °C | 25.0 °C | 31.5 °C | 27.8 °C | 23.6 °C | 28.3 °C | 23.4 °C | 19.4 °C | 103.1 mm | 6.9 mm | 0.0 mm | 0.0 mm |
| August | 37.8 °C | 32.8 °C | 24.4 °C | 31.6 °C | 27.8 °C | 23.3 °C | 28.3 °C | 23.6 °C | 18.3 °C | 189.7 mm | 7.1 mm | 0.0 mm | 0.0 mm |
| September | 36.7 °C | 31.9 °C | 23.9 °C | 30.3 °C | 27.2 °C | 21.8 °C | 27.2 °C | 23.1 °C | 17.2 °C | 203.7 mm | 6.8 mm | 0.0 mm | 0.0 mm |
| October | 35.0 °C | 29.6 °C | 17.8 °C | 29.4 °C | 25.0 °C | 13.1 °C | 26.7 °C | 20.3 °C | 8.3 °C | 252.0 mm | 3.0 mm | 0.0 mm | 0.0 mm |
| November | 35.0 °C | 26.6 °C | 11.7 °C | 28.2 °C | 21.6 °C | 11.4 °C | 25.0 °C | 16.0 °C | 1.1 °C | 87.5 mm | 1.2 mm | 0.0 mm | 0.0 mm |
| December | 32.8 °C | 24.4 °C | 5.6 °C | 25.6 °C | 19.1 °C | 1.7 °C | 23.3 °C | 13.2 °C | -4.4 °C | 92.5 mm | 1.3 mm | 0.0 mm | 0.0 mm |
Data Visualisations
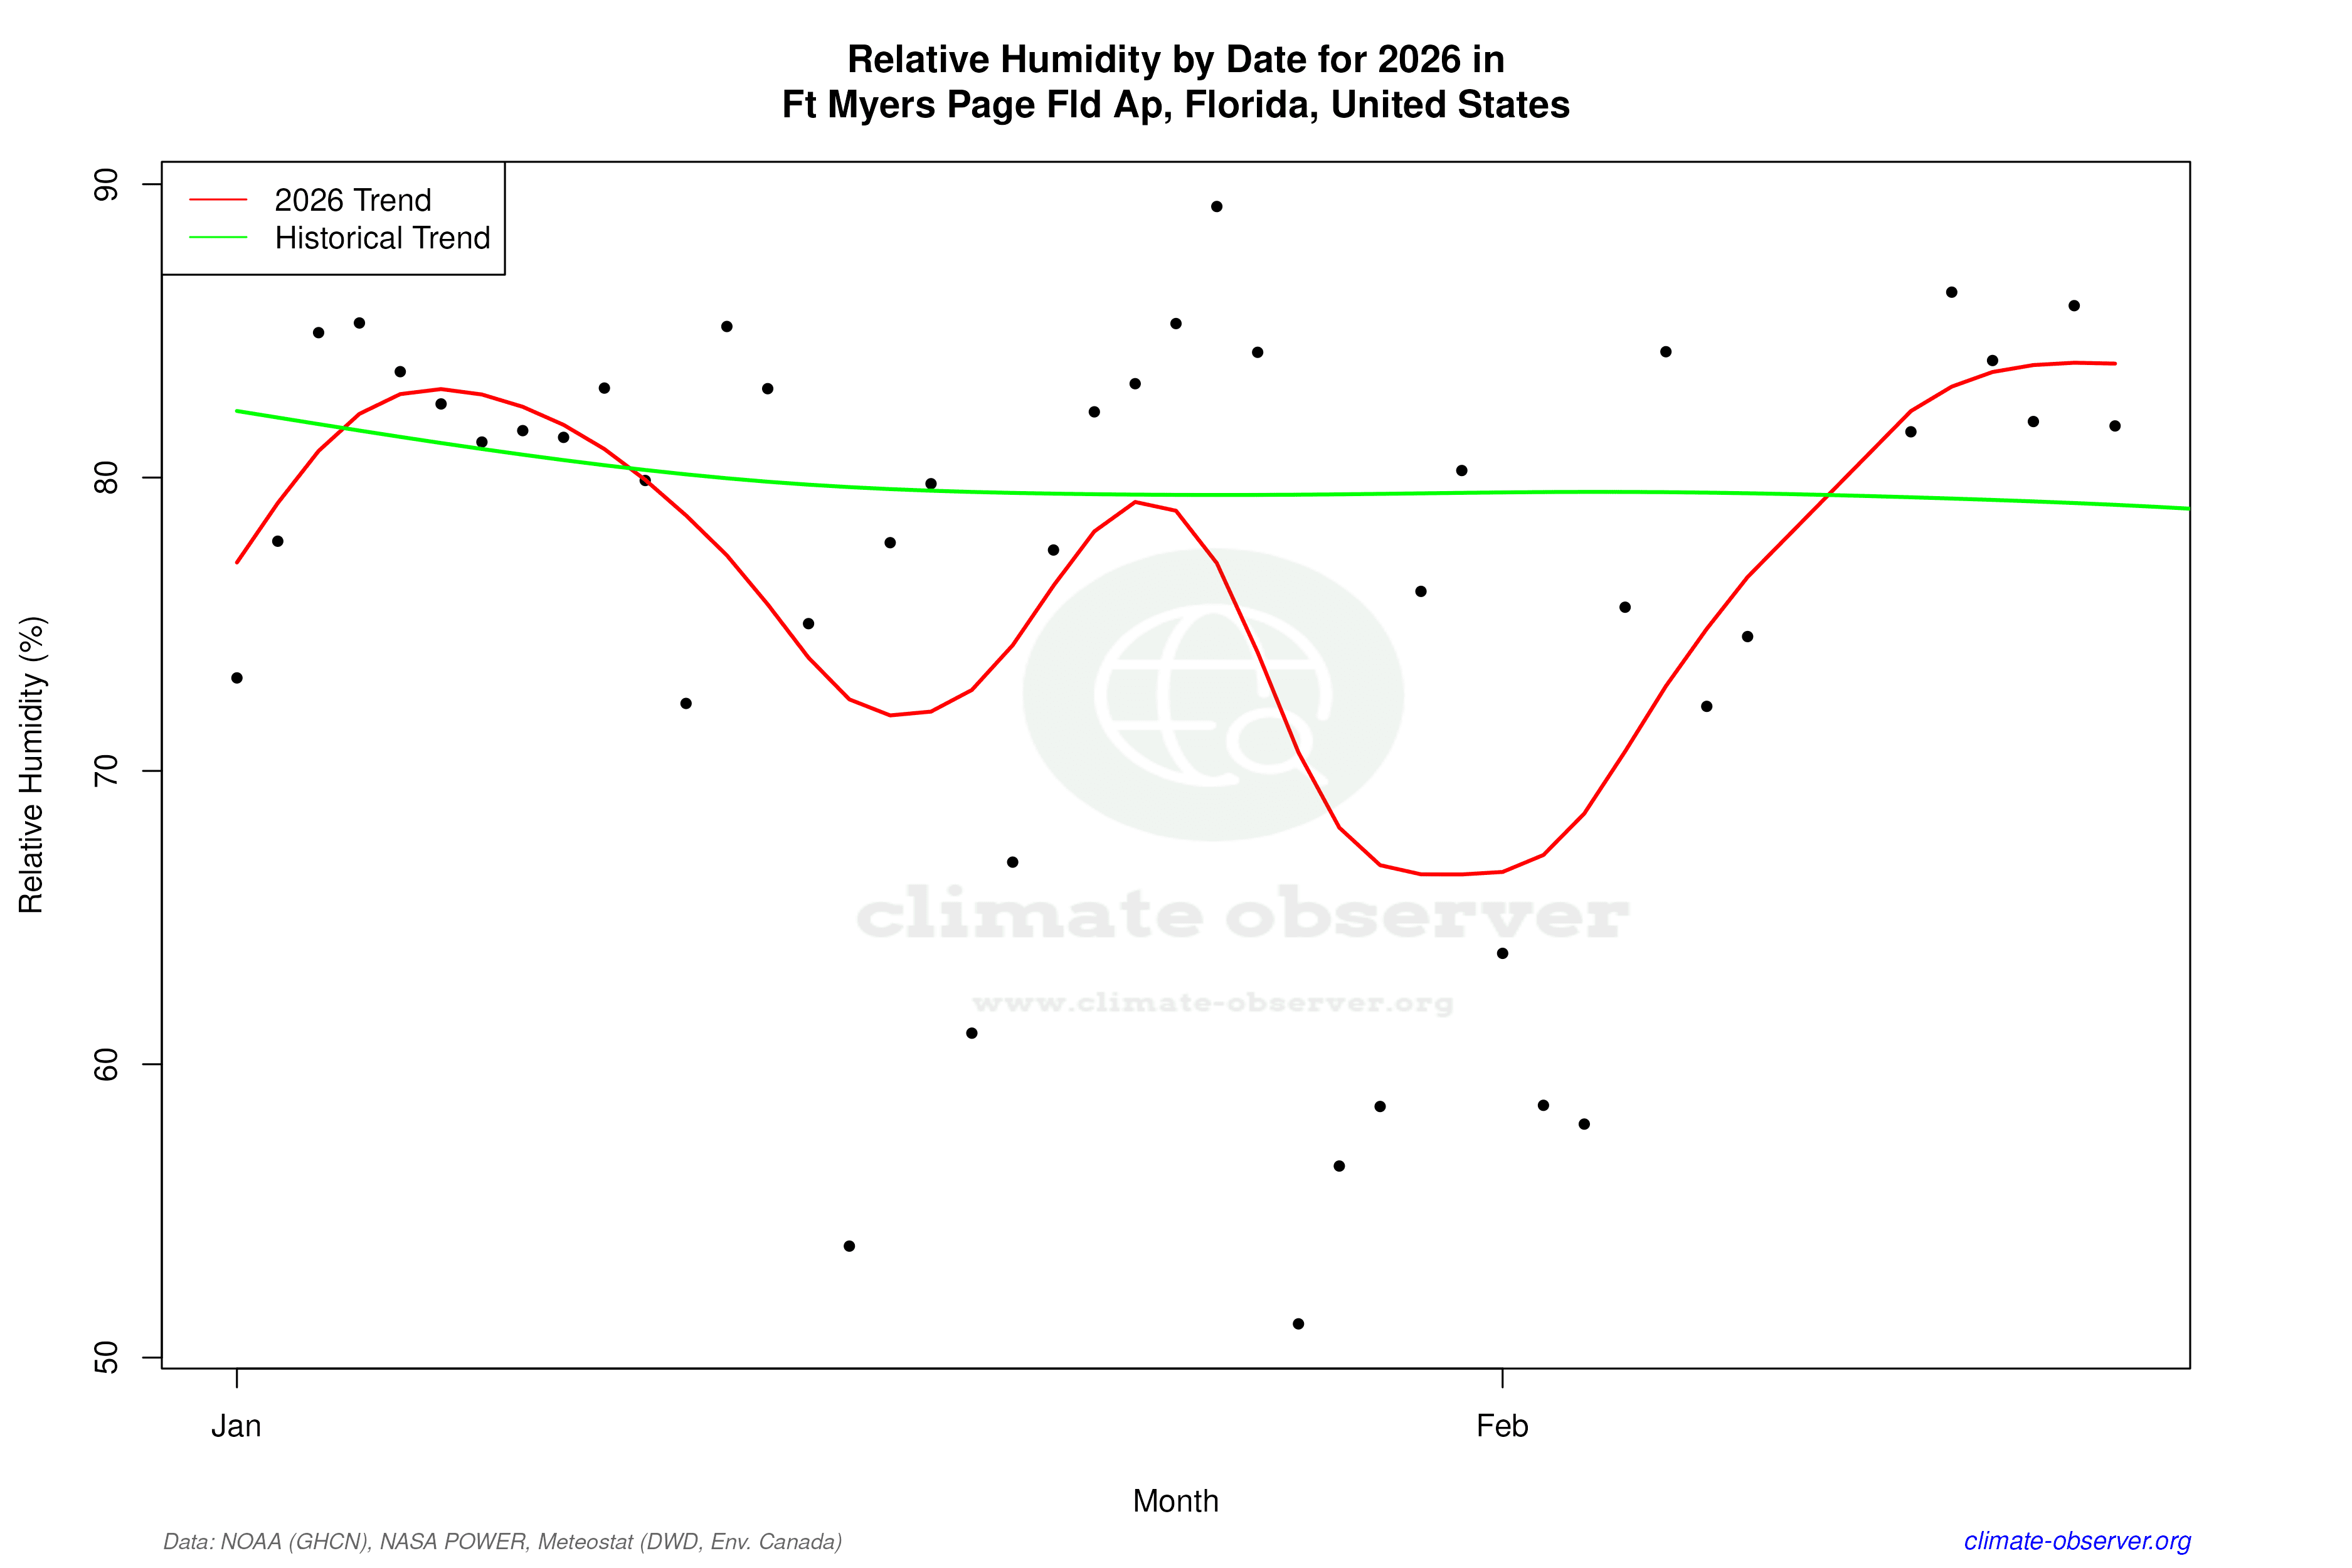
Remove WatermarksCurrent Year Climate Trends vs Historical


Max Temperature this Year | 1 of 6
Climate 12-Month Moving Averages


Max Temperature 12-Month MA | 1 of 6
Daily Data Points and Averages Throughout the Year


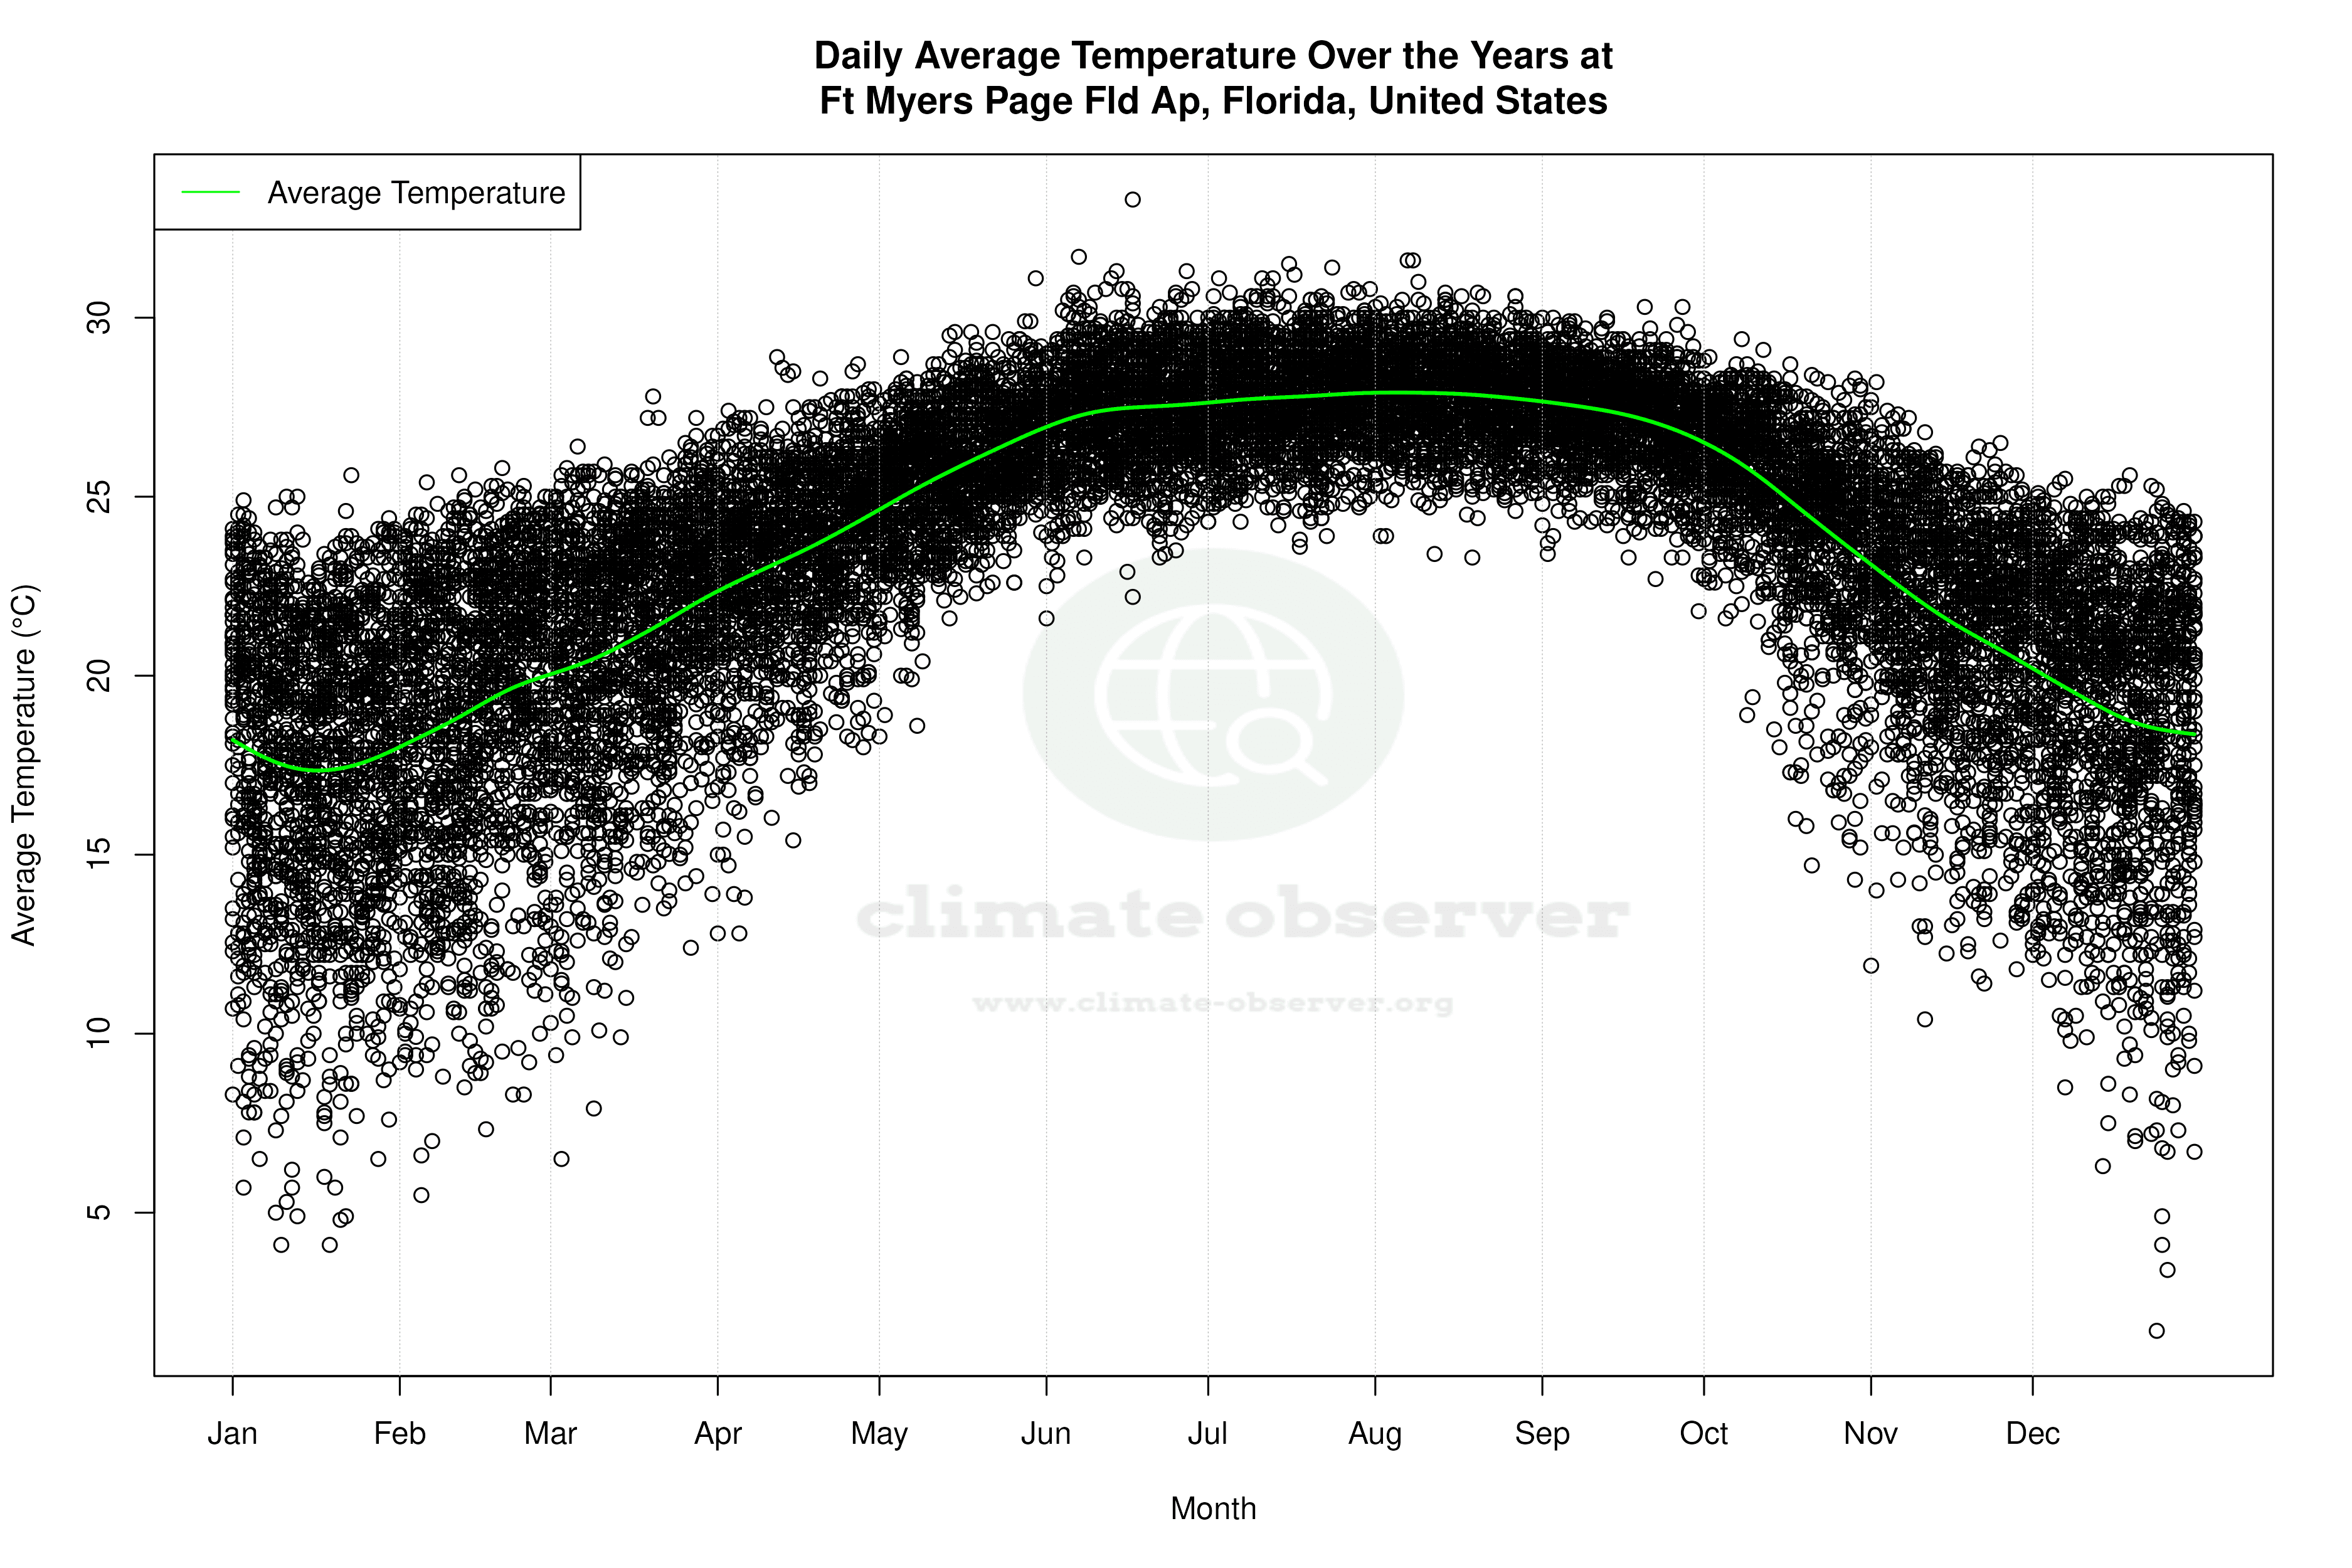


Average Max Temperature Throughout Year | 1 of 5
