Climate for Station: Houston Intercontinental Ap, Texas, United States
Loading live weather...
Climate Analysis & Overview
Houston Intercontinental Airport is experiencing a warming trend, with both high and low temperatures rising over the past decade. The precipitation has become more evenly distributed, suggesting a shift in weather patterns. As climate goals evolve, these changes present both challenges and opportunities for the region.
Warming Trends in Houston
Houston Intercontinental Airport, located at 29.98°N, 95.36°W, sits within a humid subtropical climate zone, characterised by hot summers and mild winters. Over the past decade, the airport has seen a notable warming trend. High temperatures have increased by 0.99°C (1.79°F), while low temperatures have risen by 0.59°C (1.06°F). This trend is more pronounced than the all-time trends, which show a more modest rise of 0.33°C (0.59°F) for highs and 0.54°C (0.98°F) for lows. This suggests that recent years have been warmer than the historical average, aligning with broader regional climate patterns and goals to monitor and adapt to climate change.
Temperature Extremes and Records
The all-time temperature records at Houston Intercontinental Airport highlight the extremes the region can experience. The highest recorded temperature is 42.8°C (109.0°F), while the lowest is -13.9°C (7.0°F). These figures underscore the variability of the local climate, influenced by Houston's proximity to the Gulf of Mexico, which moderates temperatures but can also contribute to severe weather events.
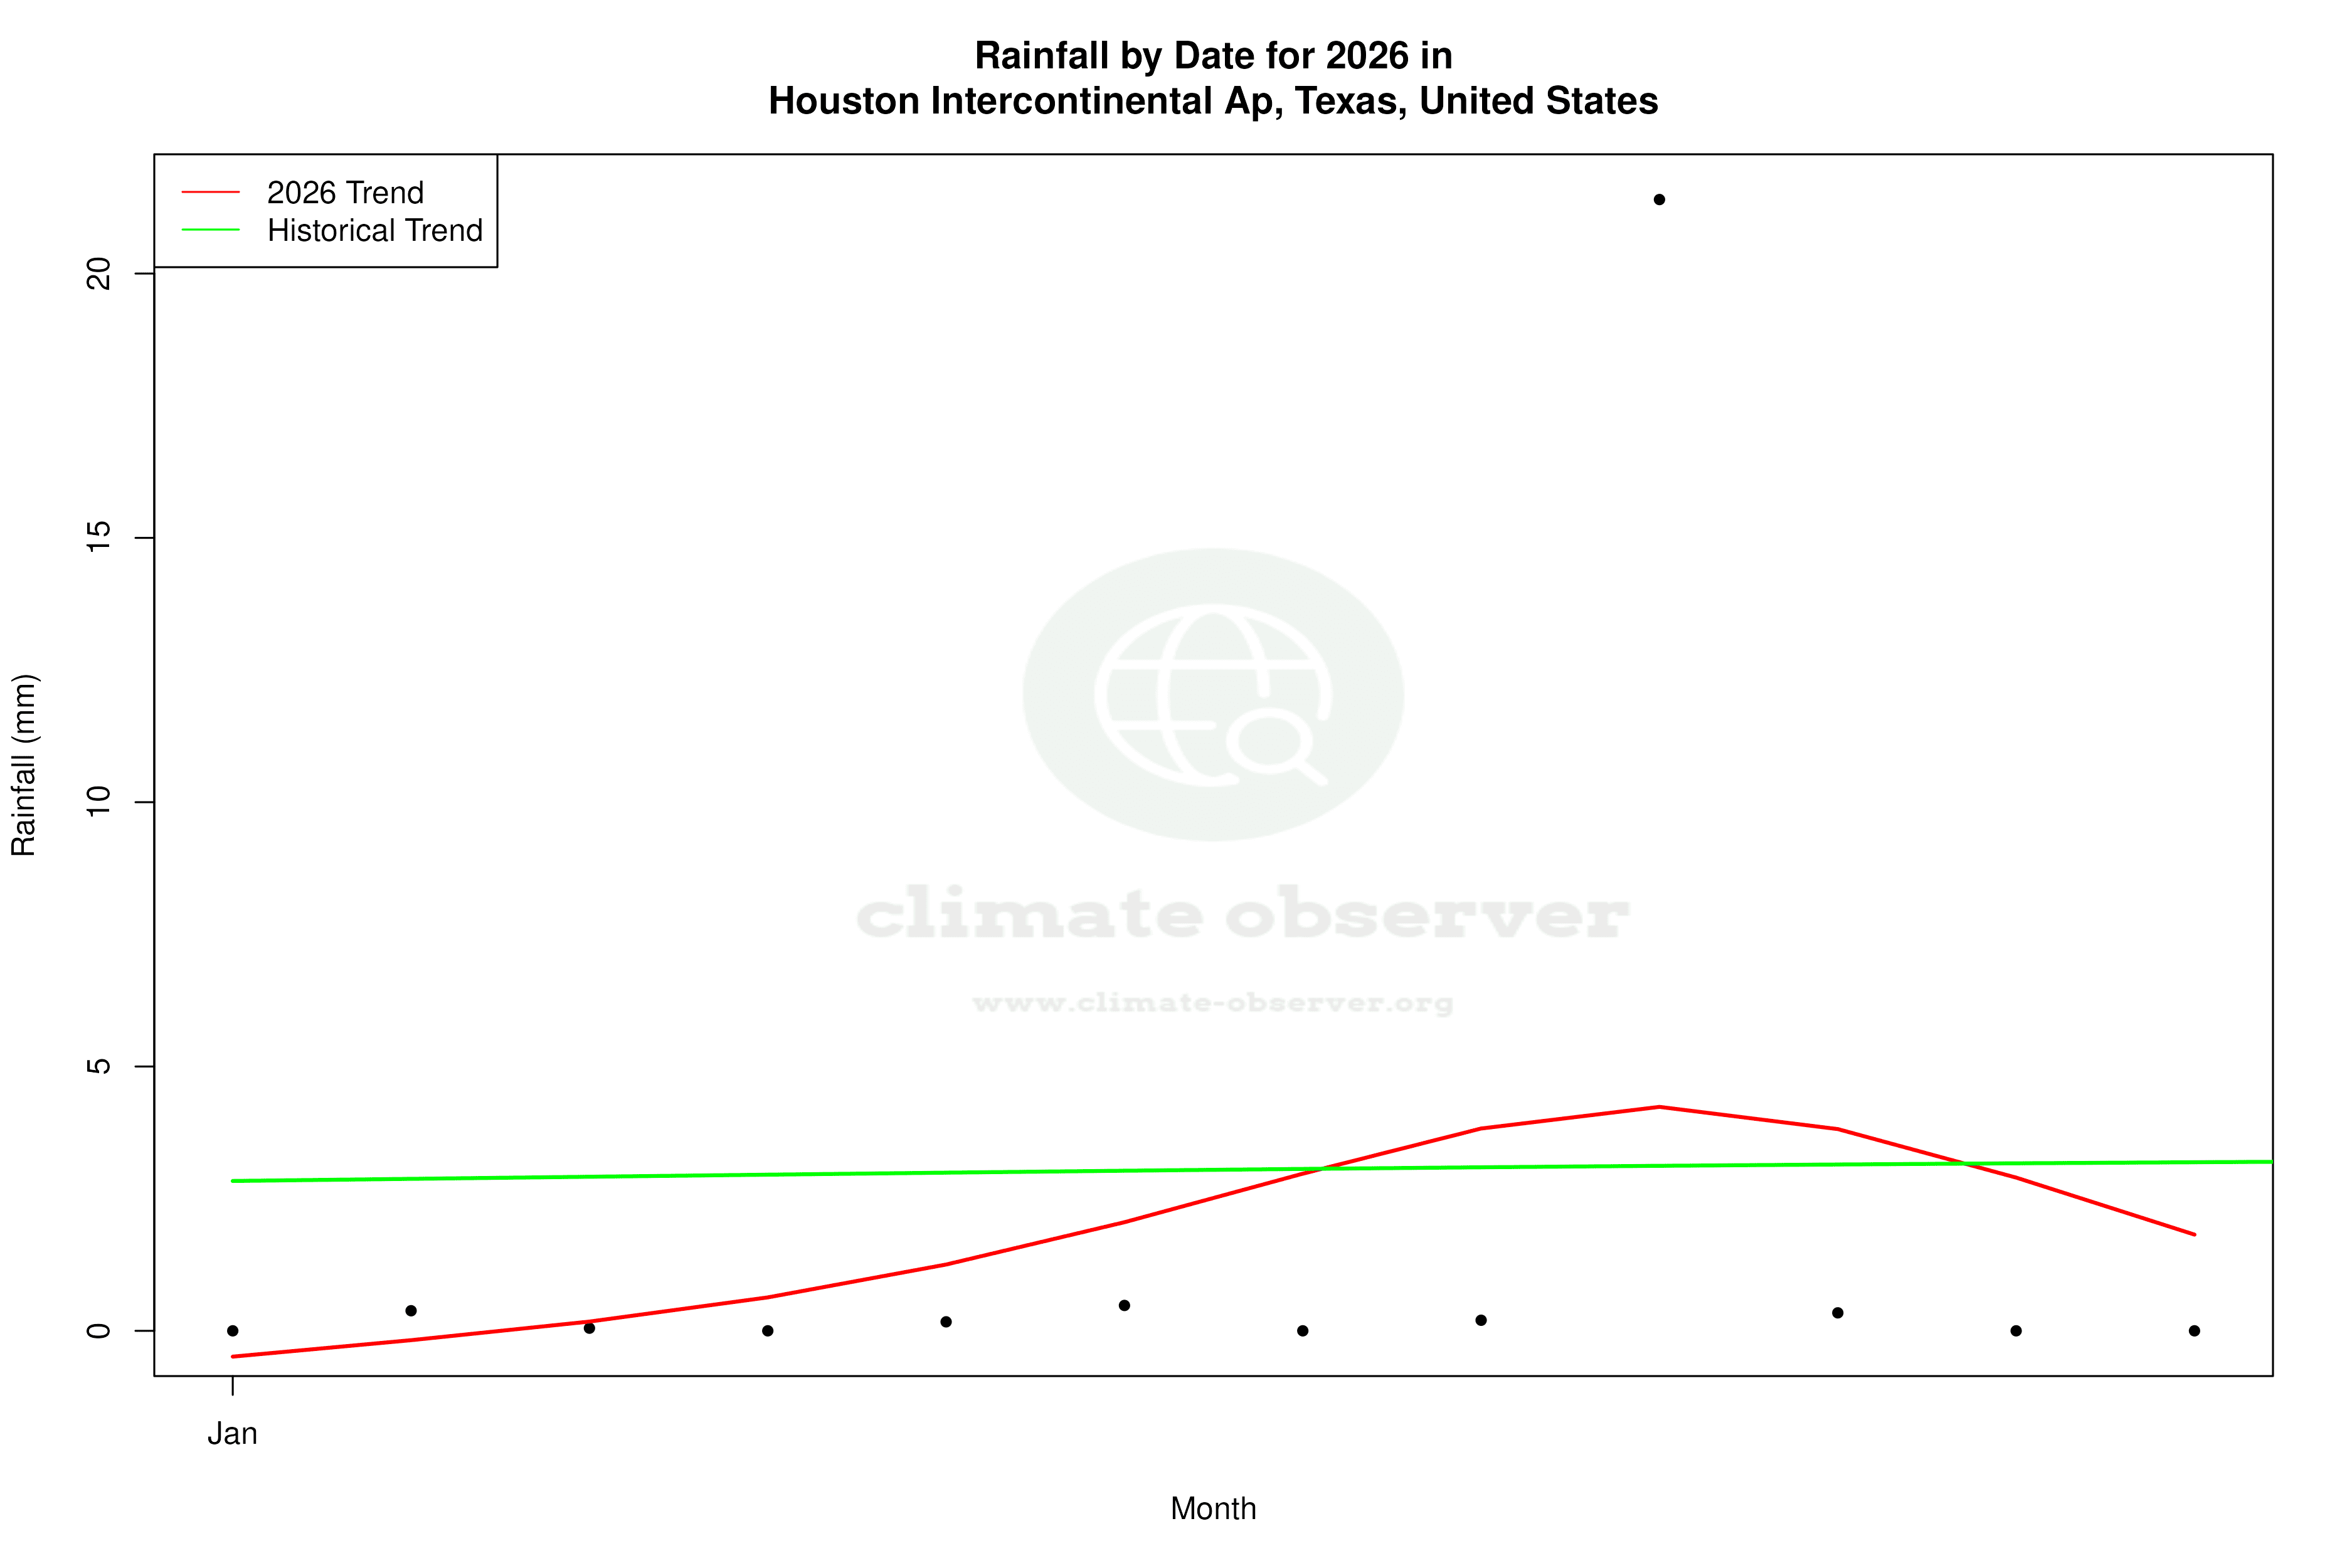
Precipitation Patterns Evolve
The Precipitation Concentration Index (PCI) at Houston Intercontinental Airport has decreased from a baseline of 12.25 to a current value of 10.17. This indicates a more even distribution of rainfall throughout the year, moving away from concentrated heavy downpours to more consistent precipitation events. This shift could have significant implications for water management and flood prevention strategies in the area, as more evenly distributed rainfall can reduce the risk of sudden flooding.
Geographical Influences on Climate
Houston's climate is heavily influenced by its geographical location near the Gulf Coast. This proximity results in high humidity and frequent thunderstorms, particularly in the summer months. The Gulf of Mexico acts as a heat reservoir, which can amplify temperature extremes and contribute to the warming trends observed at the airport. Additionally, the flat topography of the region allows for the free movement of air masses, which can lead to rapid weather changes.
Implications for Regional Climate Goals
As the United States continues to address climate change, the trends observed at Houston Intercontinental Airport provide valuable insights into the effectiveness of regional climate initiatives. The warming trends and changes in precipitation patterns highlight the need for adaptive strategies to mitigate the impacts of climate change. These include enhancing infrastructure resilience and developing sustainable water management practices to accommodate the evolving climate dynamics in Houston and beyond.
Station Statistics
10-Year Trend
High: +1.14 °C/decade
Low: +0.72 °C/decade
Rain: -1.20 mm/decade
25-Year Trend
High: +0.72 °C/decade
Low: +0.65 °C/decade
Rain: -0.15 mm/decade
50-Year Trend
High: +0.40 °C/decade
Low: +0.60 °C/decade
Rain: +0.05 mm/decade
All-Time Trend
High: +0.34 °C/decade
Low: +0.55 °C/decade
Rain: +0.01 mm/decade
Percentage Above-Average Days
Last 12 Months: 71.5%
This Year: 69.4%
Precipitation Concentration Index (PCI) ℹ️
Last 12 Months: 13.2
Historical Average: 12.5
Percentile Rank of Last 12 Months ℹ️
High: 99th percentile
Low: 98th percentile
Rain: 22nd percentile
Change in Variance ℹ️
High: -6.4%
Low: -4.9%
Intraday: -19.6%
Data Coverage
98.4%
First Year of Data
1969
Station Location
Historical Weather Records
| Max High | Avg High | Min High | Max Avg | Avg Avg | Min Avg | Max Low | Avg Low | Min Low | Max Precipitation | Avg Precipitation | Max Snow | Avg Snow | |
|---|---|---|---|---|---|---|---|---|---|---|---|---|---|
| Record | 42.8 °C | — | -3.8 °C | 34.0 °C | — | -8.8 °C | 28.9 °C | — | -13.9 °C | 237.3 mm | — | 51.0 mm | — |
| January | 29.4 °C | 17.0 °C | -1.7 °C | 25.4 °C | 11.3 °C | -4.0 °C | 21.7 °C | 5.7 °C | -11.1 °C | 102.9 mm | 3.1 mm | 51.0 mm | 0.1 mm |
| February | 32.8 °C | 19.3 °C | -3.8 °C | 24.4 °C | 13.4 °C | -6.3 °C | 22.8 °C | 7.7 °C | -10.5 °C | 56.4 mm | 2.5 mm | 36.0 mm | 0.1 mm |
| March | 32.8 °C | 23.2 °C | 3.3 °C | 25.9 °C | 17.3 °C | -0.3 °C | 23.3 °C | 11.4 °C | -5.6 °C | 189.7 mm | 2.6 mm | 0.0 mm | 0.0 mm |
| April | 35.0 °C | 26.5 °C | 10.6 °C | 28.5 °C | 20.7 °C | 7.4 °C | 25.6 °C | 15.1 °C | -0.6 °C | 207.3 mm | 3.0 mm | 0.0 mm | 0.0 mm |
| May | 37.2 °C | 30.0 °C | 15.6 °C | 31.1 °C | 24.5 °C | 13.2 °C | 27.8 °C | 19.3 °C | 5.6 °C | 129.5 mm | 4.5 mm | 0.0 mm | 0.0 mm |
| June | 41.7 °C | 33.1 °C | 23.3 °C | 33.0 °C | 27.6 °C | 19.9 °C | 28.3 °C | 22.6 °C | 11.7 °C | 143.0 mm | 4.5 mm | 0.0 mm | 0.0 mm |
| July | 40.6 °C | 34.4 °C | 23.9 °C | 33.1 °C | 28.6 °C | 21.9 °C | 28.3 °C | 23.6 °C | 16.7 °C | 91.2 mm | 2.9 mm | 0.0 mm | 0.0 mm |
| August | 42.8 °C | 34.7 °C | 23.9 °C | 34.0 °C | 28.6 °C | 22.2 °C | 28.3 °C | 23.5 °C | 15.6 °C | 237.3 mm | 3.2 mm | 0.0 mm | 0.0 mm |
| September | 42.8 °C | 32.1 °C | 19.4 °C | 33.3 °C | 26.0 °C | 15.0 °C | 28.9 °C | 20.9 °C | 8.9 °C | 194.6 mm | 3.7 mm | 0.0 mm | 0.0 mm |
| October | 37.2 °C | 27.9 °C | 10.0 °C | 30.6 °C | 21.4 °C | 4.9 °C | 27.8 °C | 15.5 °C | -1.7 °C | 116.1 mm | 3.7 mm | 0.0 mm | 0.0 mm |
| November | 31.7 °C | 22.4 °C | 3.9 °C | 26.8 °C | 16.4 °C | -0.7 °C | 25.6 °C | 10.4 °C | -7.2 °C | 96.8 mm | 3.1 mm | 0.0 mm | 0.0 mm |
| December | 29.4 °C | 18.6 °C | -2.8 °C | 25.8 °C | 12.6 °C | -8.8 °C | 24.4 °C | 7.1 °C | -13.9 °C | 86.6 mm | 2.9 mm | 43.0 mm | 0.1 mm |
Data Visualisations
Remove WatermarksCurrent Year Climate Trends vs Historical


Max Temperature this Year | 1 of 6
Climate 12-Month Moving Averages


Max Temperature 12-Month MA | 1 of 6
Daily Data Points and Averages Throughout the Year


Average Max Temperature Throughout Year | 1 of 5
