Climate for Station: Lafayette Rgnl Ap, Louisiana, United States
Loading live weather...
Climate Analysis & Overview
Lafayette Regional Airport's climate profile reveals a complex interplay of warming and cooling trends over different time scales. While the last decade shows a warming of highs by 0.14°C (0.25°F), the all-time data indicates a slight cooling of highs by 0.01°C (0.02°F). Meanwhile, the lows have cooled by 0.67°C (1.21°F) over the past decade, contrasting with a warming of 0.16°C (0.29°F) over the long term. Precipitation has become more evenly distributed, as indicated by the decrease in the Precipitation Concentration Index from 11.78 to 10.23.
Climate Classification and Geographic Influences
Lafayette Regional Airport, located in Lafayette Parish, Louisiana, is characterised by a humid subtropical climate (Köppen: Cfa). This classification is marked by hot, humid summers and mild winters, influenced by its proximity to the Gulf of Mexico. The region's flat topography and the presence of nearby water bodies play a significant role in moderating temperatures and contributing to the area's humidity levels.
Temperature Trends: A Mixed Picture
The temperature trends at Lafayette Regional Airport present a nuanced narrative. Over the past decade, there has been a warming trend in high temperatures, with an increase of 0.14°C (0.25°F). However, this is juxtaposed against an all-time cooling trend of highs by 0.01°C (0.02°F). This suggests recent years may be experiencing a reversal or deviation from historical patterns. In contrast, low temperatures have cooled significantly by 0.67°C (1.21°F) over the last ten years, while the all-time data shows a warming of 0.16°C (0.29°F), indicating a complex interaction of climatic forces.
Precipitation Patterns: A More Even Distribution
The Precipitation Concentration Index (PCI) provides insight into rainfall distribution. A decrease from a baseline of 11.78 to 10.23 indicates a trend towards more evenly distributed precipitation events. This shift suggests a reduction in the frequency of intense, concentrated rainfall events, which can have implications for local agriculture and water management strategies.
Record Extremes: A Spectrum of Conditions
Lafayette has experienced a wide range of temperature extremes, with a record high of 41.7°C (107.1°F) and a record low of -15.5°C (4.1°F). These extremes highlight the variability inherent in the region's climate, influenced by both local and broader atmospheric conditions. Such variability underscores the importance of adaptive strategies in response to potential impacts on infrastructure and public health.
Regional Climate Goals and Recent Events
In the context of the United States' regional climate goals, which aim to mitigate climate change impacts and enhance resilience, Lafayette's climate data provides valuable insights. Recent weather events, such as hurricanes and tropical storms, have underscored the need for robust climate adaptation measures. The observed trends and patterns at Lafayette Regional Airport can inform local and regional strategies to address the challenges posed by climate variability and change.
Station Statistics
10-Year Trend
High: +0.44 °C/decade
Low: -0.26 °C/decade
Rain: -1.20 mm/decade
25-Year Trend
High: +0.61 °C/decade
Low: +0.68 °C/decade
Rain: -0.15 mm/decade
50-Year Trend
High: +0.40 °C/decade
Low: +0.41 °C/decade
Rain: -0.19 mm/decade
All-Time Trend
High: -0.00 °C/decade
Low: +0.16 °C/decade
Rain: +0.02 mm/decade
Percentage Above-Average Days
Last 12 Months: 65.5%
This Year: 55.0%
Precipitation Concentration Index (PCI) ℹ️
Last 12 Months: 10.8
Historical Average: 12.3
Percentile Rank of Last 12 Months ℹ️
High: 87th percentile
Low: 96th percentile
Rain: 33rd percentile
Change in Variance ℹ️
High: -10.7%
Low: -0.3%
Intraday: -17.1%
Data Coverage
86.1%
First Year of Data
1919
Station Location
Historical Weather Records
| Max High | Avg High | Min High | Max Avg | Avg Avg | Min Avg | Max Low | Avg Low | Min Low | Max Precipitation | Avg Precipitation | Max Snow | Avg Snow | |
|---|---|---|---|---|---|---|---|---|---|---|---|---|---|
| Record | 43.3 °C | — | -8.3 °C | 34.2 °C | — | -8.8 °C | 28.9 °C | — | -15.5 °C | 263.7 mm | — | 356.0 mm | — |
| January | 30.6 °C | 16.8 °C | -6.1 °C | 25.2 °C | 11.2 °C | -7.1 °C | 23.9 °C | 5.8 °C | -15.5 °C | 147.3 mm | 4.2 mm | 229.0 mm | 0.2 mm |
| February | 30.6 °C | 18.5 °C | -8.3 °C | 24.3 °C | 13.1 °C | -6.6 °C | 22.8 °C | 7.4 °C | -14.4 °C | 191.0 mm | 3.9 mm | 356.0 mm | 0.3 mm |
| March | 33.9 °C | 22.3 °C | 2.2 °C | 25.6 °C | 16.8 °C | -0.1 °C | 24.4 °C | 10.8 °C | -5.6 °C | 105.4 mm | 3.5 mm | 0.0 mm | 0.0 mm |
| April | 33.9 °C | 26.1 °C | 10.0 °C | 28.8 °C | 20.3 °C | 7.2 °C | 27.2 °C | 14.4 °C | 0.0 °C | 199.1 mm | 3.8 mm | 0.0 mm | 0.0 mm |
| May | 36.7 °C | 29.7 °C | 17.2 °C | 31.1 °C | 24.2 °C | 12.6 °C | 26.7 °C | 18.3 °C | 5.6 °C | 263.7 mm | 4.1 mm | 0.0 mm | 0.0 mm |
| June | 41.1 °C | 32.5 °C | 21.1 °C | 32.1 °C | 26.9 °C | 19.6 °C | 27.8 °C | 21.7 °C | 11.7 °C | 243.8 mm | 4.8 mm | 0.0 mm | 0.0 mm |
| July | 41.7 °C | 33.0 °C | 22.2 °C | 31.8 °C | 27.7 °C | 22.8 °C | 27.8 °C | 22.8 °C | 15.6 °C | 143.8 mm | 5.4 mm | 0.0 mm | 0.0 mm |
| August | 43.3 °C | 33.2 °C | 23.3 °C | 34.2 °C | 27.6 °C | 21.6 °C | 28.9 °C | 22.6 °C | 14.4 °C | 166.8 mm | 4.6 mm | 0.0 mm | 0.0 mm |
| September | 39.4 °C | 31.4 °C | 16.7 °C | 32.8 °C | 25.4 °C | 15.5 °C | 27.2 °C | 20.2 °C | 5.0 °C | 150.4 mm | 4.0 mm | 0.0 mm | 0.0 mm |
| October | 36.7 °C | 27.3 °C | 10.6 °C | 29.0 °C | 20.7 °C | 5.0 °C | 26.1 °C | 14.3 °C | -2.8 °C | 180.3 mm | 3.1 mm | 0.0 mm | 0.0 mm |
| November | 33.3 °C | 22.1 °C | 3.3 °C | 26.7 °C | 15.8 °C | 1.1 °C | 24.4 °C | 9.4 °C | -6.1 °C | 119.9 mm | 3.4 mm | 28.0 mm | 0.0 mm |
| December | 31.7 °C | 18.0 °C | -3.9 °C | 25.3 °C | 12.4 °C | -8.8 °C | 24.4 °C | 6.7 °C | -12.8 °C | 180.3 mm | 4.2 mm | 0.0 mm | 0.0 mm |
Data Visualisations
Remove WatermarksCurrent Year Climate Trends vs Historical


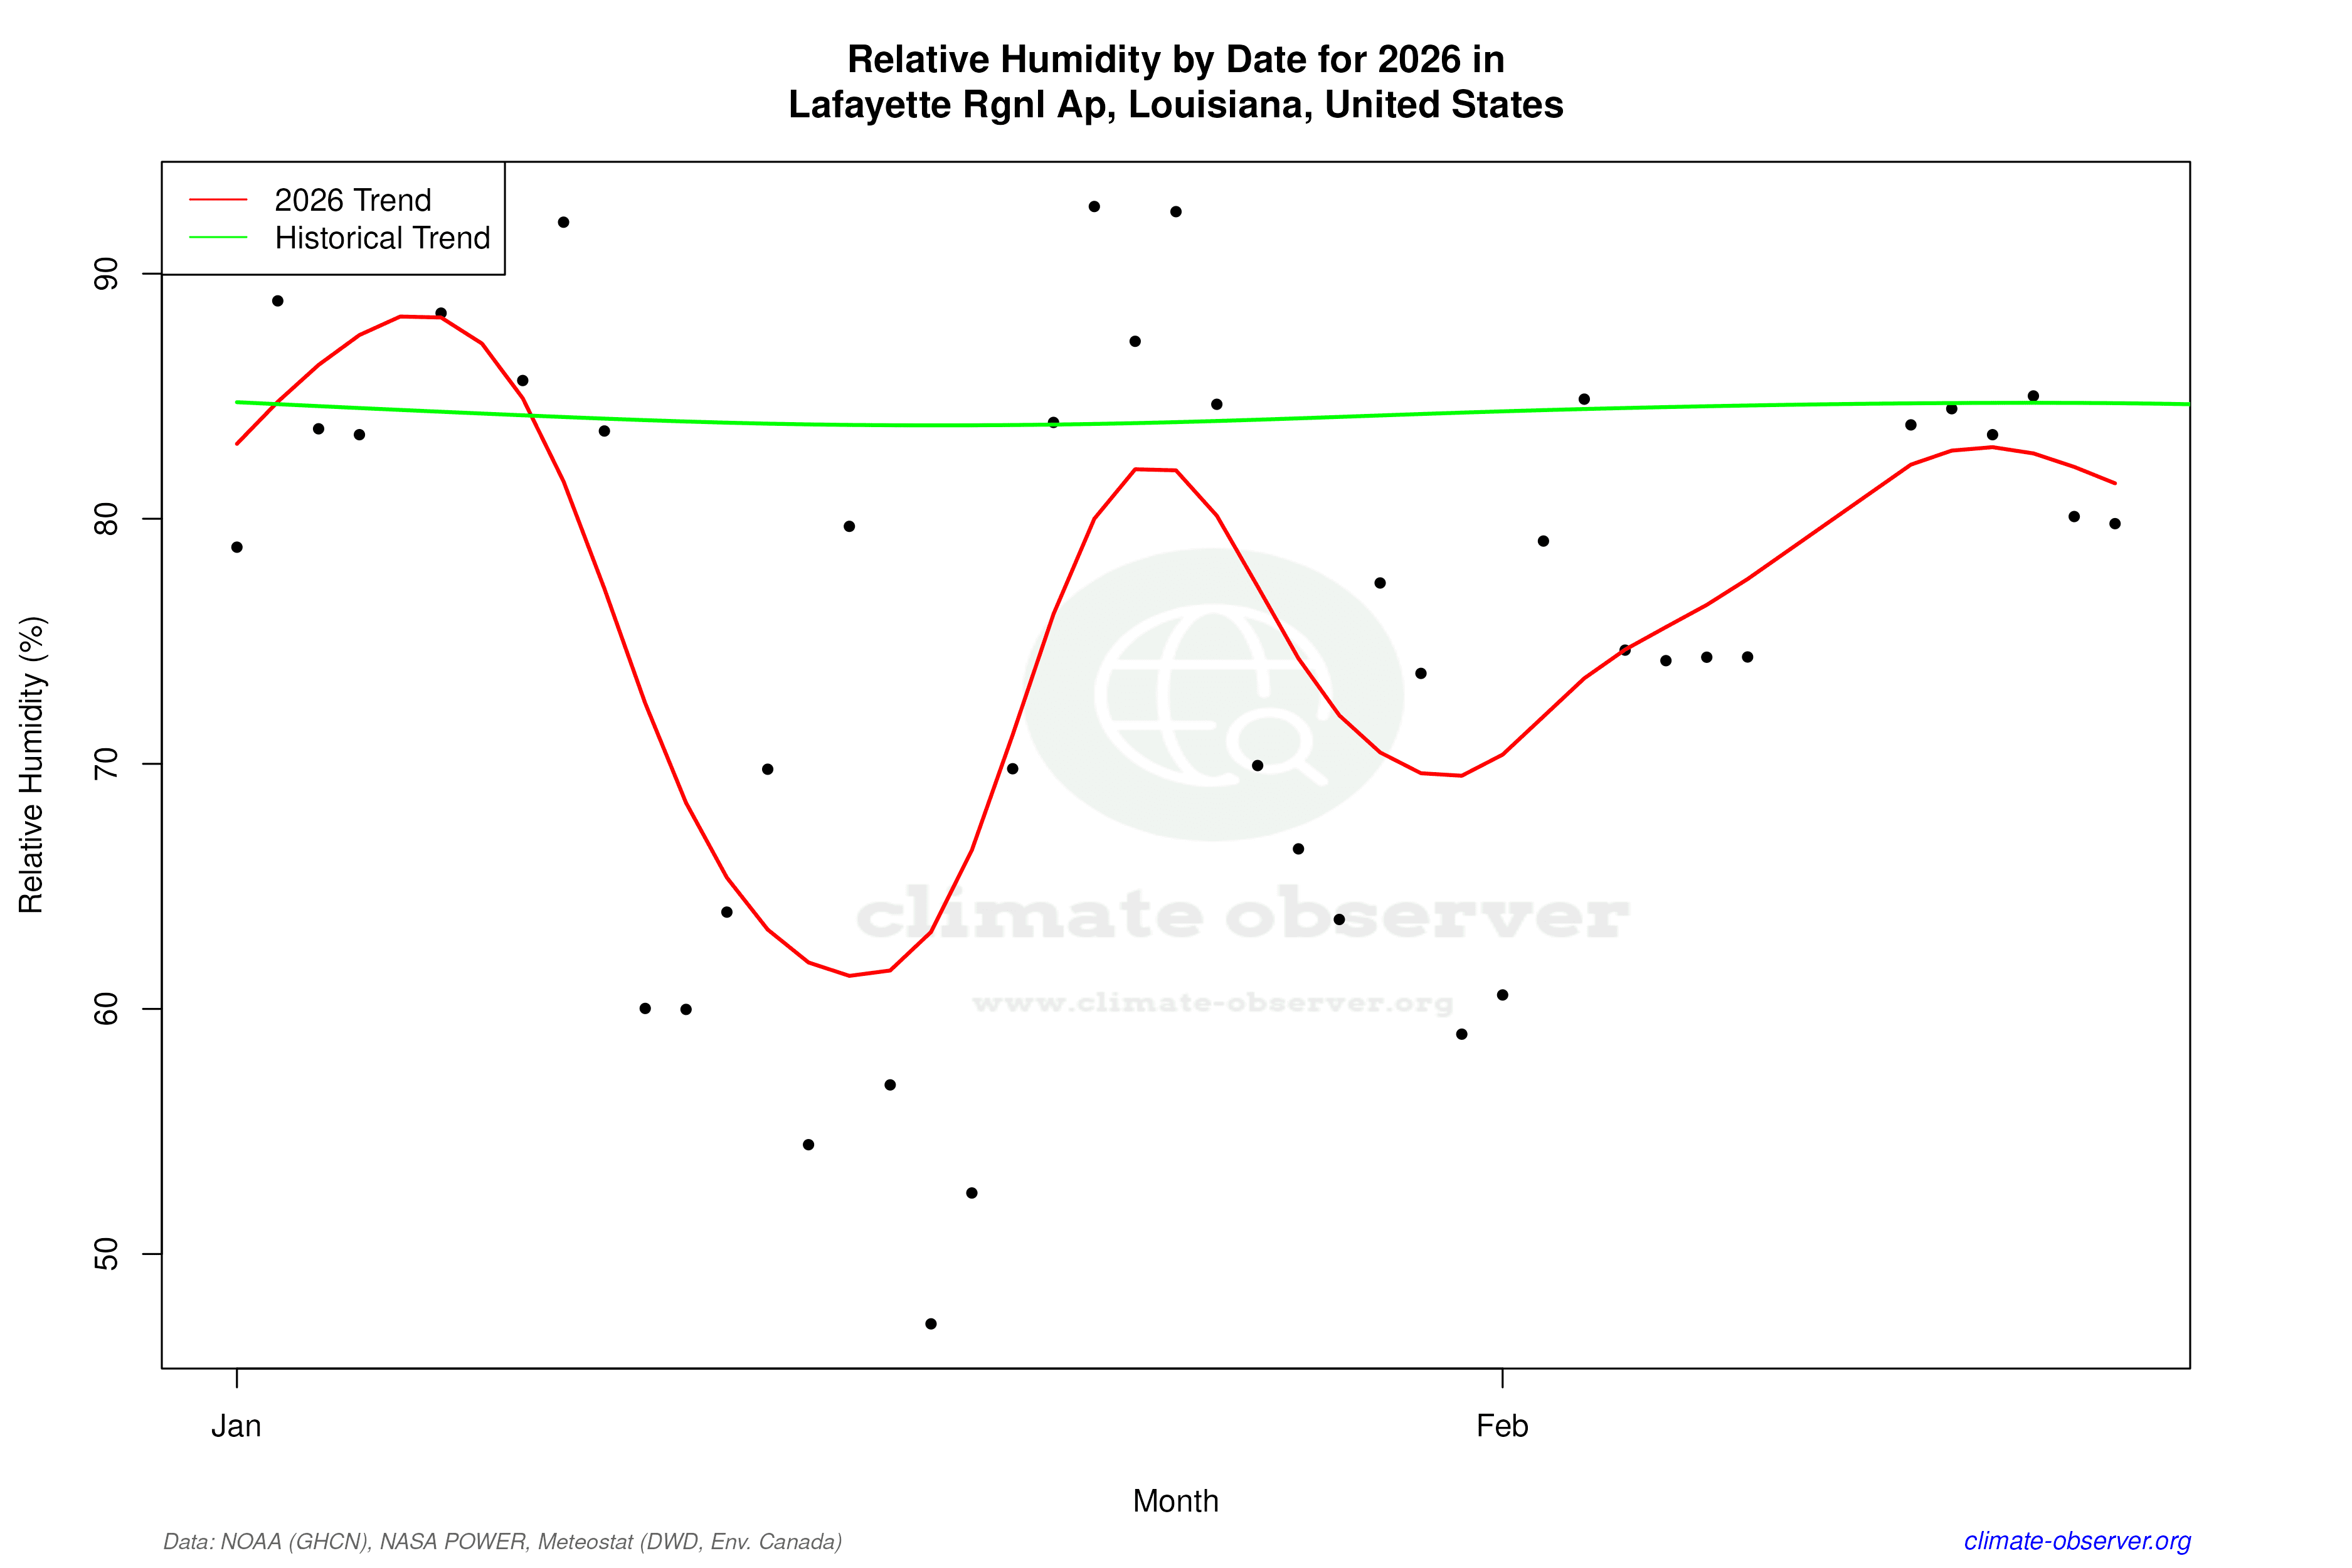

Max Temperature this Year | 1 of 6
Climate 12-Month Moving Averages


Max Temperature 12-Month MA | 1 of 6
Daily Data Points and Averages Throughout the Year


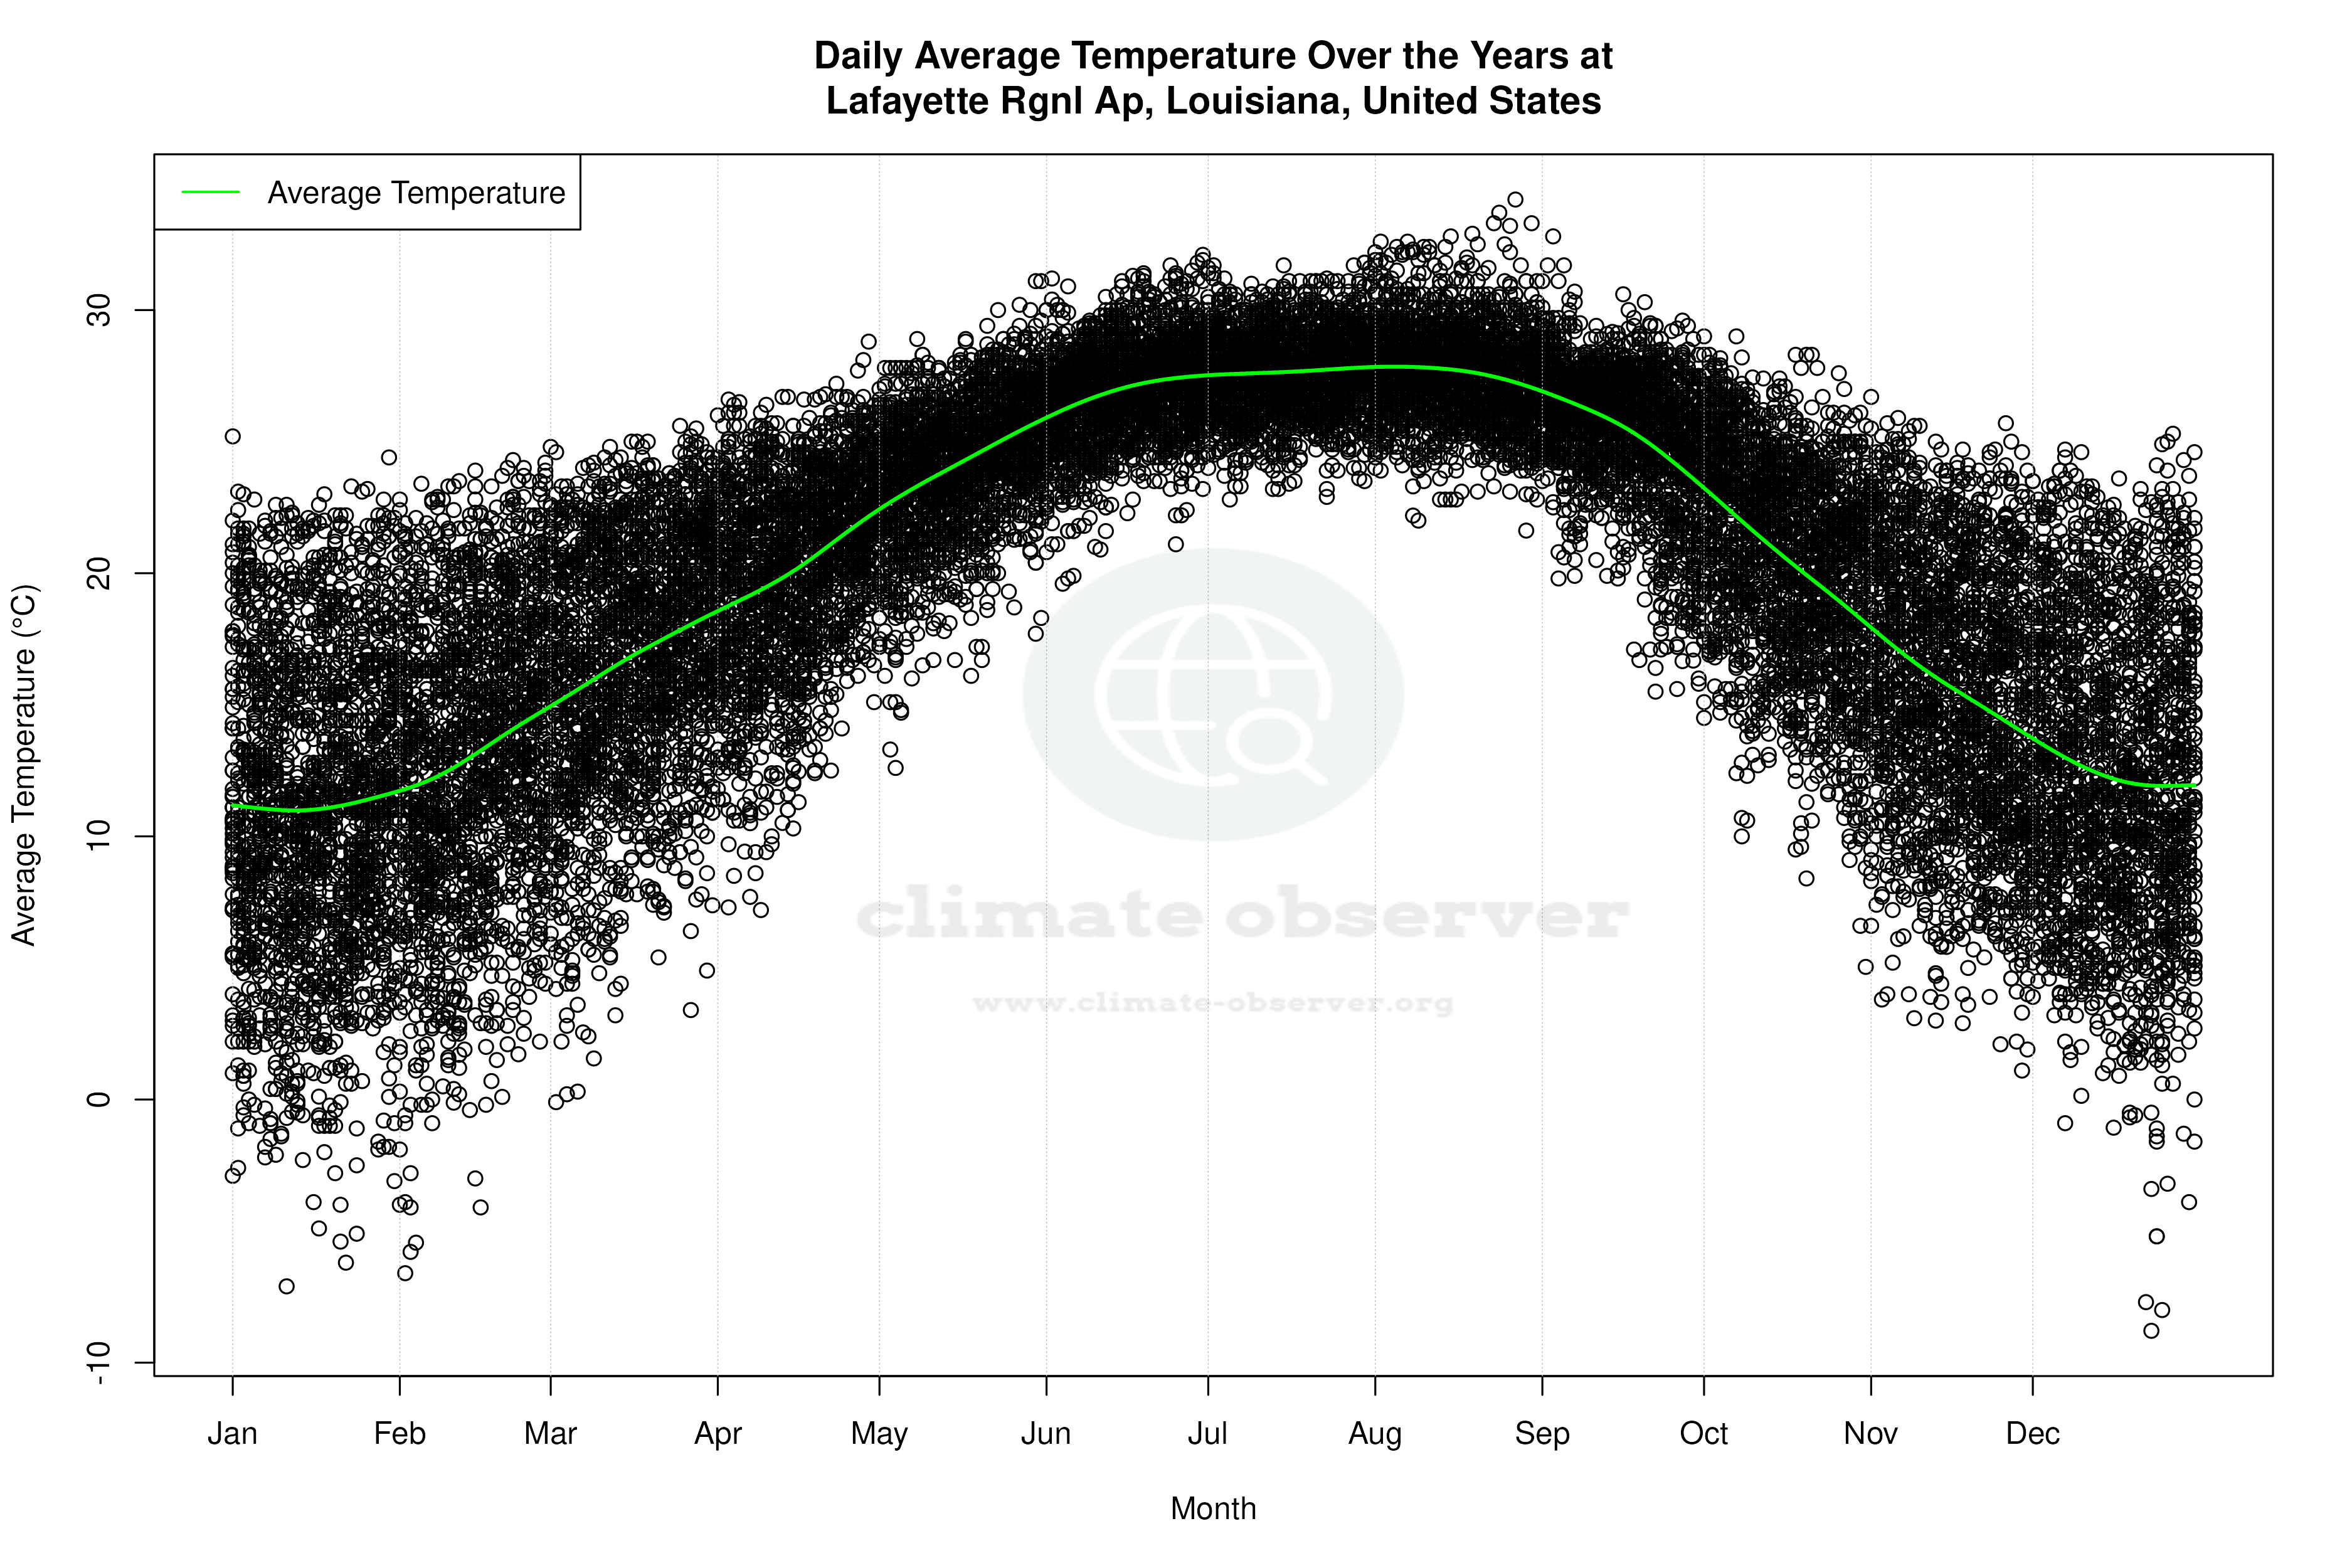


Average Max Temperature Throughout Year | 1 of 5
