Climate for Station: Lexington Bluegrass Ap, Kentucky, United States
Loading live weather...
Climate Analysis & Overview
The climate profile for Lexington Bluegrass Airport reveals a complex interplay between gradual warming trends and a more evenly distributed precipitation pattern. Despite a slight cooling in recent lows, the region's overall warming aligns with broader climate goals aimed at mitigating extreme weather impacts.
Köppen Climate and Regional Influences
Lexington Bluegrass Airport, situated at 38.0339°N, 84.6114°W, lies within the humid subtropical climate zone (Cfa) according to the Köppen classification. This classification is characterised by hot, humid summers and mild to cool winters. The region's geography, with its rolling hills and proximity to the Kentucky River, influences local weather patterns, contributing to its moderate climate and affecting the distribution of precipitation.
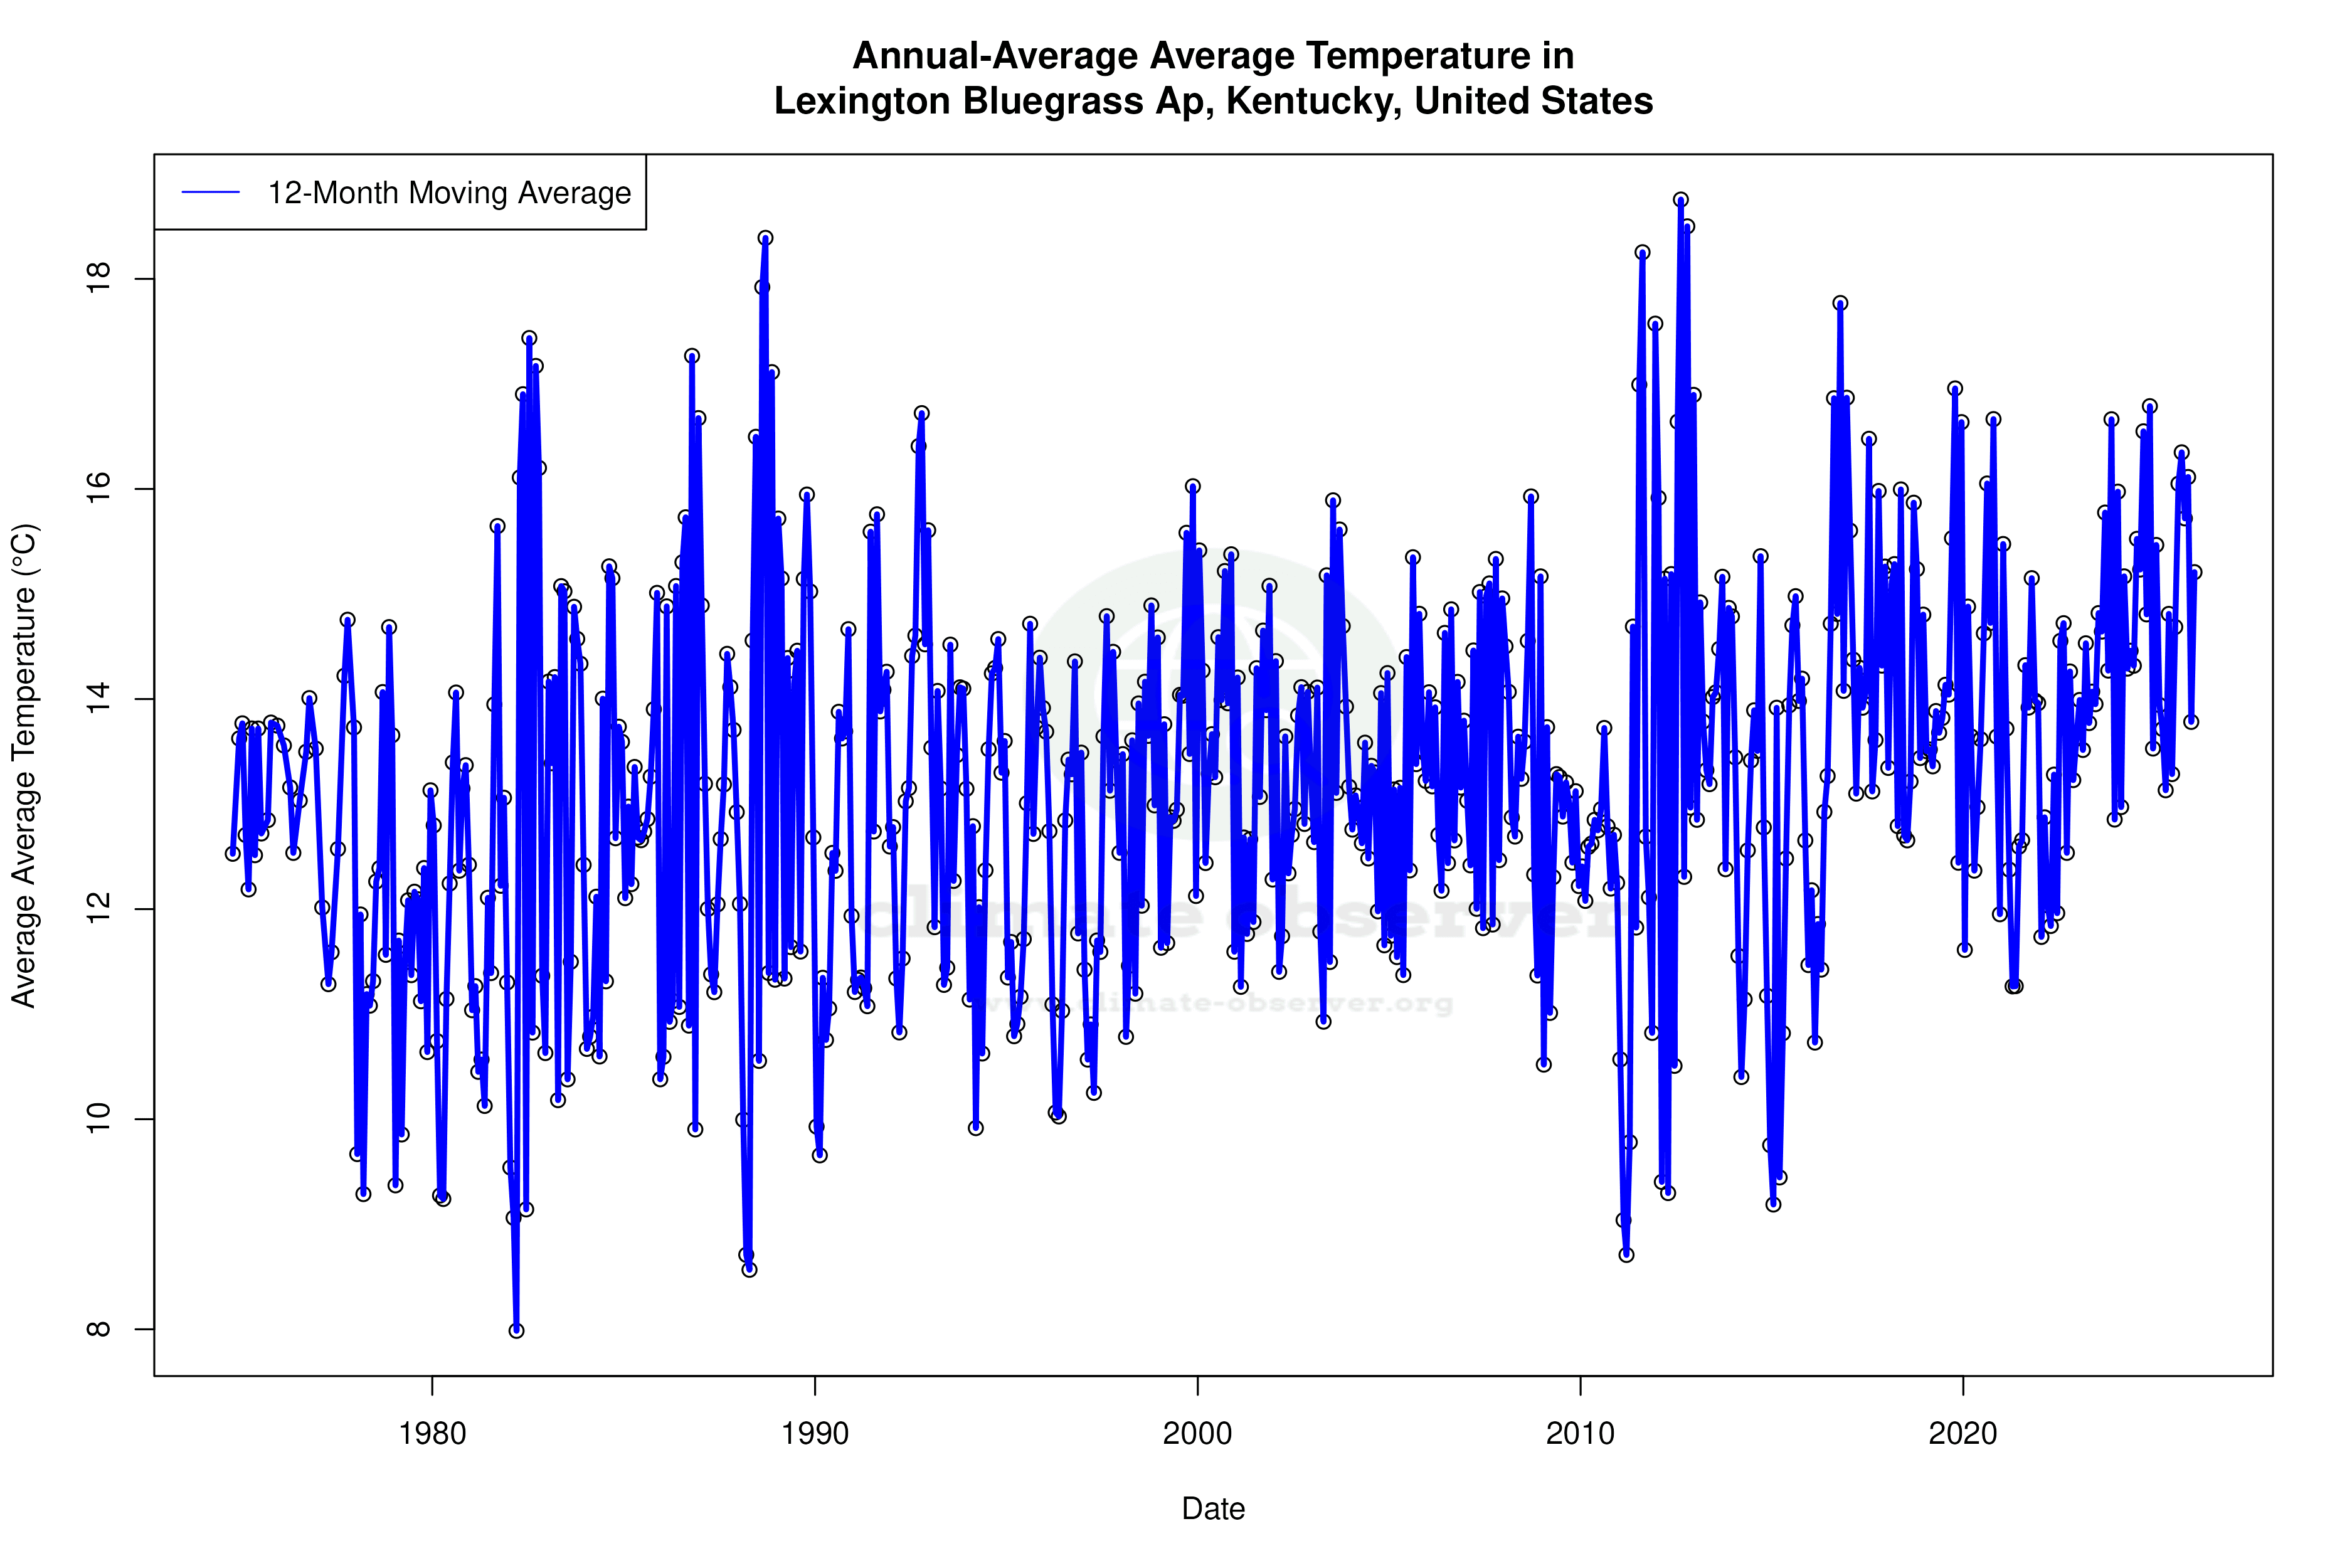
Temperature Trends: A Tale of Two Scales
The all-time temperature trends at Lexington Bluegrass Airport indicate a modest warming. High temperatures have increased by 0.10°C (0.18°F) over the years, while low temperatures show a slight rise of 0.01°C (0.02°F). In contrast, the last decade presents a more dynamic picture: high temperatures have risen by 0.31°C (0.56°F), whereas low temperatures have decreased by 0.25°C (0.46°F). This divergence suggests a potential shift in seasonal temperature patterns, possibly influenced by regional or global climate changes.
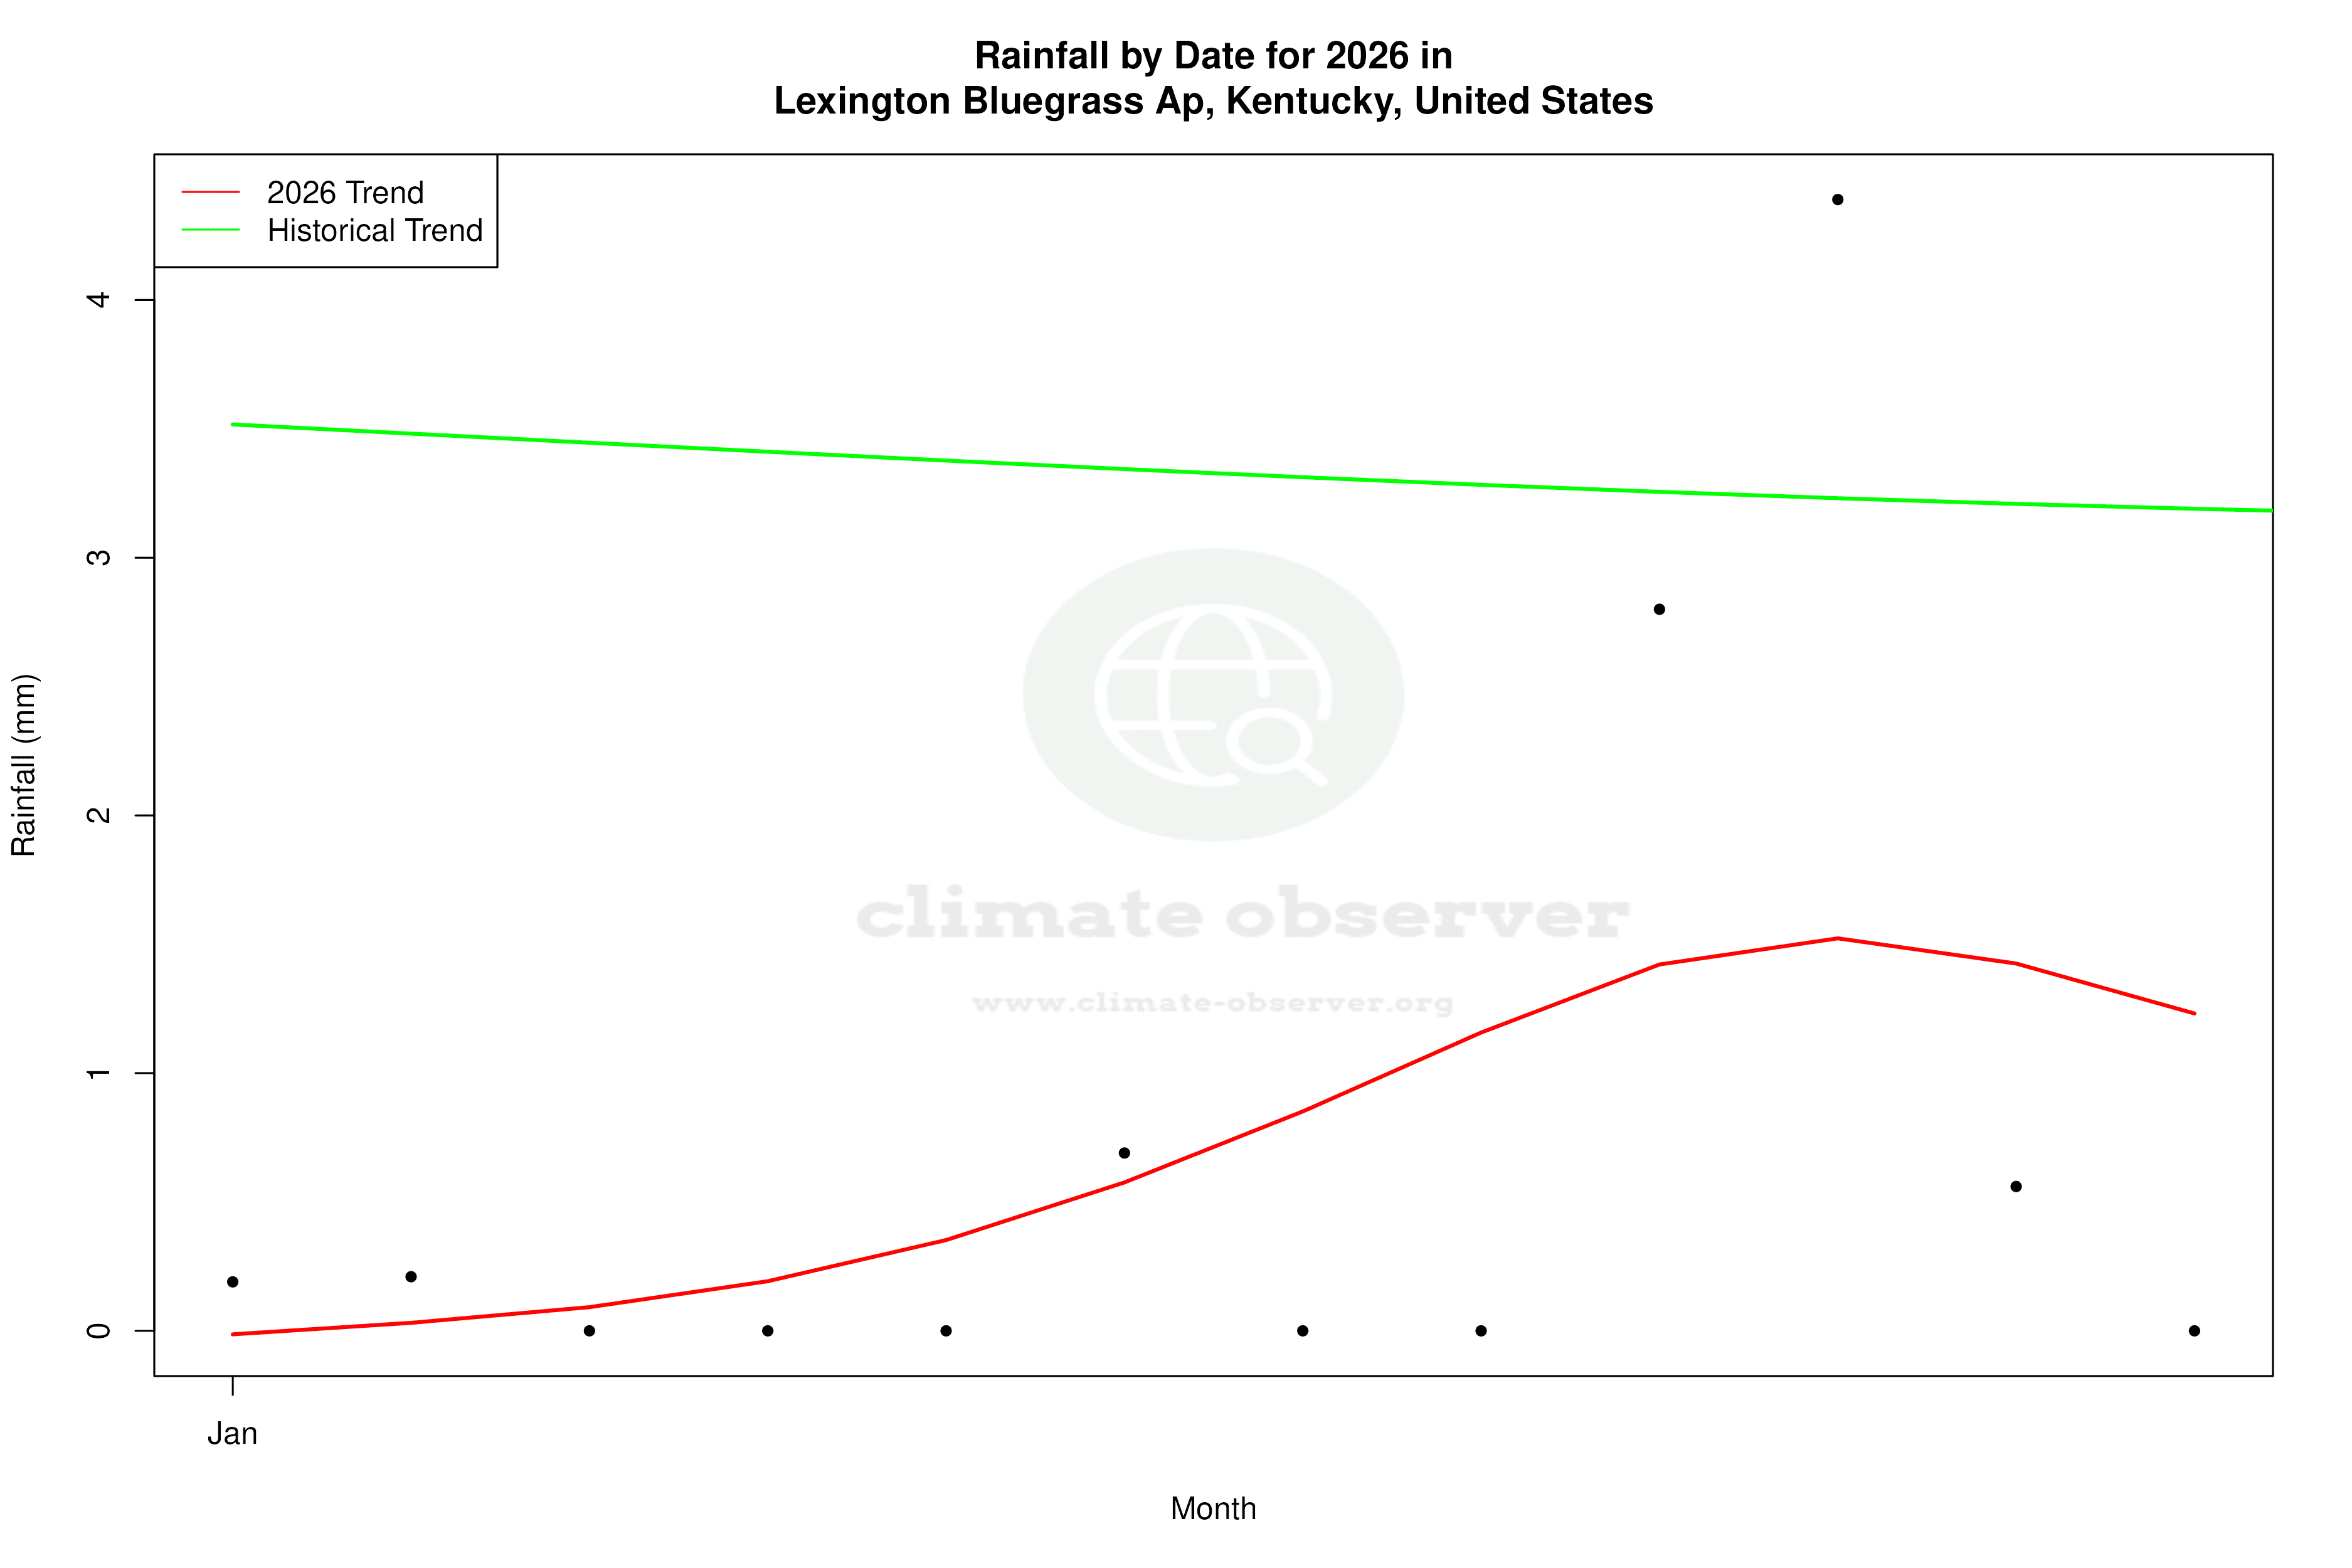
Precipitation Patterns: A Smoother Distribution
The Precipitation Concentration Index (PCI) has seen a marginal decrease from a baseline of 11.3 to a current value of 10.9. This indicates that precipitation in the region is becoming more evenly distributed throughout the year. A PCI under 10 is considered very even, so the current value suggests a trend towards less concentrated rainfall events, which could mitigate flood risks and benefit agricultural practices.
Temperature Extremes: Record Highs and Lows
Lexington Bluegrass Airport has recorded extreme temperatures, with the highest being 42.2°C (108.0°F) and the lowest at -29.4°C (-20.9°F). These records highlight the potential for significant temperature fluctuations in the region, which are crucial for planning and preparedness in both urban and rural settings.
Climate Goals and Regional Implications
The observed trends in Lexington align with broader United States climate goals aimed at reducing the impacts of extreme weather events. The slight warming trend and more evenly distributed precipitation could support efforts to enhance resilience against climate variability. Recent regional weather events, such as increased frequency of heatwaves, underscore the importance of understanding these localised trends for future planning and adaptation strategies.
Station Statistics
10-Year Trend
High: +0.29 °C/decade
Low: -0.34 °C/decade
Rain: -0.36 mm/decade
25-Year Trend
High: +0.77 °C/decade
Low: +0.43 °C/decade
Rain: +0.15 mm/decade
50-Year Trend
High: +0.42 °C/decade
Low: +0.32 °C/decade
Rain: +0.17 mm/decade
All-Time Trend
High: +0.10 °C/decade
Low: +0.01 °C/decade
Rain: +0.04 mm/decade
Percentage Above-Average Days
Last 12 Months: 59.5%
This Year: 61.0%
Precipitation Concentration Index (PCI) ℹ️
Last 12 Months: 10.1
Historical Average: 10.5
Percentile Rank of Last 12 Months ℹ️
High: 90th percentile
Low: 83rd percentile
Rain: 85th percentile
Change in Variance ℹ️
High: -9.7%
Low: -6.6%
Intraday: +7.3%
Data Coverage
78.0%
First Year of Data
1872
Station Location
Historical Weather Records
| Max High | Avg High | Min High | Max Avg | Avg Avg | Min Avg | Max Low | Avg Low | Min Low | Max Precipitation | Avg Precipitation | Max Snow | Avg Snow | |
|---|---|---|---|---|---|---|---|---|---|---|---|---|---|
| Record | 42.2 °C | — | -19.4 °C | 32.0 °C | — | -24.6 °C | 28.3 °C | — | -29.4 °C | 204.2 mm | — | 340.0 mm | — |
| January | 26.7 °C | 5.1 °C | -19.4 °C | 18.4 °C | 0.4 °C | -24.6 °C | 15.6 °C | -3.9 °C | -29.4 °C | 88.9 mm | 3.2 mm | 340.0 mm | 4.6 mm |
| February | 26.7 °C | 7.0 °C | -19.4 °C | 20.3 °C | 2.6 °C | -18.4 °C | 16.7 °C | -2.8 °C | -28.9 °C | 78.7 mm | 3.1 mm | 279.0 mm | 4.1 mm |
| March | 30.0 °C | 12.5 °C | -10.0 °C | 22.0 °C | 7.9 °C | -12.2 °C | 18.3 °C | 1.6 °C | -18.9 °C | 111.0 mm | 3.6 mm | 254.0 mm | 2.3 mm |
| April | 32.8 °C | 18.4 °C | -0.6 °C | 25.2 °C | 13.2 °C | -2.5 °C | 21.1 °C | 6.9 °C | -9.4 °C | 88.6 mm | 3.2 mm | 122.0 mm | 0.3 mm |
| May | 35.6 °C | 23.6 °C | 5.6 °C | 27.3 °C | 18.2 °C | 5.3 °C | 23.3 °C | 12.3 °C | -3.3 °C | 101.2 mm | 3.5 mm | 152.0 mm | 0.1 mm |
| June | 40.0 °C | 28.2 °C | 12.2 °C | 30.4 °C | 22.7 °C | 13.0 °C | 26.7 °C | 17.1 °C | 3.9 °C | 108.2 mm | 3.6 mm | 0.0 mm | 0.0 mm |
| July | 42.2 °C | 30.0 °C | 20.0 °C | 32.0 °C | 24.6 °C | 16.9 °C | 28.3 °C | 19.2 °C | 8.3 °C | 111.3 mm | 3.8 mm | 0.0 mm | 0.0 mm |
| August | 40.6 °C | 29.4 °C | 15.0 °C | 31.5 °C | 23.8 °C | 14.3 °C | 27.2 °C | 18.4 °C | 5.6 °C | 204.2 mm | 2.9 mm | 0.0 mm | 0.0 mm |
| September | 39.4 °C | 26.3 °C | 8.3 °C | 29.1 °C | 20.2 °C | 8.2 °C | 25.6 °C | 14.8 °C | 0.0 °C | 138.4 mm | 2.5 mm | 0.0 mm | 0.0 mm |
| October | 36.1 °C | 19.9 °C | -1.1 °C | 28.1 °C | 13.9 °C | 0.7 °C | 21.7 °C | 8.3 °C | -6.7 °C | 77.8 mm | 2.2 mm | 58.0 mm | 0.0 mm |
| November | 28.3 °C | 12.4 °C | -10.0 °C | 21.4 °C | 7.9 °C | -9.6 °C | 19.4 °C | 2.3 °C | -19.4 °C | 84.8 mm | 2.8 mm | 191.0 mm | 0.8 mm |
| December | 23.9 °C | 6.9 °C | -17.8 °C | 19.7 °C | 2.9 °C | -23.4 °C | 16.7 °C | -1.9 °C | -28.3 °C | 92.2 mm | 3.1 mm | 241.0 mm | 2.5 mm |
Data Visualisations
Remove WatermarksCurrent Year Climate Trends vs Historical


Max Temperature this Year | 1 of 6
Climate 12-Month Moving Averages


Max Temperature 12-Month MA | 1 of 6
Daily Data Points and Averages Throughout the Year


Average Max Temperature Throughout Year | 1 of 5
