Climate for Station: Ny City Cntrl Park, New York, United States
Loading live weather...
Climate Analysis & Overview
Central Park's climate profile reveals a subtle warming trend over the long term, with a slight cooling in recent years. Precipitation has become more evenly distributed, reflecting a marginal shift in weather patterns. These trends are critical as New York City aligns with national climate goals.
Urban Climate Dynamics
Central Park, located in the heart of Manhattan at 40.7789°N, -73.9692°W, experiences a humid subtropical climate, classified as Cfa under the Köppen system. The city's proximity to the Atlantic Ocean moderates temperatures, while urban heat effects contribute to warmer conditions. Over the past decade, the park has recorded a slight cooling in high temperatures, with a 10-year trend of -0.05°C (-0.09°F). Conversely, low temperatures have risen by 0.09°C (0.15°F), suggesting a nuanced shift in daily temperature ranges.
Long-term Warming Trends
When examining all-time data, Central Park exhibits a warming trend in both high and low temperatures. Highs have increased by 0.18°C (0.32°F), and lows by 0.15°C (0.27°F). This warming aligns with broader regional trends and underscores the importance of New York City's climate initiatives aimed at reducing greenhouse gas emissions. The all-time record temperatures, a maximum of 41.1°C (106°F) and a minimum of -26.1°C (-15°F), highlight the city's capacity for extreme weather events.
Precipitation Patterns and Distribution
The Precipitation Concentration Index (PCI) provides insights into rainfall distribution. A decrease from a baseline of 11.73 to a current value of 10.56 indicates a more even distribution of precipitation events. This marginal change suggests a slight shift towards more consistent rainfall, which could mitigate the risk of flooding and droughts. Understanding these patterns is crucial for urban planning and infrastructure resilience.
Implications for Climate Goals
The observed climatic changes in Central Park are set against the backdrop of the United States' commitment to reducing carbon emissions and enhancing urban sustainability. As New York City continues to adapt, these trends offer valuable insights into the effectiveness of local and national climate policies. The interplay between natural geography and urban development will remain a focal point for future climate strategies.
Temperature Extremes and Variability
Central Park's climatic data also reflect significant temperature variability. The record high of 41.1°C (106°F) and the record low of -26.1°C (-15°F) underscore the city's susceptibility to temperature extremes. These records, coupled with the subtle shifts in temperature trends, highlight the need for adaptive measures in infrastructure and public health to address potential challenges posed by climate change.
Station Statistics
10-Year Trend
High: +0.02 °C/decade
Low: +0.02 °C/decade
Rain: -0.07 mm/decade
25-Year Trend
High: +0.39 °C/decade
Low: +0.49 °C/decade
Rain: -0.11 mm/decade
50-Year Trend
High: +0.16 °C/decade
Low: +0.32 °C/decade
Rain: +0.08 mm/decade
All-Time Trend
High: +0.18 °C/decade
Low: +0.15 °C/decade
Rain: +0.01 mm/decade
Percentage Above-Average Days
Last 12 Months: 52.6%
This Year: 51.3%
Precipitation Concentration Index (PCI) ℹ️
Last 12 Months: 9.0
Historical Average: 10.5
Percentile Rank of Last 12 Months ℹ️
High: 73rd percentile
Low: 86th percentile
Rain: 17th percentile
Change in Variance ℹ️
High: -10.3%
Low: -8.2%
Intraday: -16.8%
Data Coverage
83.5%
First Year of Data
1843
Station Location
Historical Weather Records
| Max High | Avg High | Min High | Max Avg | Avg Avg | Min Avg | Max Low | Avg Low | Min Low | Max Precipitation | Avg Precipitation | Max Snow | Avg Snow | |
|---|---|---|---|---|---|---|---|---|---|---|---|---|---|
| Record | 41.1 °C | — | -16.7 °C | 34.2 °C | — | -16.2 °C | 28.9 °C | — | -26.1 °C | 210.3 mm | — | 693.0 mm | — |
| January | 22.2 °C | 3.5 °C | -14.4 °C | 17.9 °C | 0.7 °C | -16.2 °C | 15.0 °C | -3.4 °C | -21.1 °C | 87.6 mm | 2.8 mm | 693.0 mm | 6.2 mm |
| February | 25.6 °C | 4.3 °C | -15.6 °C | 16.6 °C | 1.8 °C | -13.6 °C | 14.4 °C | -3.2 °C | -26.1 °C | 78.0 mm | 2.9 mm | 612.0 mm | 7.4 mm |
| March | 30.0 °C | 8.9 °C | -12.2 °C | 21.6 °C | 5.8 °C | -11.4 °C | 18.9 °C | 0.7 °C | -17.6 °C | 108.0 mm | 3.2 mm | 419.0 mm | 3.7 mm |
| April | 35.6 °C | 15.3 °C | -1.1 °C | 29.4 °C | 11.4 °C | -3.5 °C | 24.4 °C | 6.2 °C | -11.1 °C | 99.1 mm | 3.1 mm | 254.0 mm | 0.7 mm |
| May | 37.2 °C | 21.5 °C | 6.1 °C | 31.2 °C | 16.9 °C | 4.5 °C | 24.4 °C | 11.9 °C | 0.0 °C | 97.0 mm | 2.9 mm | 0.0 mm | 0.0 mm |
| June | 38.3 °C | 26.4 °C | 11.1 °C | 32.1 °C | 22.0 °C | 11.1 °C | 27.2 °C | 17.1 °C | 6.7 °C | 109.0 mm | 3.0 mm | 3.0 mm | 0.0 mm |
| July | 41.1 °C | 29.1 °C | 16.1 °C | 34.2 °C | 25.1 °C | 15.8 °C | 28.9 °C | 20.2 °C | 11.1 °C | 89.7 mm | 3.5 mm | 0.0 mm | 0.0 mm |
| August | 40.0 °C | 28.0 °C | 15.0 °C | 33.3 °C | 24.4 °C | 14.0 °C | 28.9 °C | 19.5 °C | 10.0 °C | 121.9 mm | 3.5 mm | 0.0 mm | 0.0 mm |
| September | 38.9 °C | 24.3 °C | 10.6 °C | 31.2 °C | 20.5 °C | 10.1 °C | 26.1 °C | 15.8 °C | 3.9 °C | 210.3 mm | 3.1 mm | 0.0 mm | 0.0 mm |
| October | 34.4 °C | 18.1 °C | 3.3 °C | 26.9 °C | 14.5 °C | 2.8 °C | 23.9 °C | 9.9 °C | -2.2 °C | 186.2 mm | 3.0 mm | 74.0 mm | 0.0 mm |
| November | 28.9 °C | 11.4 °C | -10.0 °C | 22.3 °C | 9.0 °C | -5.1 °C | 19.4 °C | 4.4 °C | -15.0 °C | 188.0 mm | 2.9 mm | 163.0 mm | 0.6 mm |
| December | 23.9 °C | 5.6 °C | -16.7 °C | 19.4 °C | 3.6 °C | -14.3 °C | 17.2 °C | -1.0 °C | -25.0 °C | 92.7 mm | 3.0 mm | 663.0 mm | 4.3 mm |
Data Visualisations
Remove WatermarksCurrent Year Climate Trends vs Historical


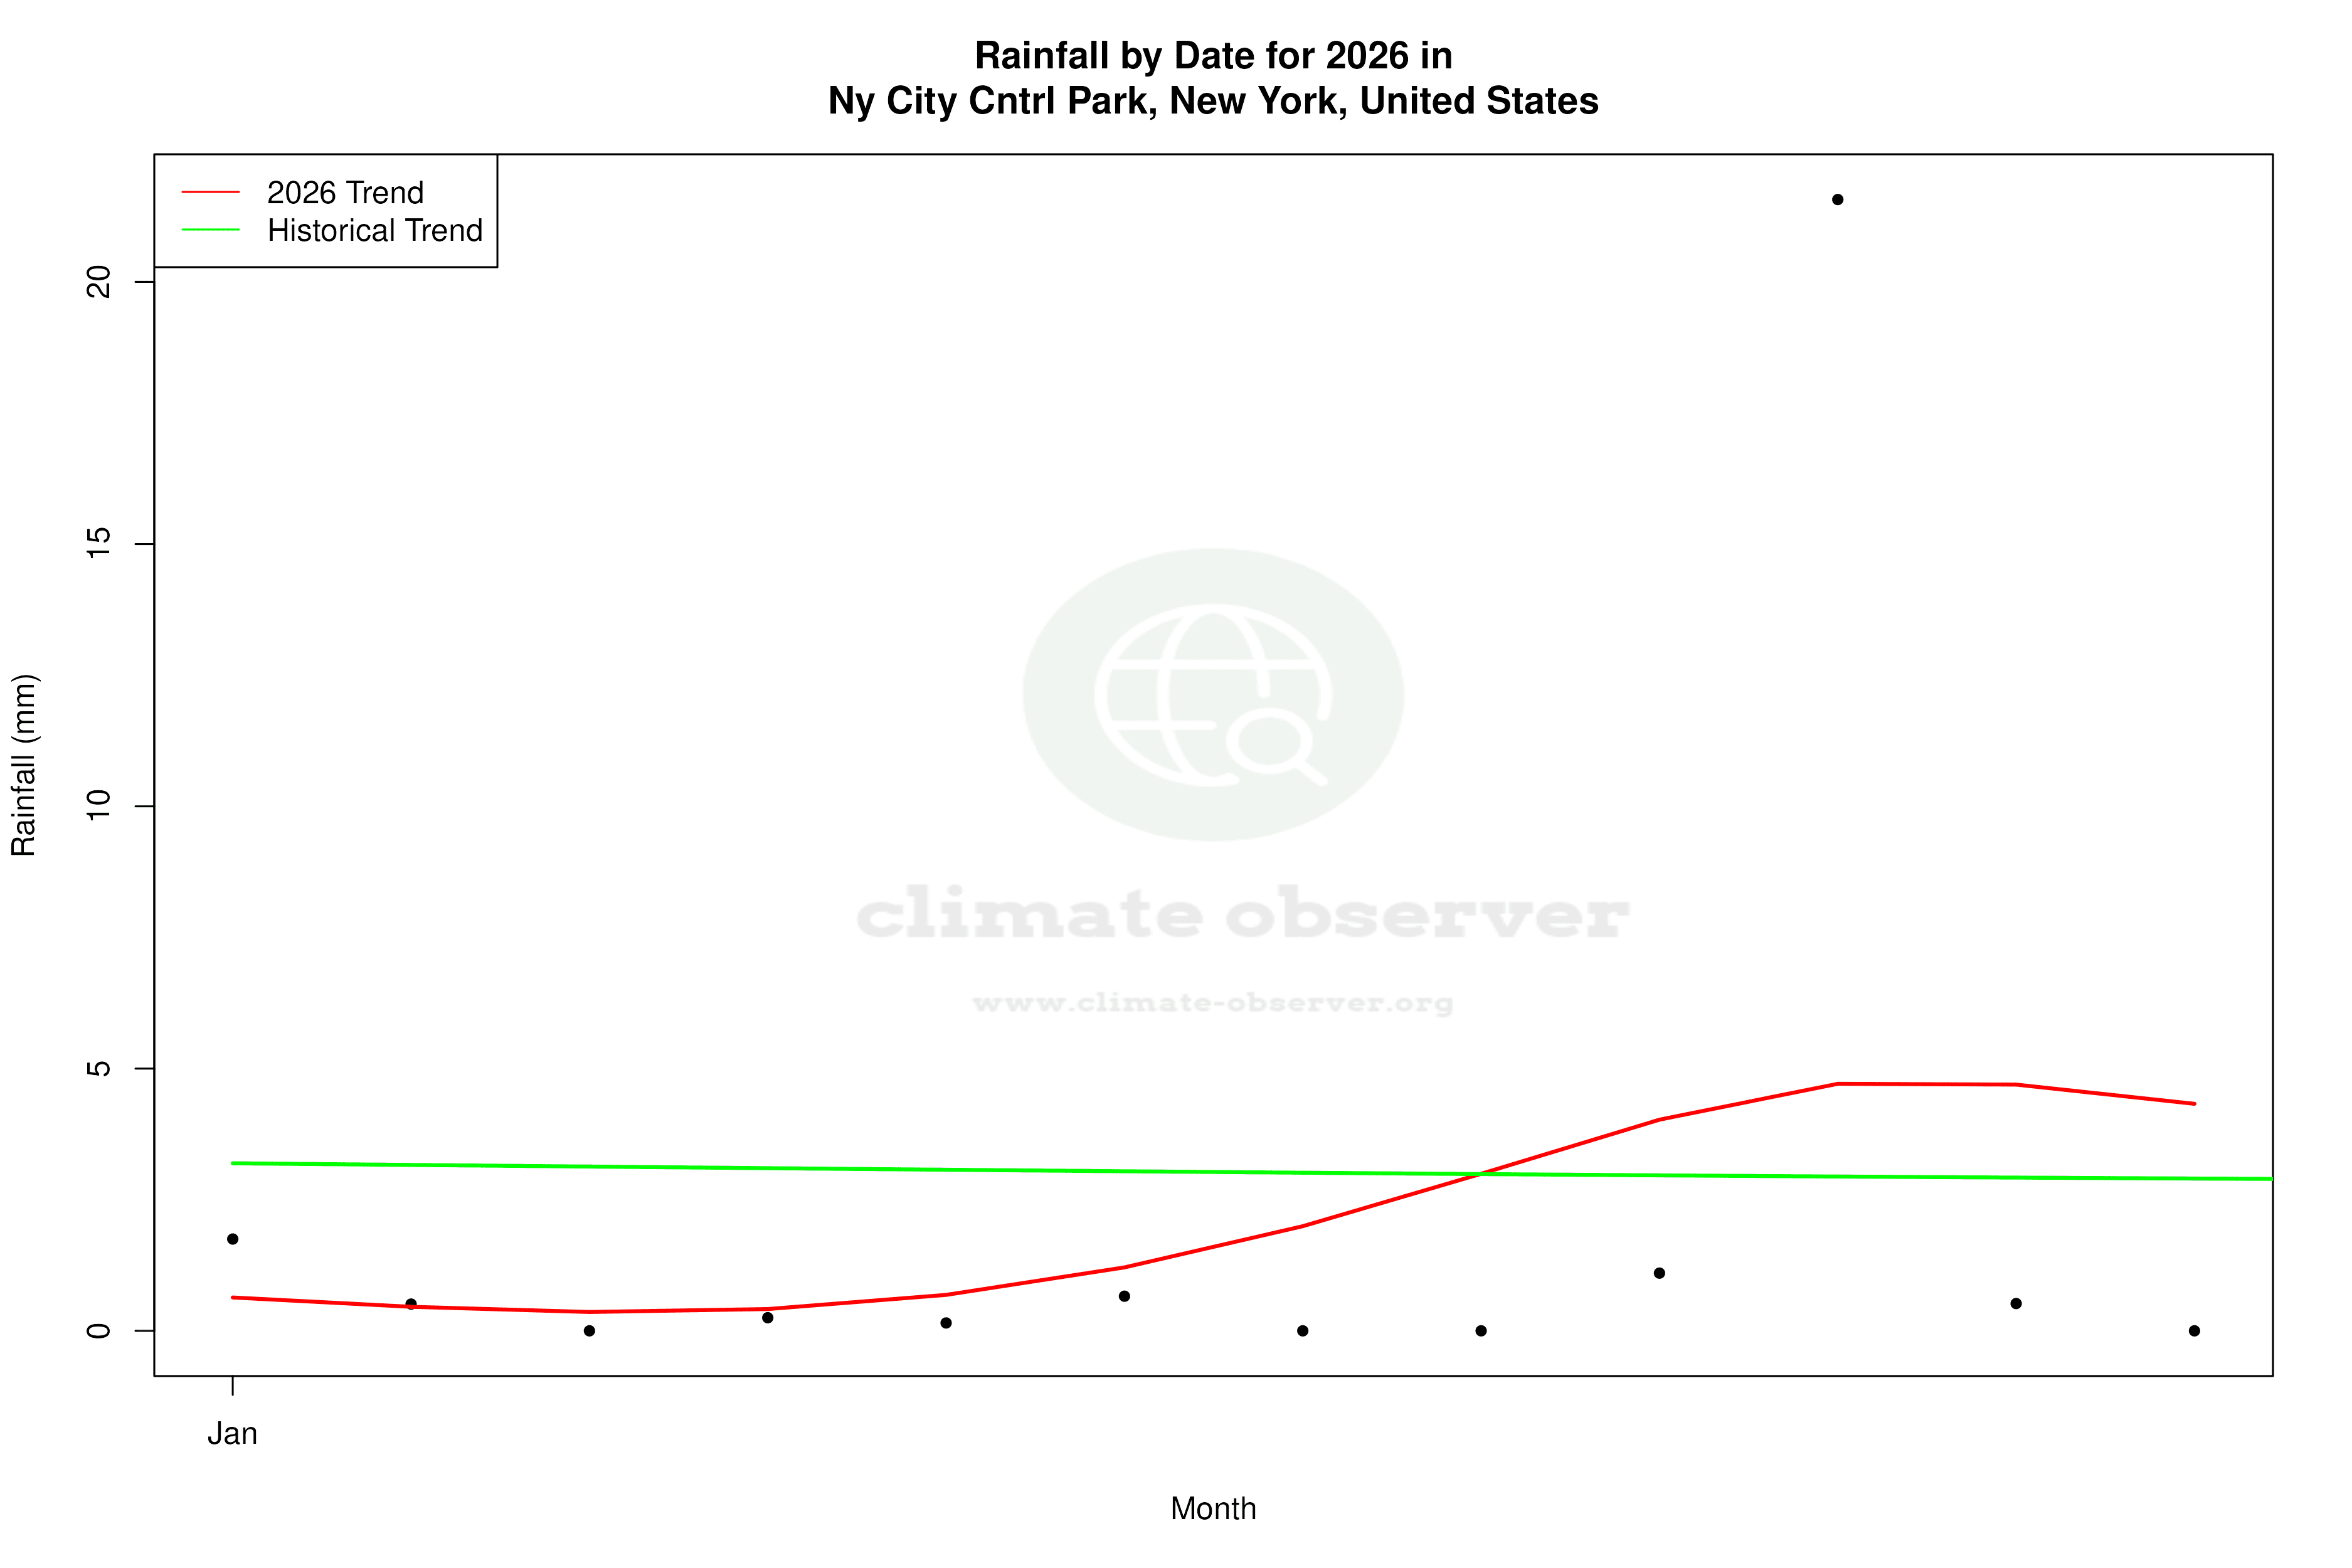


Max Temperature this Year | 1 of 6
Climate 12-Month Moving Averages


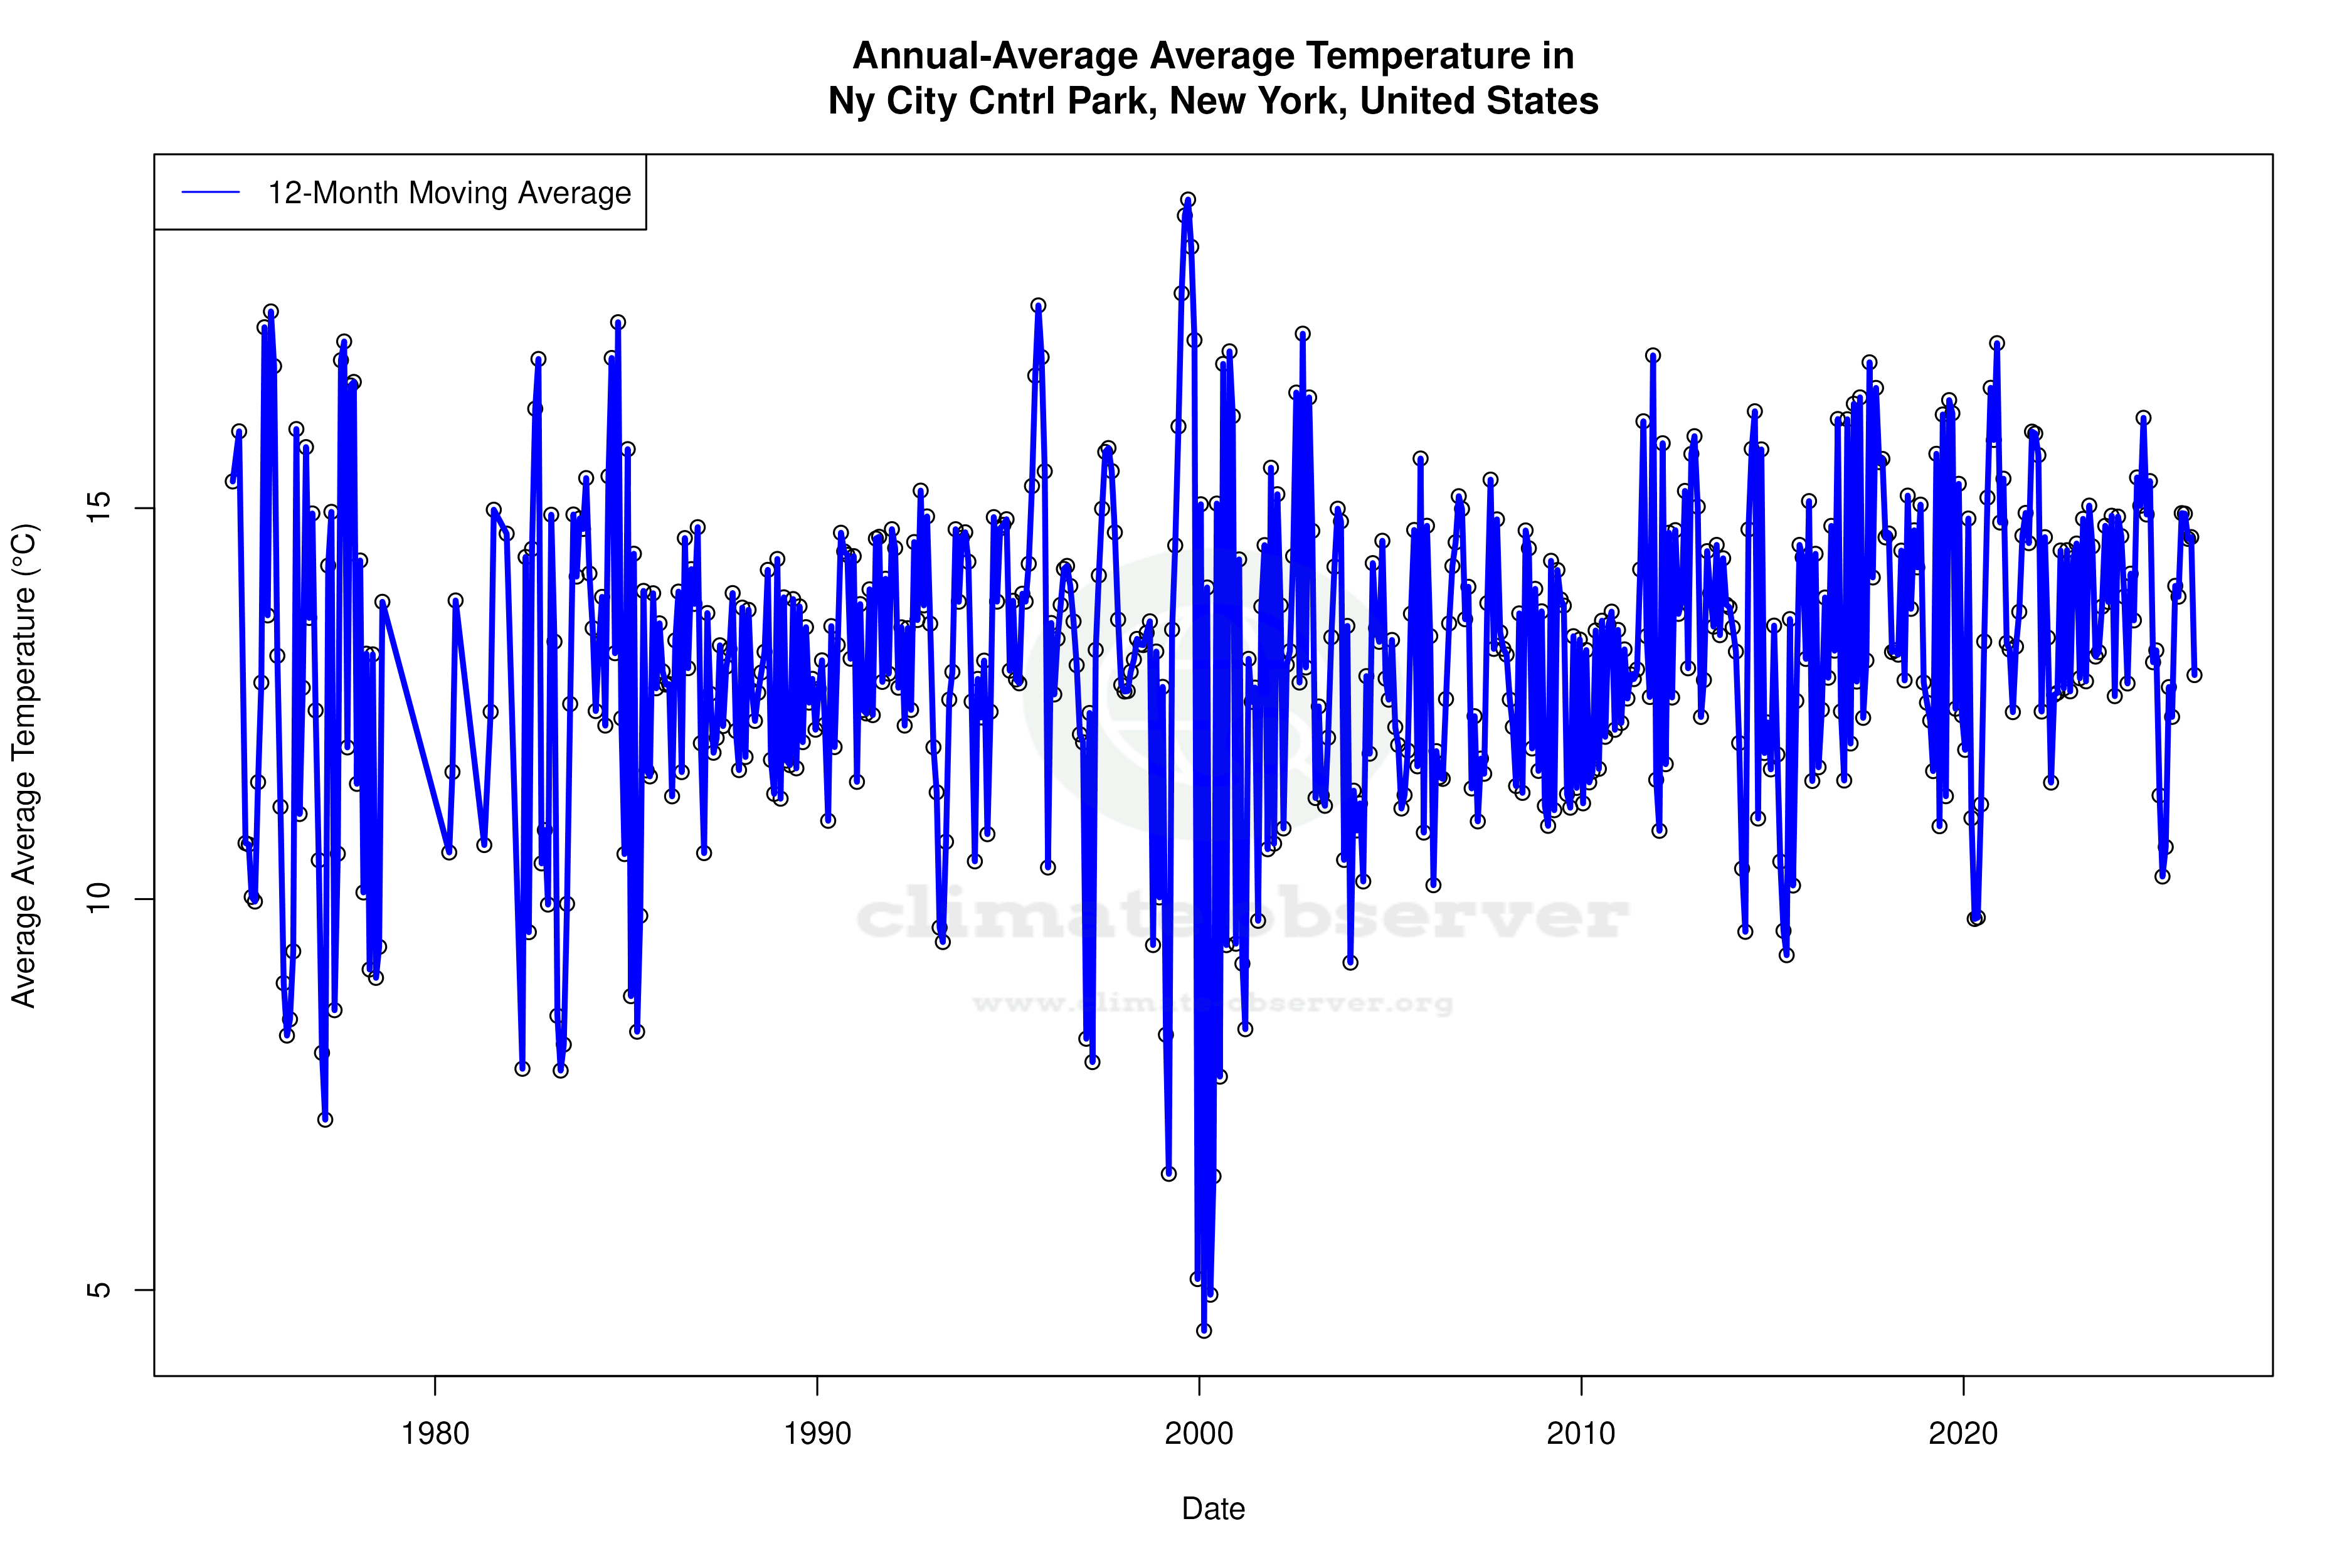


Max Temperature 12-Month MA | 1 of 6
Daily Data Points and Averages Throughout the Year


Average Max Temperature Throughout Year | 1 of 5
