Climate for Station: Jfk Intl Ap, New York, United States
Loading live weather...
Climate Analysis & Overview
JFK International Airport's climate profile reveals a warming trend in high temperatures, with a 0.15°C (0.27°F) increase over the all-time record, while lows have similarly risen by 0.14°C (0.25°F). The past decade, however, shows a slight cooling in low temperatures. Precipitation is becoming more evenly distributed, reflecting broader regional climate goals for stability.
Coastal Climate Dynamics
JFK International Airport, located in Queens, New York, falls under the humid subtropical climate classification (Cfa) according to the Köppen system. This classification is characterised by hot, humid summers and mild winters, heavily influenced by its proximity to the Atlantic Ocean. The ocean acts as a thermal buffer, moderating temperature extremes, yet the airport's data show a warming trend in high temperatures. Over the all-time record, highs have increased by 0.15°C (0.27°F), while lows have risen by 0.14°C (0.25°F). This warming aligns with broader regional climate patterns observed across the northeastern United States.
Decadal Temperature Fluctuations
Examining the past decade reveals a nuanced picture. High temperatures at JFK have risen by 0.21°C (0.38°F), indicating a continuation of the warming trend. However, low temperatures have experienced a slight cooling of 0.08°C (0.14°F). This divergence could suggest increased variability in nighttime temperatures, potentially influenced by urban heat island effects or changes in atmospheric circulation patterns. Such trends are critical for understanding local climate dynamics and preparing for future climate scenarios.
Record Extremes and Variability
JFK International Airport has recorded an absolute maximum temperature of 40.0°C (104.0°F) and a minimum of -21.7°C (-7.1°F). These extremes highlight the variability inherent in the region's climate, where both heatwaves and cold snaps are possible. The airport's location, adjacent to both urban and coastal environments, plays a significant role in these temperature records, offering a unique blend of influences that shape its climate profile.
Precipitation Patterns and Distribution
The Precipitation Concentration Index (PCI) at JFK has decreased from a baseline of 11.82 to 10.66, indicating a more even distribution of rainfall events. This shift suggests a trend towards less concentrated precipitation, with rainfall spread more evenly throughout the year. Such a change can reduce the risk of flooding and drought, aligning with regional climate goals aimed at enhancing resilience to extreme weather events. The PCI, a measure of how rainfall is distributed over time, provides valuable insights into the evolving nature of precipitation patterns at this key transportation hub.
Station Statistics
10-Year Trend
High: +0.23 °C/decade
Low: -0.12 °C/decade
Rain: -0.58 mm/decade
25-Year Trend
High: +0.49 °C/decade
Low: +0.45 °C/decade
Rain: -0.05 mm/decade
50-Year Trend
High: +0.33 °C/decade
Low: +0.24 °C/decade
Rain: +0.01 mm/decade
All-Time Trend
High: +0.15 °C/decade
Low: +0.14 °C/decade
Rain: +0.00 mm/decade
Percentage Above-Average Days
Last 12 Months: 52.3%
This Year: 46.0%
Precipitation Concentration Index (PCI) ℹ️
Last 12 Months: 8.0
Historical Average: 10.5
Percentile Rank of Last 12 Months ℹ️
High: 84th percentile
Low: 80th percentile
Rain: 10th percentile
Change in Variance ℹ️
High: -5.3%
Low: -2.4%
Intraday: -4.2%
Data Coverage
90.5%
First Year of Data
1843
Station Location
Historical Weather Records
| Max High | Avg High | Min High | Max Avg | Avg Avg | Min Avg | Max Low | Avg Low | Min Low | Max Precipitation | Avg Precipitation | Max Snow | Avg Snow | |
|---|---|---|---|---|---|---|---|---|---|---|---|---|---|
| Record | 40.0 °C | — | -13.3 °C | 32.8 °C | — | -15.6 °C | 27.8 °C | — | -21.7 °C | 148.1 mm | — | 770.0 mm | — |
| January | 21.7 °C | 3.7 °C | -13.3 °C | 15.3 °C | 0.6 °C | -15.6 °C | 10.6 °C | -3.3 °C | -18.9 °C | 73.7 mm | 2.6 mm | 770.0 mm | 6.0 mm |
| February | 21.7 °C | 4.9 °C | -12.2 °C | 13.7 °C | 1.5 °C | -13.1 °C | 8.9 °C | -2.6 °C | -21.7 °C | 73.4 mm | 2.6 mm | 549.0 mm | 7.5 mm |
| March | 30.0 °C | 9.1 °C | -8.3 °C | 19.1 °C | 5.4 °C | -11.4 °C | 15.0 °C | 1.1 °C | -17.6 °C | 79.5 mm | 3.2 mm | 229.0 mm | 3.0 mm |
| April | 32.2 °C | 14.9 °C | -1.1 °C | 23.9 °C | 10.6 °C | -3.9 °C | 17.8 °C | 6.2 °C | -6.7 °C | 89.0 mm | 3.1 mm | 203.0 mm | 0.4 mm |
| May | 37.2 °C | 20.3 °C | 6.1 °C | 27.9 °C | 15.8 °C | 4.6 °C | 22.2 °C | 11.5 °C | 1.1 °C | 73.2 mm | 3.1 mm | 0.0 mm | 0.0 mm |
| June | 38.9 °C | 25.6 °C | 11.7 °C | 32.2 °C | 21.1 °C | 11.8 °C | 27.2 °C | 16.9 °C | 7.2 °C | 87.6 mm | 2.8 mm | 0.0 mm | 0.0 mm |
| July | 40.0 °C | 28.6 °C | 16.7 °C | 32.8 °C | 24.4 °C | 16.5 °C | 27.8 °C | 20.4 °C | 12.8 °C | 89.2 mm | 3.2 mm | 0.0 mm | 0.0 mm |
| August | 38.3 °C | 27.8 °C | 15.6 °C | 32.2 °C | 23.9 °C | 14.4 °C | 27.8 °C | 19.8 °C | 7.8 °C | 95.9 mm | 3.2 mm | 0.0 mm | 0.0 mm |
| September | 36.7 °C | 24.2 °C | 11.7 °C | 29.9 °C | 20.2 °C | 10.7 °C | 25.0 °C | 16.0 °C | 4.4 °C | 148.1 mm | 2.9 mm | 0.0 mm | 0.0 mm |
| October | 35.0 °C | 18.4 °C | 5.0 °C | 25.2 °C | 14.3 °C | 2.4 °C | 21.1 °C | 10.1 °C | -1.1 °C | 83.8 mm | 2.7 mm | 38.0 mm | 0.0 mm |
| November | 27.8 °C | 12.2 °C | -3.3 °C | 20.8 °C | 8.7 °C | -5.5 °C | 18.9 °C | 4.7 °C | -9.3 °C | 99.6 mm | 2.9 mm | 122.0 mm | 0.3 mm |
| December | 23.9 °C | 6.3 °C | -11.7 °C | 16.7 °C | 3.5 °C | -13.9 °C | 13.9 °C | -0.5 °C | -18.9 °C | 77.2 mm | 3.0 mm | 457.0 mm | 3.4 mm |
Data Visualisations
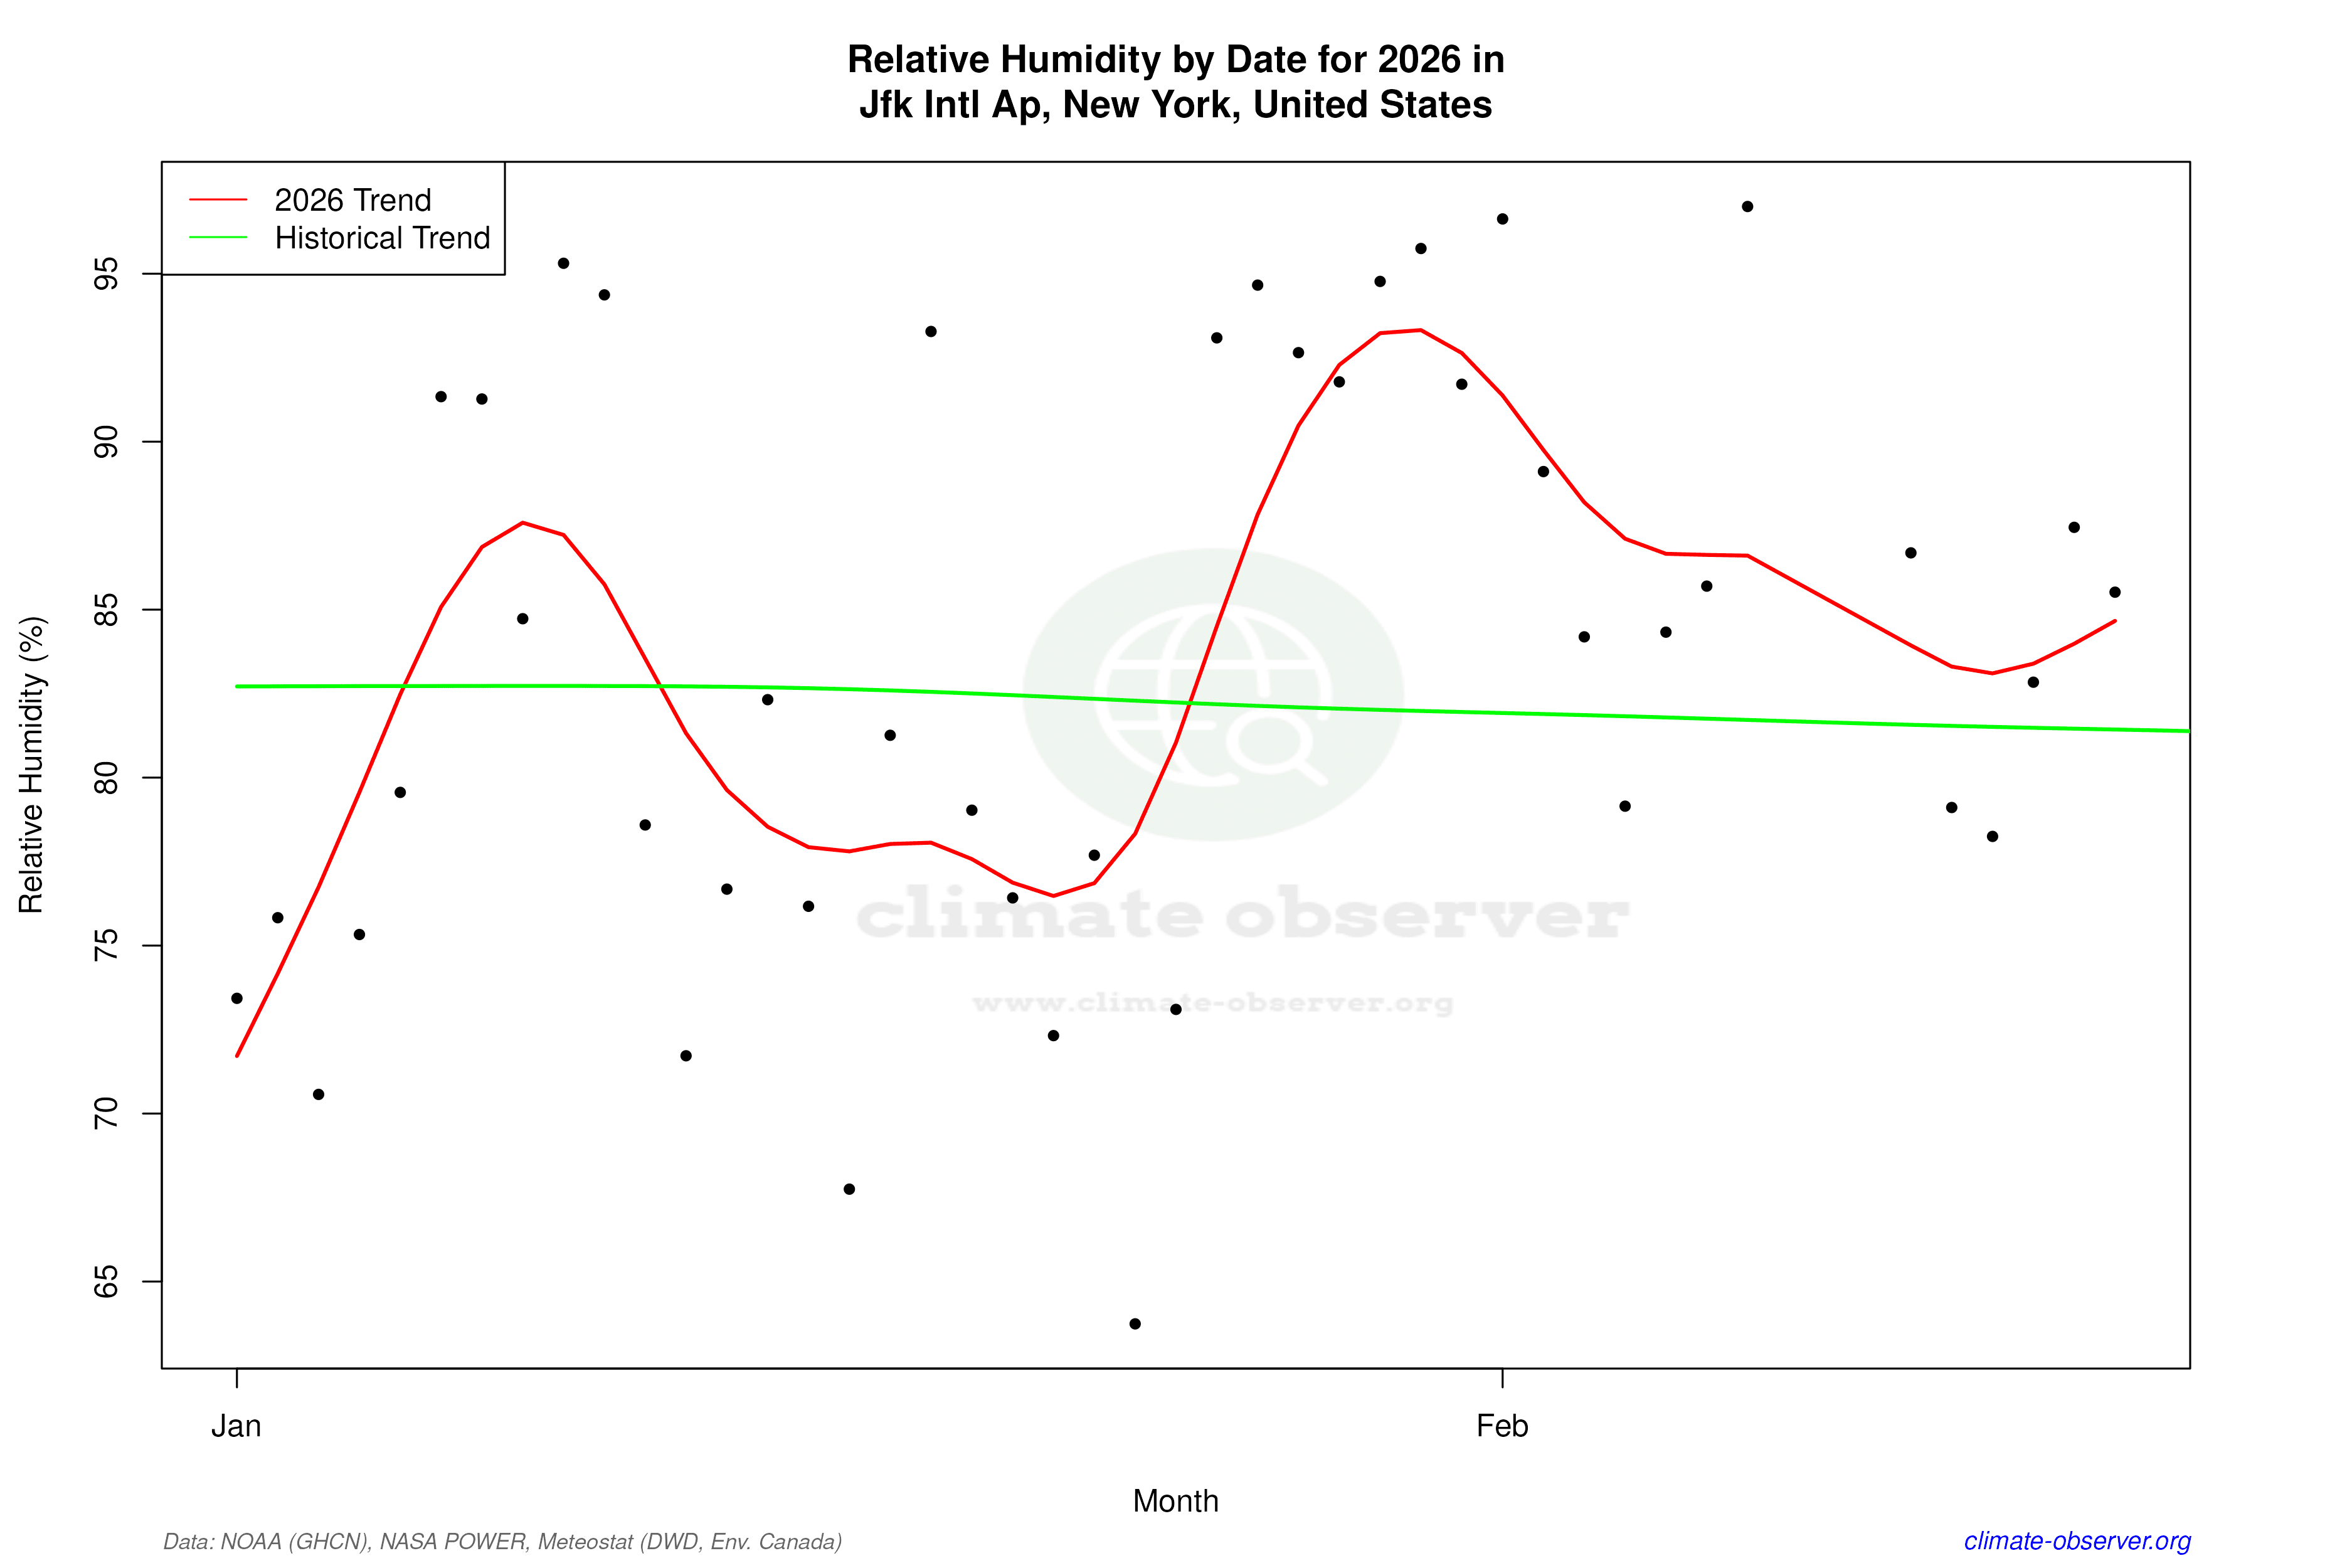
Remove WatermarksCurrent Year Climate Trends vs Historical


Max Temperature this Year | 1 of 6
Climate 12-Month Moving Averages


Max Temperature 12-Month MA | 1 of 6
Daily Data Points and Averages Throughout the Year


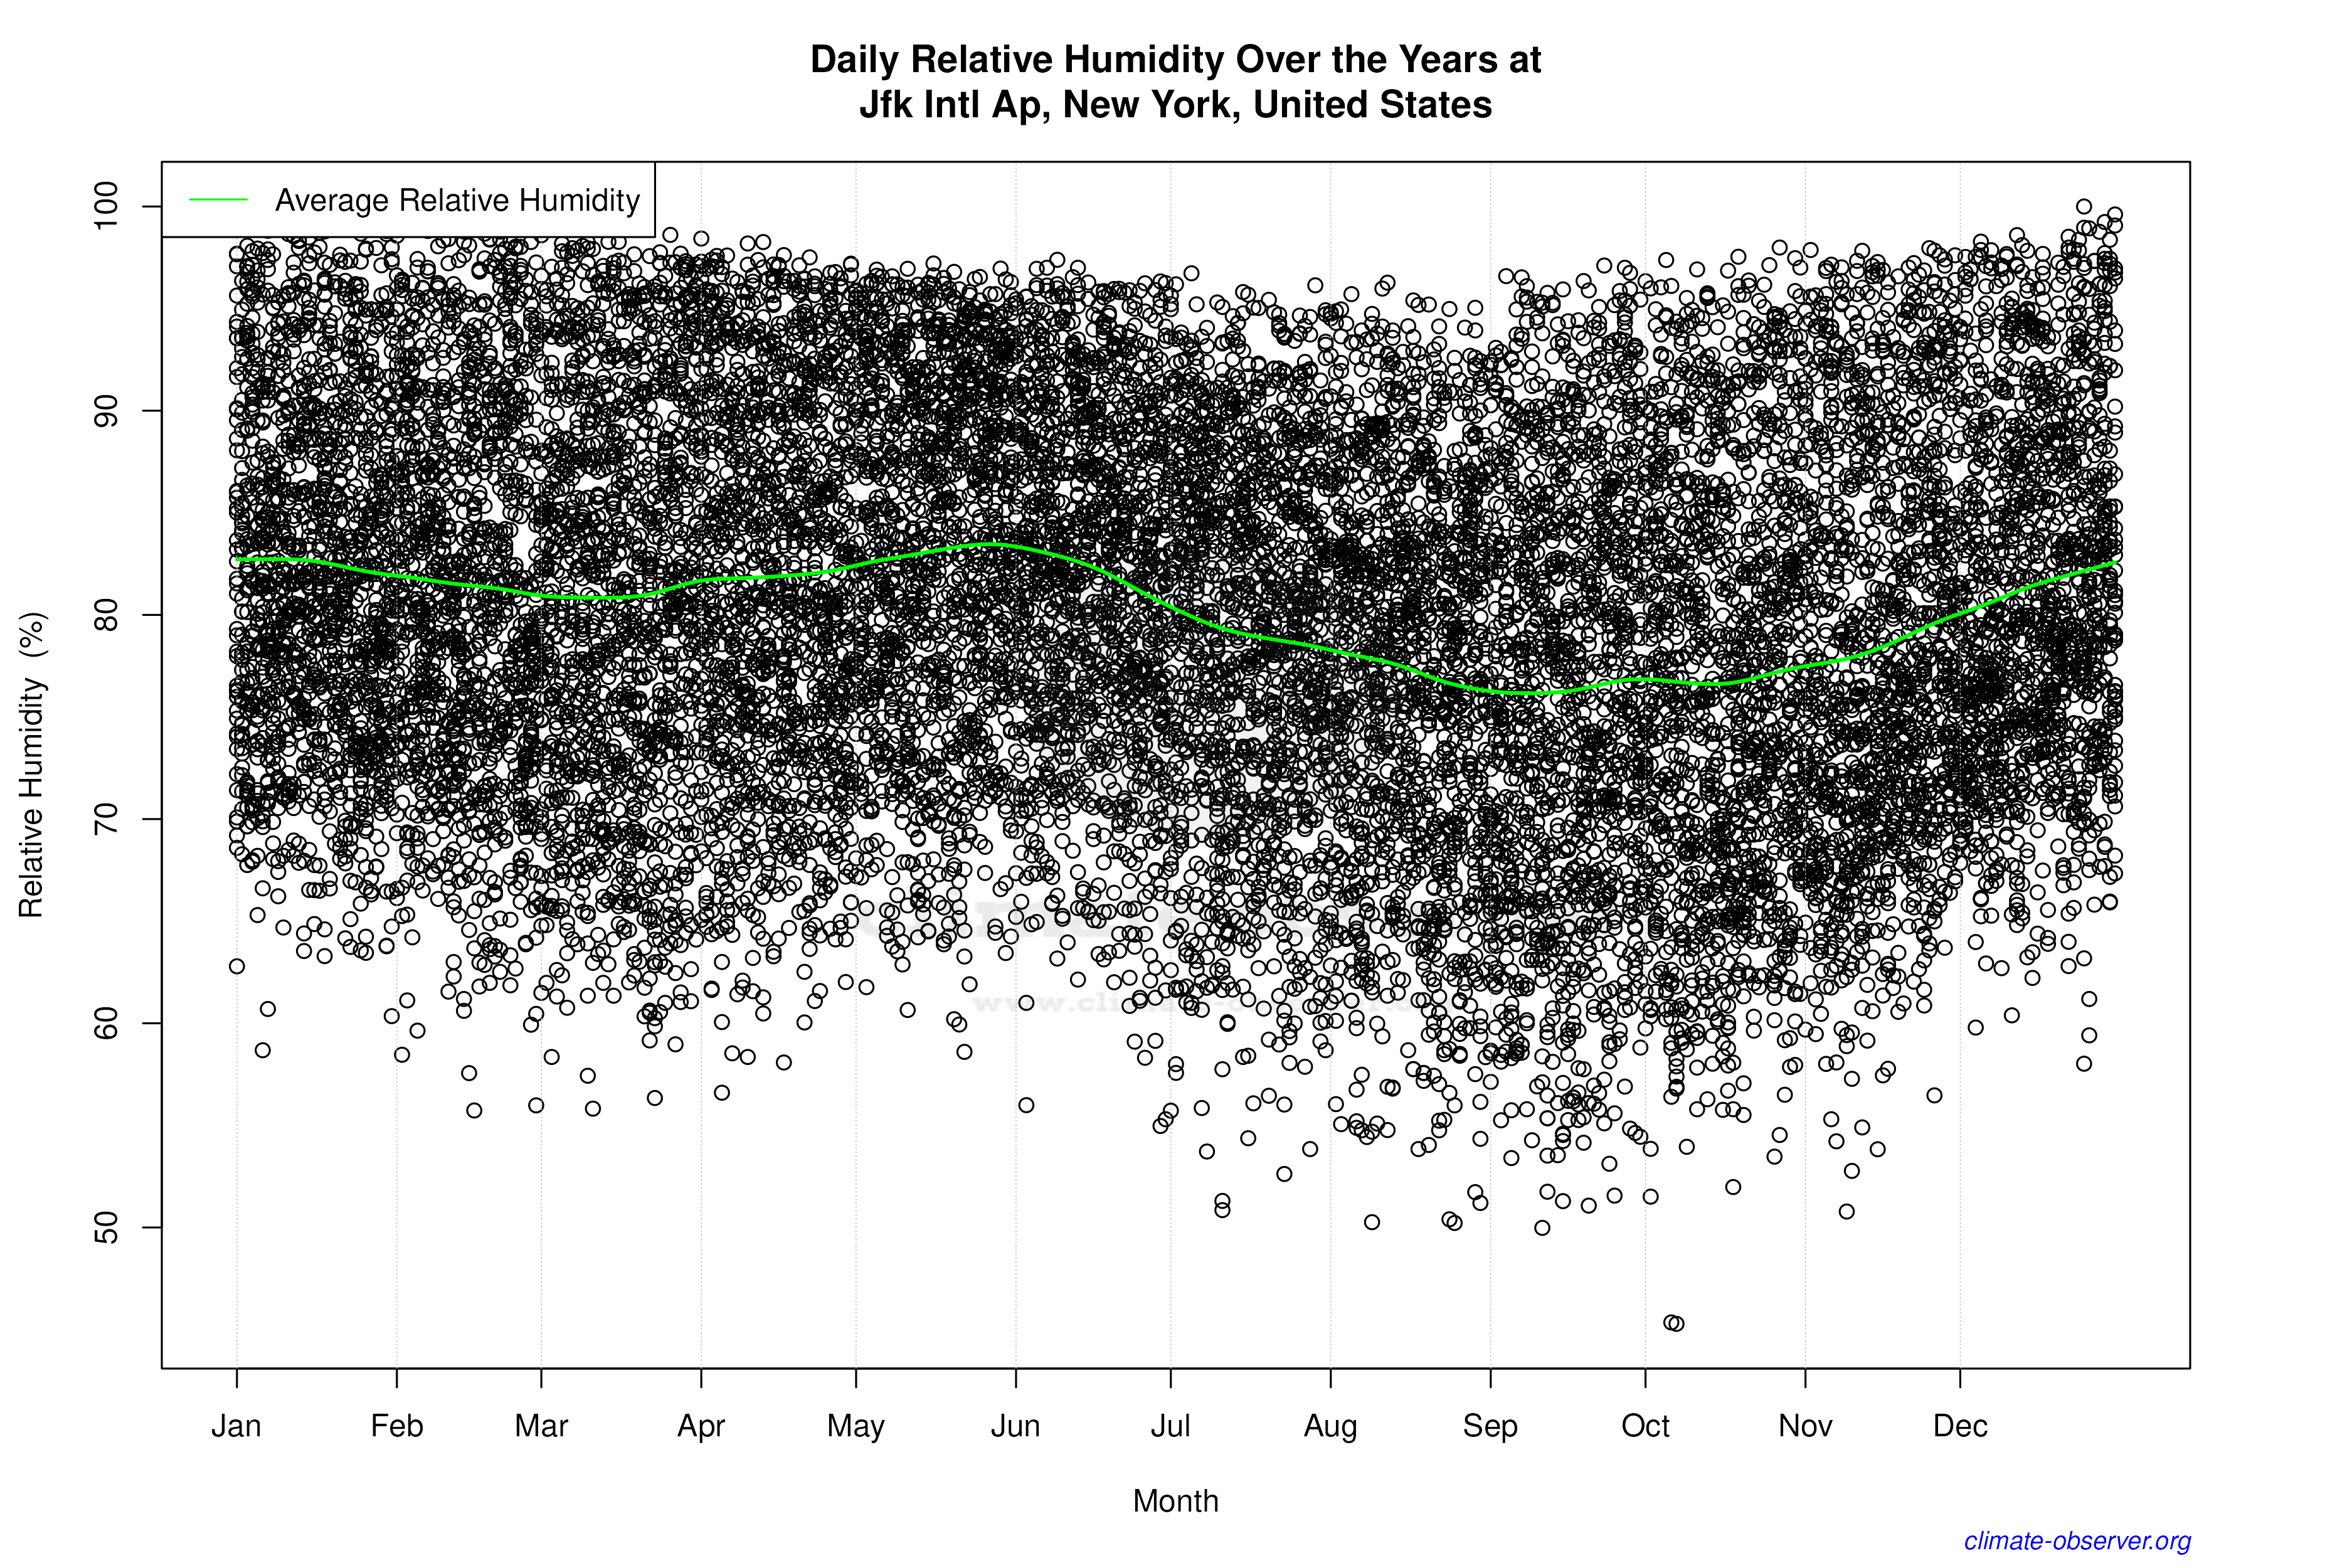

Average Max Temperature Throughout Year | 1 of 5
