Climate for Station: Ouagadougou, Centre Region, Burkina Faso
Loading live weather...
Climate Analysis & Overview
Ouagadougou is experiencing a nuanced warming trend, with temperatures rising more significantly in recent years than over the long term. Precipitation patterns have become slightly more even, indicating a shift in seasonal rainfall distribution.
Climate Context and Geography
Ouagadougou, the capital of Burkina Faso, is situated in a region classified under the Köppen climate classification as a tropical wet and dry climate (Aw). The city's geographical position at 12.353°N, -1.512°W places it in the Sahel region, characterised by a distinct wet and dry season. The absence of significant geographical barriers like mountains or large bodies of water means that Ouagadougou's climate is primarily influenced by the seasonal movement of the Intertropical Convergence Zone (ITCZ), which dictates the timing and intensity of rainfall.
Temperature Trends: A Decade of Change
Over the past decade, Ouagadougou has experienced a notable warming trend. The average high temperatures have increased by 0.51°C (0.92°F), while the lows have risen even more sharply by 0.83°C (1.49°F). This recent warming is more pronounced than the all-time trends, where highs have risen by 0.27°C (0.49°F) and lows by 0.29°C (0.52°F). This suggests that while the city has been warming over the long term, the rate of warming has accelerated in the last ten years, particularly during the cooler nights.
Extreme Temperatures: Record Highs and Lows
The record high temperature for Ouagadougou stands at a scorching 49.6°C (121.3°F), while the record low is a much cooler 8.4°C (47.1°F). These extremes highlight the city's susceptibility to significant temperature fluctuations, typical of the Sahel region, where intense heat during the day can be followed by much cooler nights.
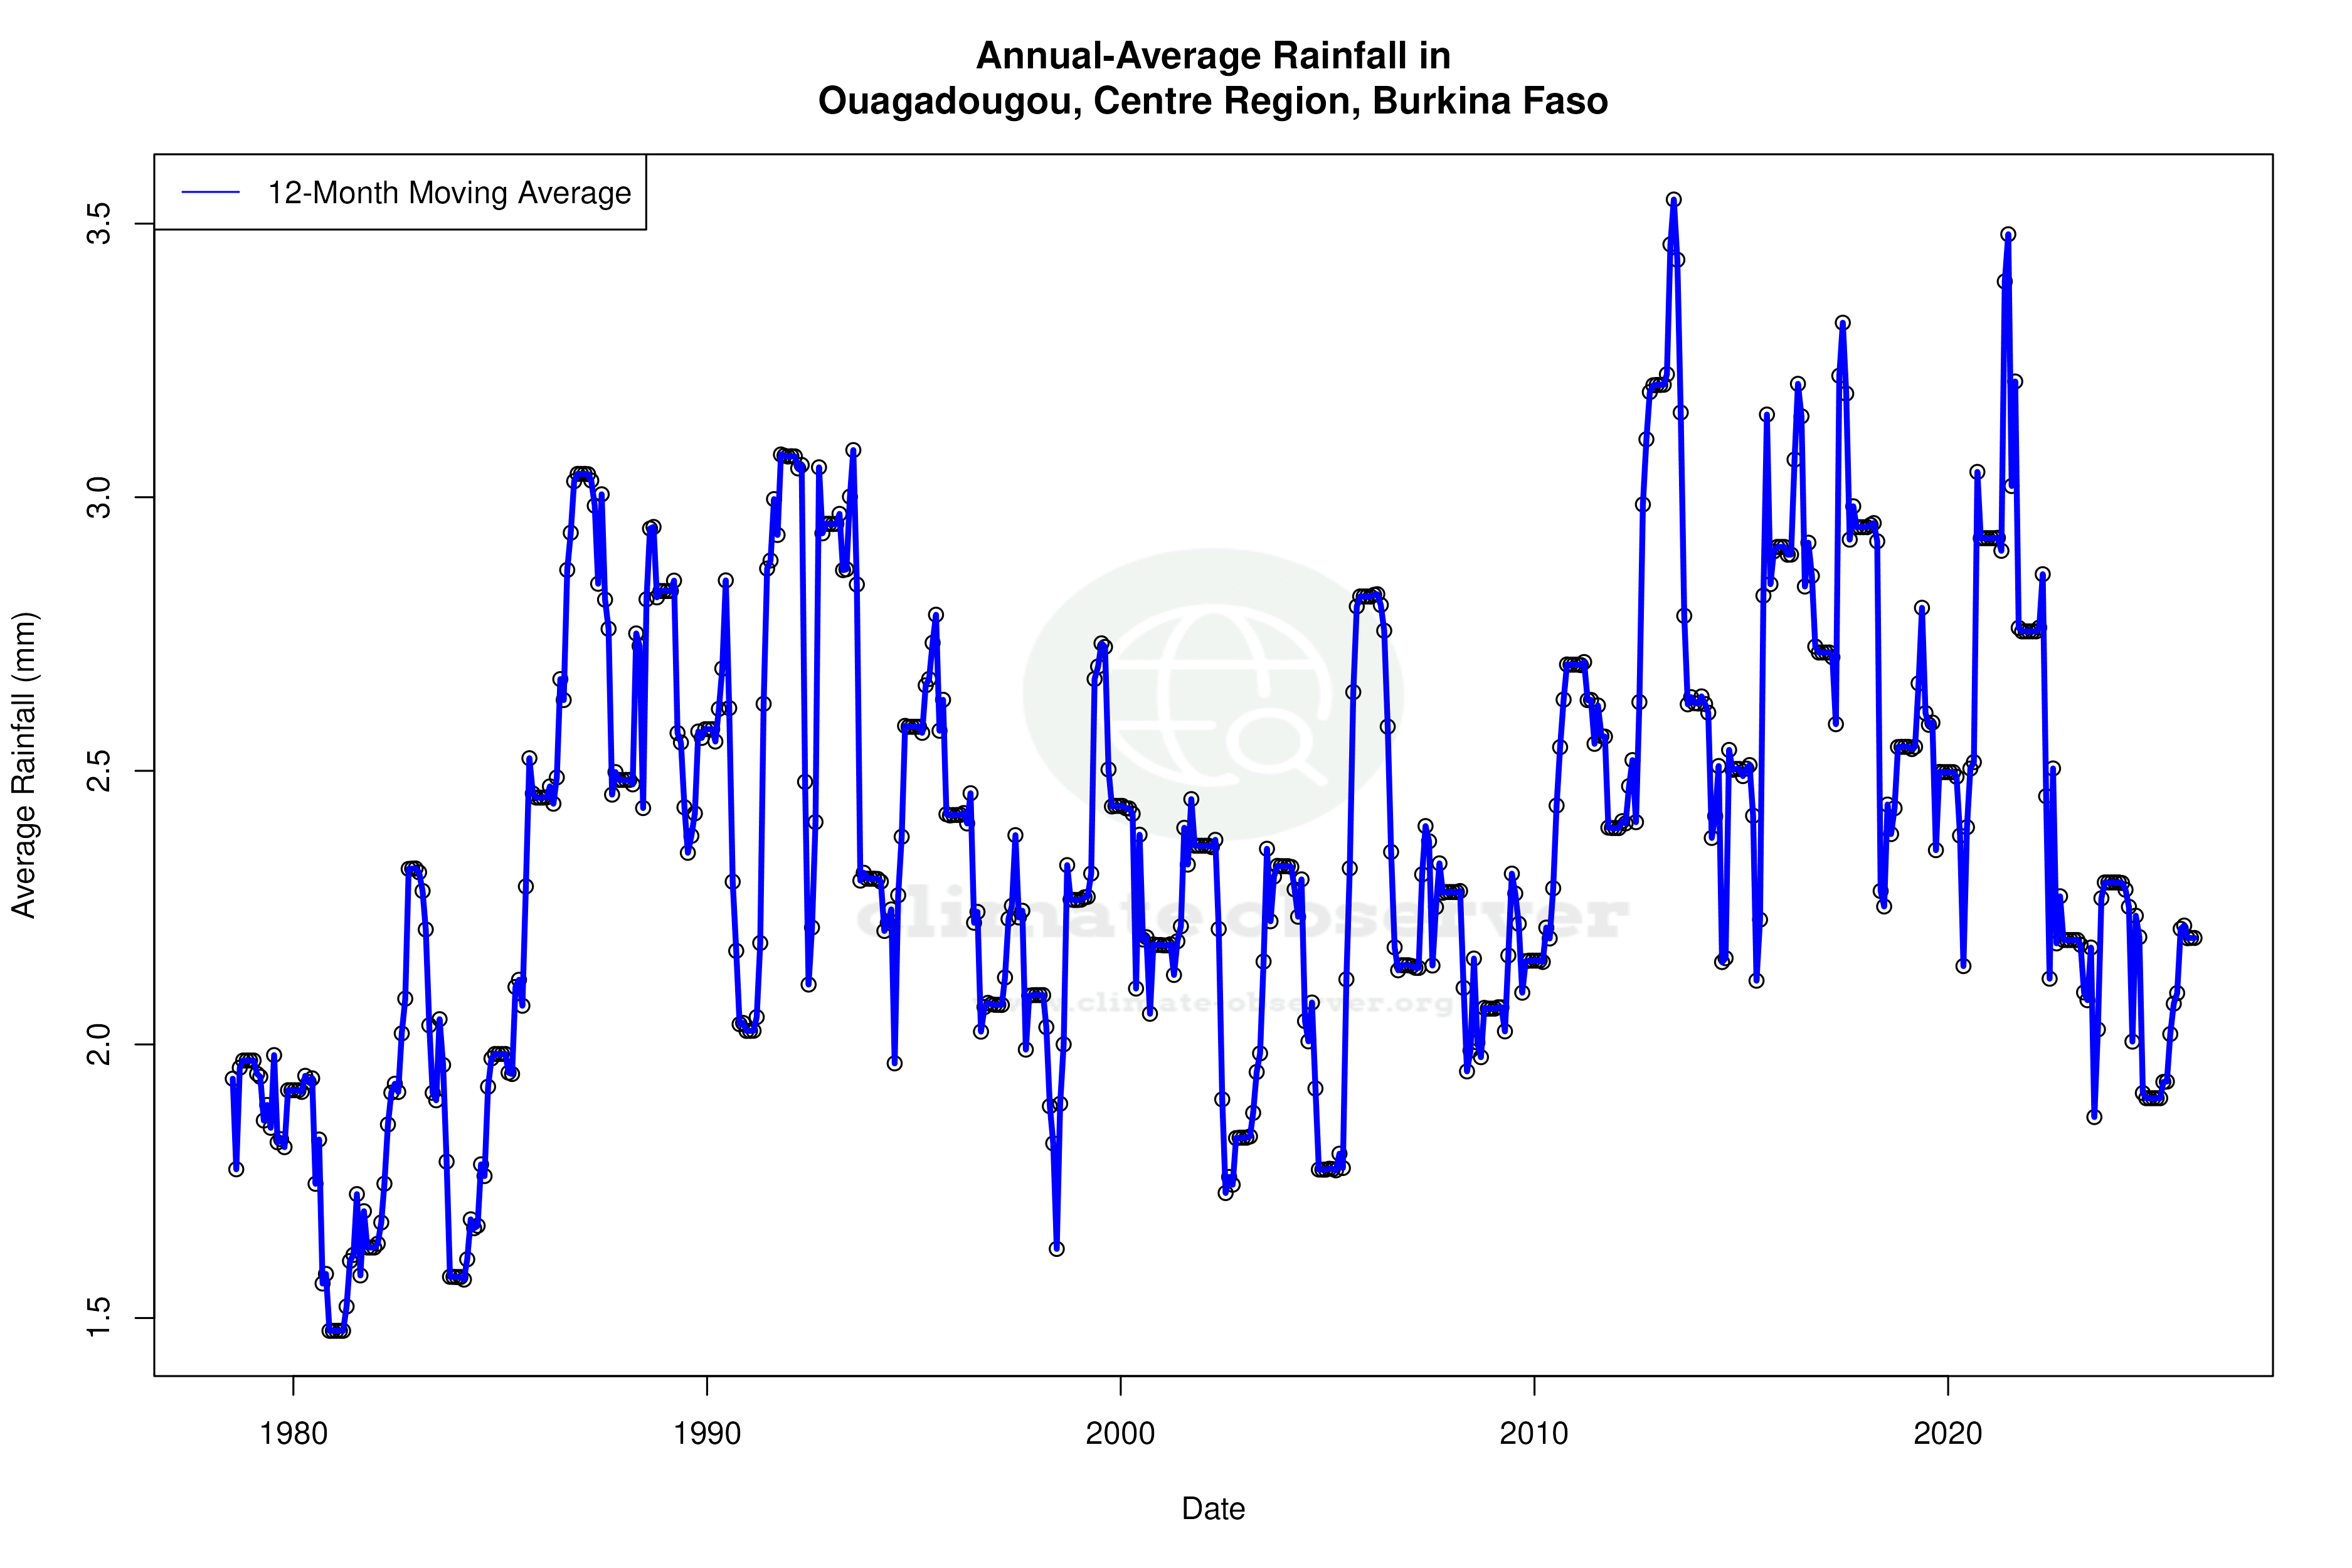
Precipitation Patterns: A Shift Towards Evenness
The Precipitation Concentration Index (PCI) provides insight into how rainfall is distributed throughout the year. Ouagadougou's PCI has decreased from a baseline of 20.37 to a current value of 18.23. This indicates a slight shift towards more evenly distributed rainfall events, suggesting that while the overall amount of precipitation may not have changed significantly, the distribution across the wet season has become less concentrated.
Regional Climate Goals and Implications
Burkina Faso has been actively working towards improving resilience to climate change, with initiatives aimed at sustainable agriculture and water management. The observed warming trends and changes in precipitation distribution in Ouagadougou align with the broader regional climate challenges. These trends necessitate adaptive strategies to mitigate the impacts of increased temperatures and altered rainfall patterns on agriculture and water resources, critical for the nation's food security and economic stability.
Station Statistics
10-Year Trend
High: +0.46 °C/decade
Low: +0.85 °C/decade
Rain: -0.86 mm/decade
25-Year Trend
High: +0.16 °C/decade
Low: +0.35 °C/decade
Rain: +0.11 mm/decade
50-Year Trend
High: +0.26 °C/decade
Low: +0.29 °C/decade
Rain: +0.09 mm/decade
All-Time Trend
High: +0.26 °C/decade
Low: +0.29 °C/decade
Rain: +0.09 mm/decade
Percentage Above-Average Days
Last 12 Months: 57.5%
This Year: 70.6%
Precipitation Concentration Index (PCI) ℹ️
Last 12 Months: 21.4
Historical Average: 20.9
Percentile Rank of Last 12 Months ℹ️
High: 77th percentile
Low: 93rd percentile
Rain: 38th percentile
Change in Variance ℹ️
High: +1.8%
Low: -1.6%
Intraday: +0.4%
Data Coverage
96.4%
First Year of Data
1973
Station Location
Historical Weather Records
| Max High | Avg High | Min High | Max Avg | Avg Avg | Min Avg | Max Low | Avg Low | Min Low | Max Precipitation | Avg Precipitation | Max Snow | Avg Snow | |
|---|---|---|---|---|---|---|---|---|---|---|---|---|---|
| Record | 49.6 °C | — | 23.0 °C | 39.8 °C | — | 17.3 °C | 33.0 °C | — | 8.4 °C | 140.9 mm | — | — | — |
| January | 43.5 °C | 33.3 °C | 23.5 °C | 33.2 °C | 25.1 °C | 17.3 °C | 24.6 °C | 17.0 °C | 10.0 °C | 4.4 mm | 0.0 mm | — | — |
| February | 42.5 °C | 36.2 °C | 26.2 °C | 35.9 °C | 28.1 °C | 19.1 °C | 28.0 °C | 19.8 °C | 11.4 °C | 7.9 mm | 0.0 mm | — | — |
| March | 48.0 °C | 39.0 °C | 27.7 °C | 37.8 °C | 31.7 °C | 23.0 °C | 32.0 °C | 24.1 °C | 14.1 °C | 12.0 mm | 0.1 mm | — | — |
| April | 48.8 °C | 40.0 °C | 29.8 °C | 39.8 °C | 33.4 °C | 24.9 °C | 32.5 °C | 26.9 °C | 15.0 °C | 52.1 mm | 1.0 mm | — | — |
| May | 49.6 °C | 38.3 °C | 28.3 °C | 37.6 °C | 32.2 °C | 24.2 °C | 33.0 °C | 26.7 °C | 15.2 °C | 140.9 mm | 2.5 mm | — | — |
| June | 42.9 °C | 35.4 °C | 26.0 °C | 36.3 °C | 29.8 °C | 24.1 °C | 30.6 °C | 24.8 °C | 18.5 °C | 99.1 mm | 3.9 mm | — | — |
| July | 40.0 °C | 32.7 °C | 24.5 °C | 32.7 °C | 27.6 °C | 22.1 °C | 28.5 °C | 23.3 °C | 15.8 °C | 111.8 mm | 6.7 mm | — | — |
| August | 38.0 °C | 31.5 °C | 24.0 °C | 31.8 °C | 26.6 °C | 22.4 °C | 26.6 °C | 22.6 °C | 17.0 °C | 89.9 mm | 7.7 mm | — | — |
| September | 41.8 °C | 32.7 °C | 23.0 °C | 34.4 °C | 27.4 °C | 21.9 °C | 28.2 °C | 22.8 °C | 18.0 °C | 135.9 mm | 4.9 mm | — | — |
| October | 40.8 °C | 35.7 °C | 28.0 °C | 34.2 °C | 29.2 °C | 23.0 °C | 27.9 °C | 23.3 °C | 16.0 °C | 80.0 mm | 1.4 mm | — | — |
| November | 39.6 °C | 36.2 °C | 29.7 °C | 33.9 °C | 28.2 °C | 21.2 °C | 27.0 °C | 20.1 °C | 8.4 °C | 25.9 mm | 0.0 mm | — | — |
| December | 39.8 °C | 33.9 °C | 25.0 °C | 33.1 °C | 25.6 °C | 18.5 °C | 26.0 °C | 17.3 °C | 10.9 °C | 3.2 mm | 0.0 mm | — | — |
Data Visualisations
Remove WatermarksCurrent Year Climate Trends vs Historical


Max Temperature this Year | 1 of 6
Climate 12-Month Moving Averages


Max Temperature 12-Month MA | 1 of 6
Daily Data Points and Averages Throughout the Year


Average Max Temperature Throughout Year | 1 of 5
