Climate for Station: Bobo Dioulasso, Hauts-Bassins Region, Burkina Faso
Loading live weather...
Climate Analysis & Overview
Bobo Dioulasso's climate is experiencing a subtle warming trend, with a notable decrease in temperature extremes over the past decade. Precipitation patterns have become more evenly distributed, which may influence local agricultural practices.
Subtle Warming in Bobo Dioulasso
Bobo Dioulasso, situated in the Hauts-Bassins region of Burkina Faso, is characterised by a tropical savanna climate under the Köppen classification. This climate typically involves distinct wet and dry seasons, influenced by the surrounding geography, including the nearby Black Volta River. Over the long term, the area has experienced a 0.25°C (0.45°F) rise in high temperatures and a 0.12°C (0.22°F) increase in low temperatures. Despite these warming trends, the past decade has shown a slight cooling of 0.15°C (0.27°F) in high temperatures, while low temperatures have increased by 0.03°C (0.05°F). These shifts suggest a complex interplay of climatic forces at work.
Temperature Extremes and Records
The city's historical temperature records highlight the extremes of its climate, with an all-time high of 44.1°C (111.4°F) and a low of 10.36°C (50.6°F). These records underscore the range of thermal conditions experienced in Bobo Dioulasso, which can impact local ecosystems and human activities. The recent decade's cooling trend in high temperatures may offer some respite from the intense heat, although the overall warming trend suggests a need for adaptive strategies.
Precipitation Patterns and Distribution
The Precipitation Concentration Index (PCI) provides insight into rainfall distribution. A decrease from a baseline of 18.5 to the current 16.8 indicates a more even distribution of precipitation events. This shift could be beneficial for agriculture, as more evenly distributed rainfall can support crop growth and reduce the risk of drought. However, the PCI remains above 10, suggesting that while improvements are evident, rainfall is still somewhat concentrated.
Regional Climate Goals and Implications
Burkina Faso has been actively working towards sustainable climate goals, aiming to enhance resilience against climate variability. The observed trends in Bobo Dioulasso, such as the gradual warming and the more even distribution of rainfall, align with these objectives. These changes could support efforts to improve water management and agricultural productivity, crucial for the region's socio-economic development.
Navigating Climate Dynamics
The interplay of warming trends and evolving precipitation patterns in Bobo Dioulasso presents both challenges and opportunities. As the region continues to adapt to these changes, understanding and integrating these climatic insights will be essential for future planning and development. The city's climate story is one of gradual transformation, influenced by both natural variability and human endeavours.
Station Statistics
10-Year Trend
High: -0.10 °C/decade
Low: -0.08 °C/decade
Rain: -1.48 mm/decade
25-Year Trend
High: -0.07 °C/decade
Low: +0.11 °C/decade
Rain: +0.09 mm/decade
50-Year Trend
High: +0.21 °C/decade
Low: +0.13 °C/decade
Rain: +0.07 mm/decade
All-Time Trend
High: +0.21 °C/decade
Low: +0.13 °C/decade
Rain: +0.07 mm/decade
Percentage Above-Average Days
Last 12 Months: 55.6%
This Year: 67.5%
Precipitation Concentration Index (PCI) ℹ️
Last 12 Months: 18.4
Historical Average: 17.6
Percentile Rank of Last 12 Months ℹ️
High: 43rd percentile
Low: 72nd percentile
Rain: 15th percentile
Change in Variance ℹ️
High: -4.2%
Low: +4.1%
Intraday: +6.7%
Data Coverage
96.4%
First Year of Data
1974
Station Location
Historical Weather Records
| Max High | Avg High | Min High | Max Avg | Avg Avg | Min Avg | Max Low | Avg Low | Min Low | Max Precipitation | Avg Precipitation | Max Snow | Avg Snow | |
|---|---|---|---|---|---|---|---|---|---|---|---|---|---|
| Record | 44.1 °C | — | 22.3 °C | 36.9 °C | — | 17.6 °C | 30.0 °C | — | 10.4 °C | 142.0 mm | — | — | — |
| January | 39.3 °C | 33.2 °C | 24.1 °C | 33.4 °C | 26.2 °C | 17.6 °C | 26.2 °C | 18.8 °C | 10.7 °C | 10.1 mm | 0.0 mm | — | — |
| February | 40.7 °C | 35.6 °C | 24.6 °C | 35.3 °C | 28.9 °C | 20.8 °C | 29.5 °C | 21.8 °C | 12.4 °C | 26.7 mm | 0.1 mm | — | — |
| March | 41.9 °C | 37.3 °C | 27.0 °C | 36.9 °C | 31.0 °C | 22.4 °C | 30.0 °C | 24.6 °C | 15.0 °C | 49.0 mm | 0.7 mm | — | — |
| April | 44.1 °C | 37.2 °C | 26.0 °C | 36.8 °C | 31.1 °C | 23.5 °C | 30.0 °C | 25.4 °C | 19.5 °C | 81.0 mm | 2.1 mm | — | — |
| May | 41.7 °C | 35.2 °C | 26.0 °C | 35.2 °C | 29.6 °C | 23.3 °C | 29.0 °C | 24.4 °C | 15.7 °C | 110.0 mm | 3.8 mm | — | — |
| June | 39.4 °C | 32.4 °C | 24.0 °C | 33.2 °C | 27.4 °C | 21.7 °C | 27.8 °C | 22.8 °C | 17.0 °C | 142.0 mm | 5.2 mm | — | — |
| July | 38.3 °C | 30.3 °C | 24.0 °C | 30.9 °C | 25.8 °C | 21.0 °C | 25.0 °C | 22.0 °C | 18.0 °C | 135.9 mm | 7.0 mm | — | — |
| August | 37.4 °C | 29.5 °C | 22.3 °C | 30.0 °C | 25.1 °C | 18.4 °C | 25.0 °C | 21.7 °C | 17.8 °C | 113.0 mm | 9.2 mm | — | — |
| September | 39.2 °C | 30.6 °C | 23.0 °C | 31.0 °C | 25.7 °C | 20.6 °C | 25.1 °C | 21.6 °C | 16.0 °C | 119.9 mm | 6.8 mm | — | — |
| October | 40.0 °C | 33.1 °C | 25.0 °C | 32.2 °C | 27.4 °C | 21.1 °C | 25.2 °C | 22.1 °C | 17.0 °C | 55.1 mm | 2.6 mm | — | — |
| November | 39.6 °C | 34.4 °C | 28.2 °C | 32.2 °C | 27.9 °C | 22.3 °C | 26.2 °C | 20.9 °C | 12.9 °C | 32.0 mm | 0.3 mm | — | — |
| December | 37.6 °C | 33.1 °C | 24.8 °C | 32.0 °C | 26.3 °C | 19.0 °C | 25.0 °C | 18.8 °C | 10.4 °C | 7.9 mm | 0.0 mm | — | — |
Data Visualisations
Remove WatermarksCurrent Year Climate Trends vs Historical


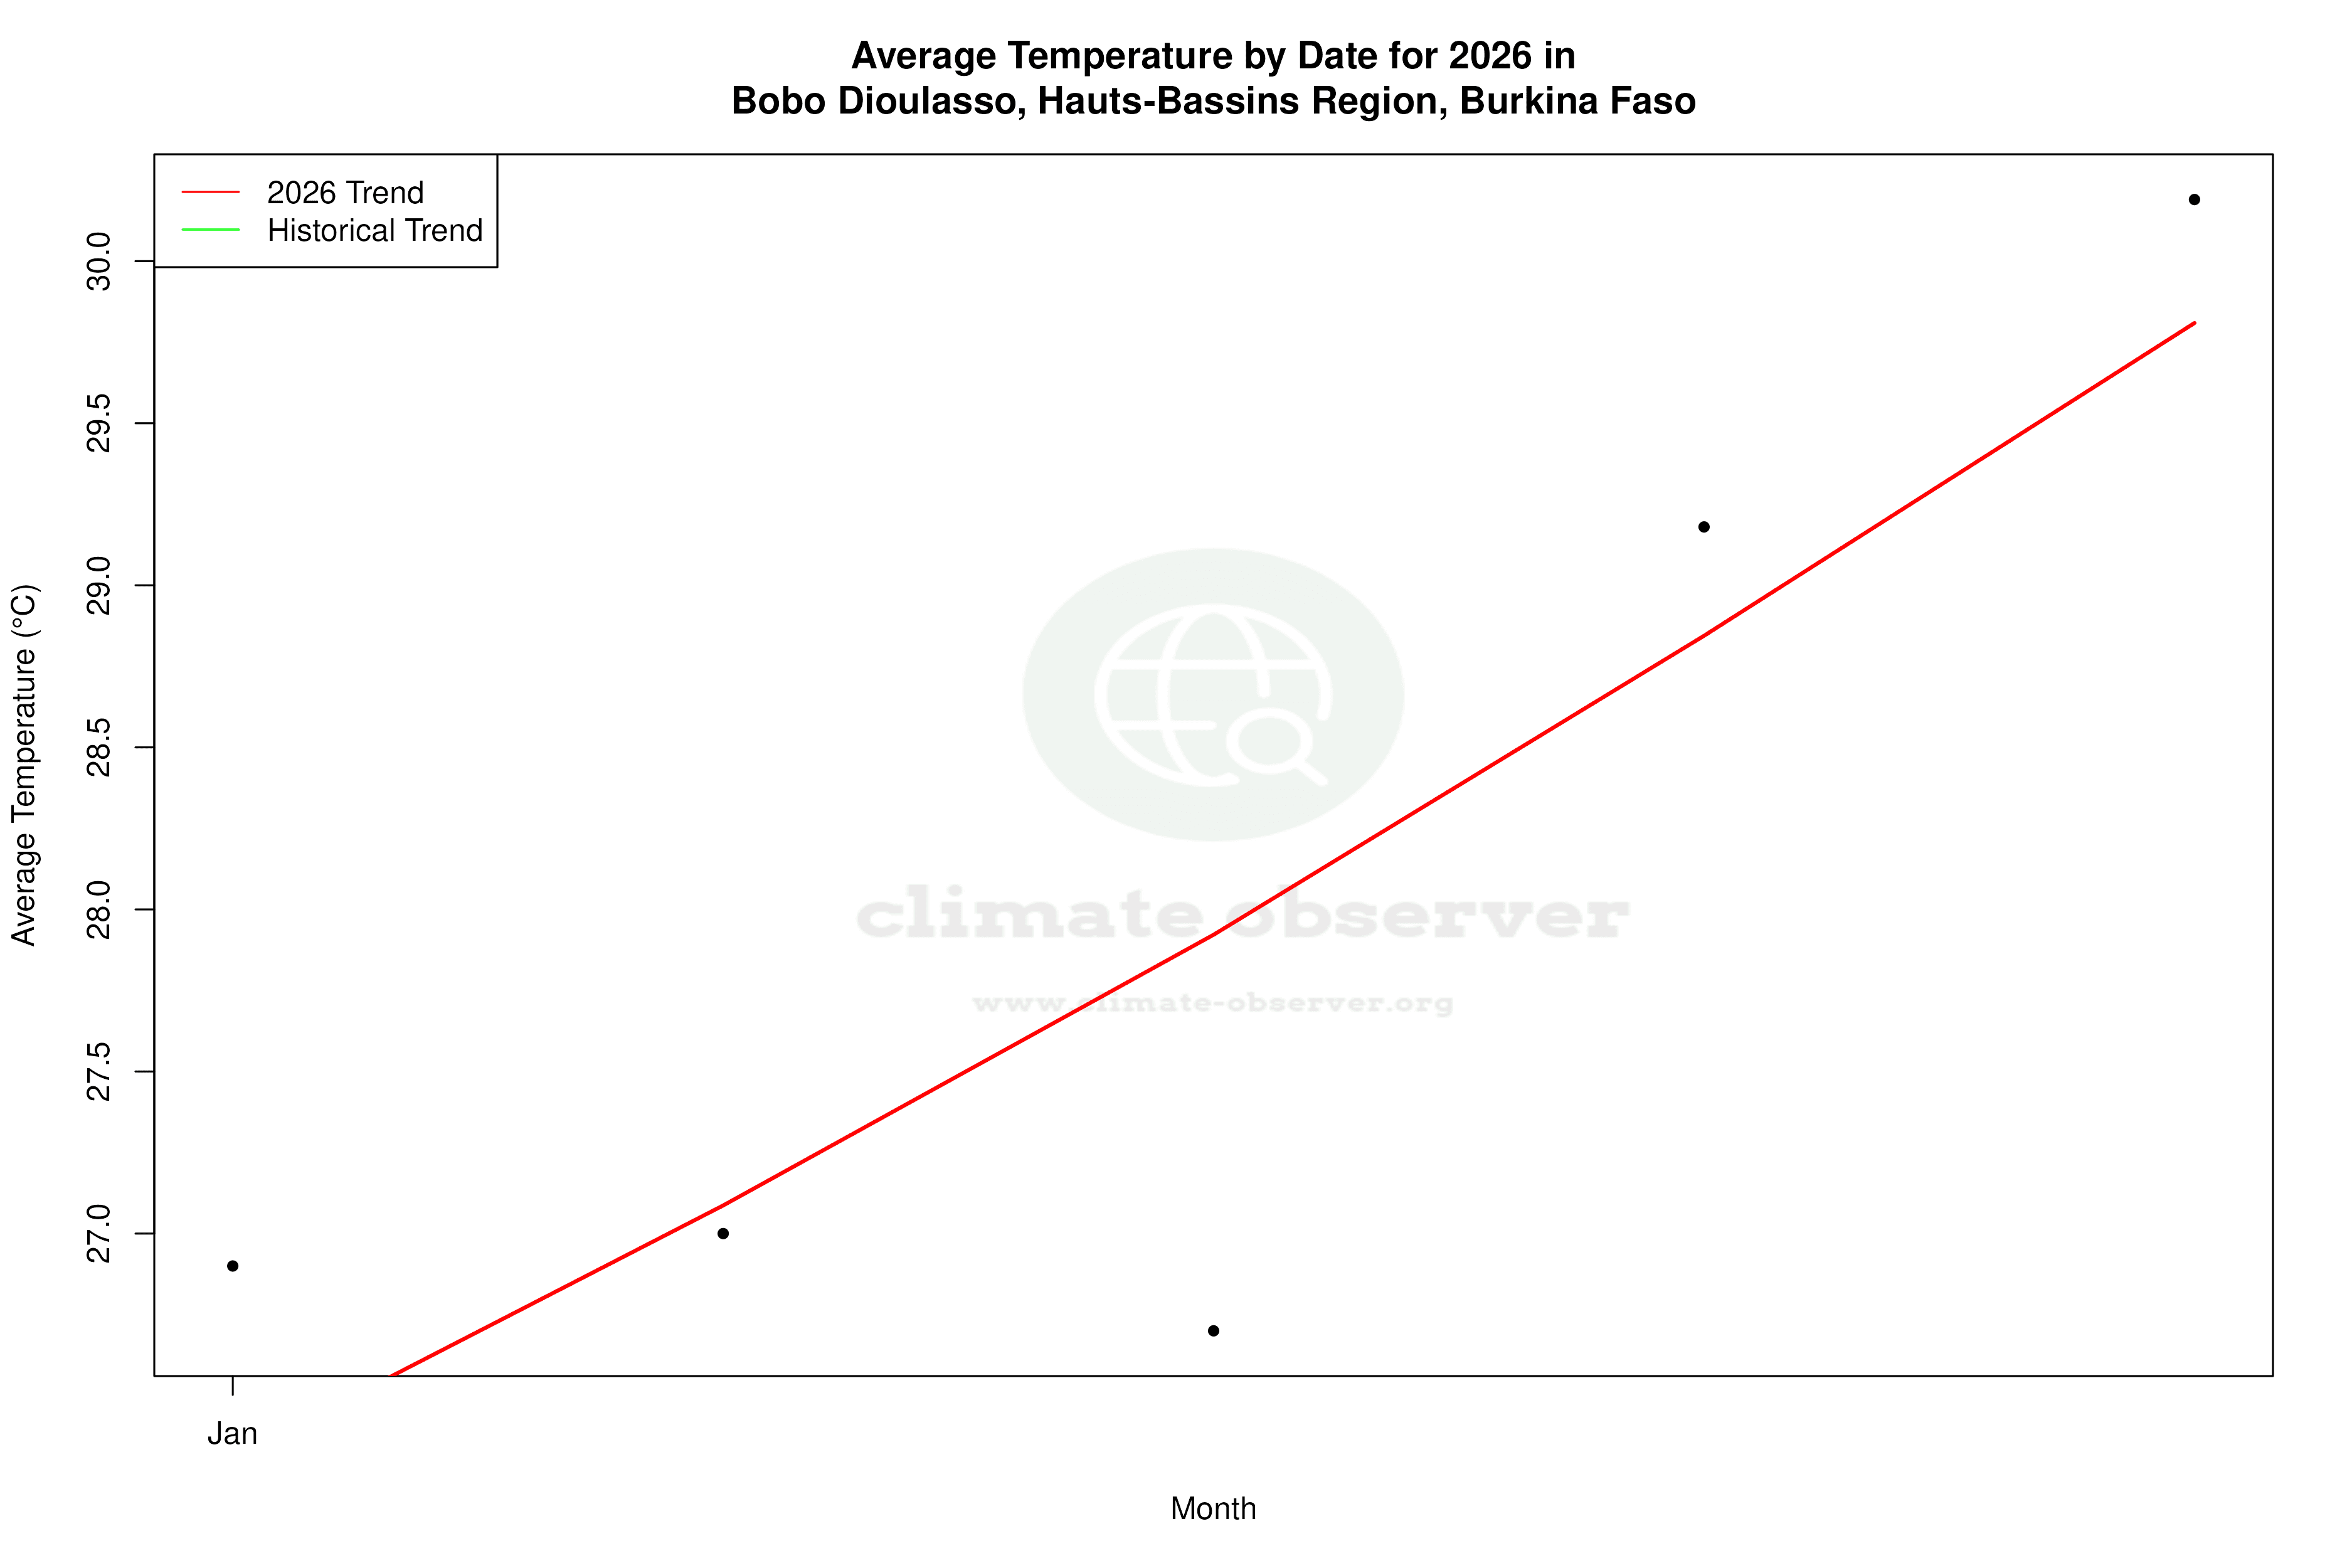


Max Temperature this Year | 1 of 6
Climate 12-Month Moving Averages


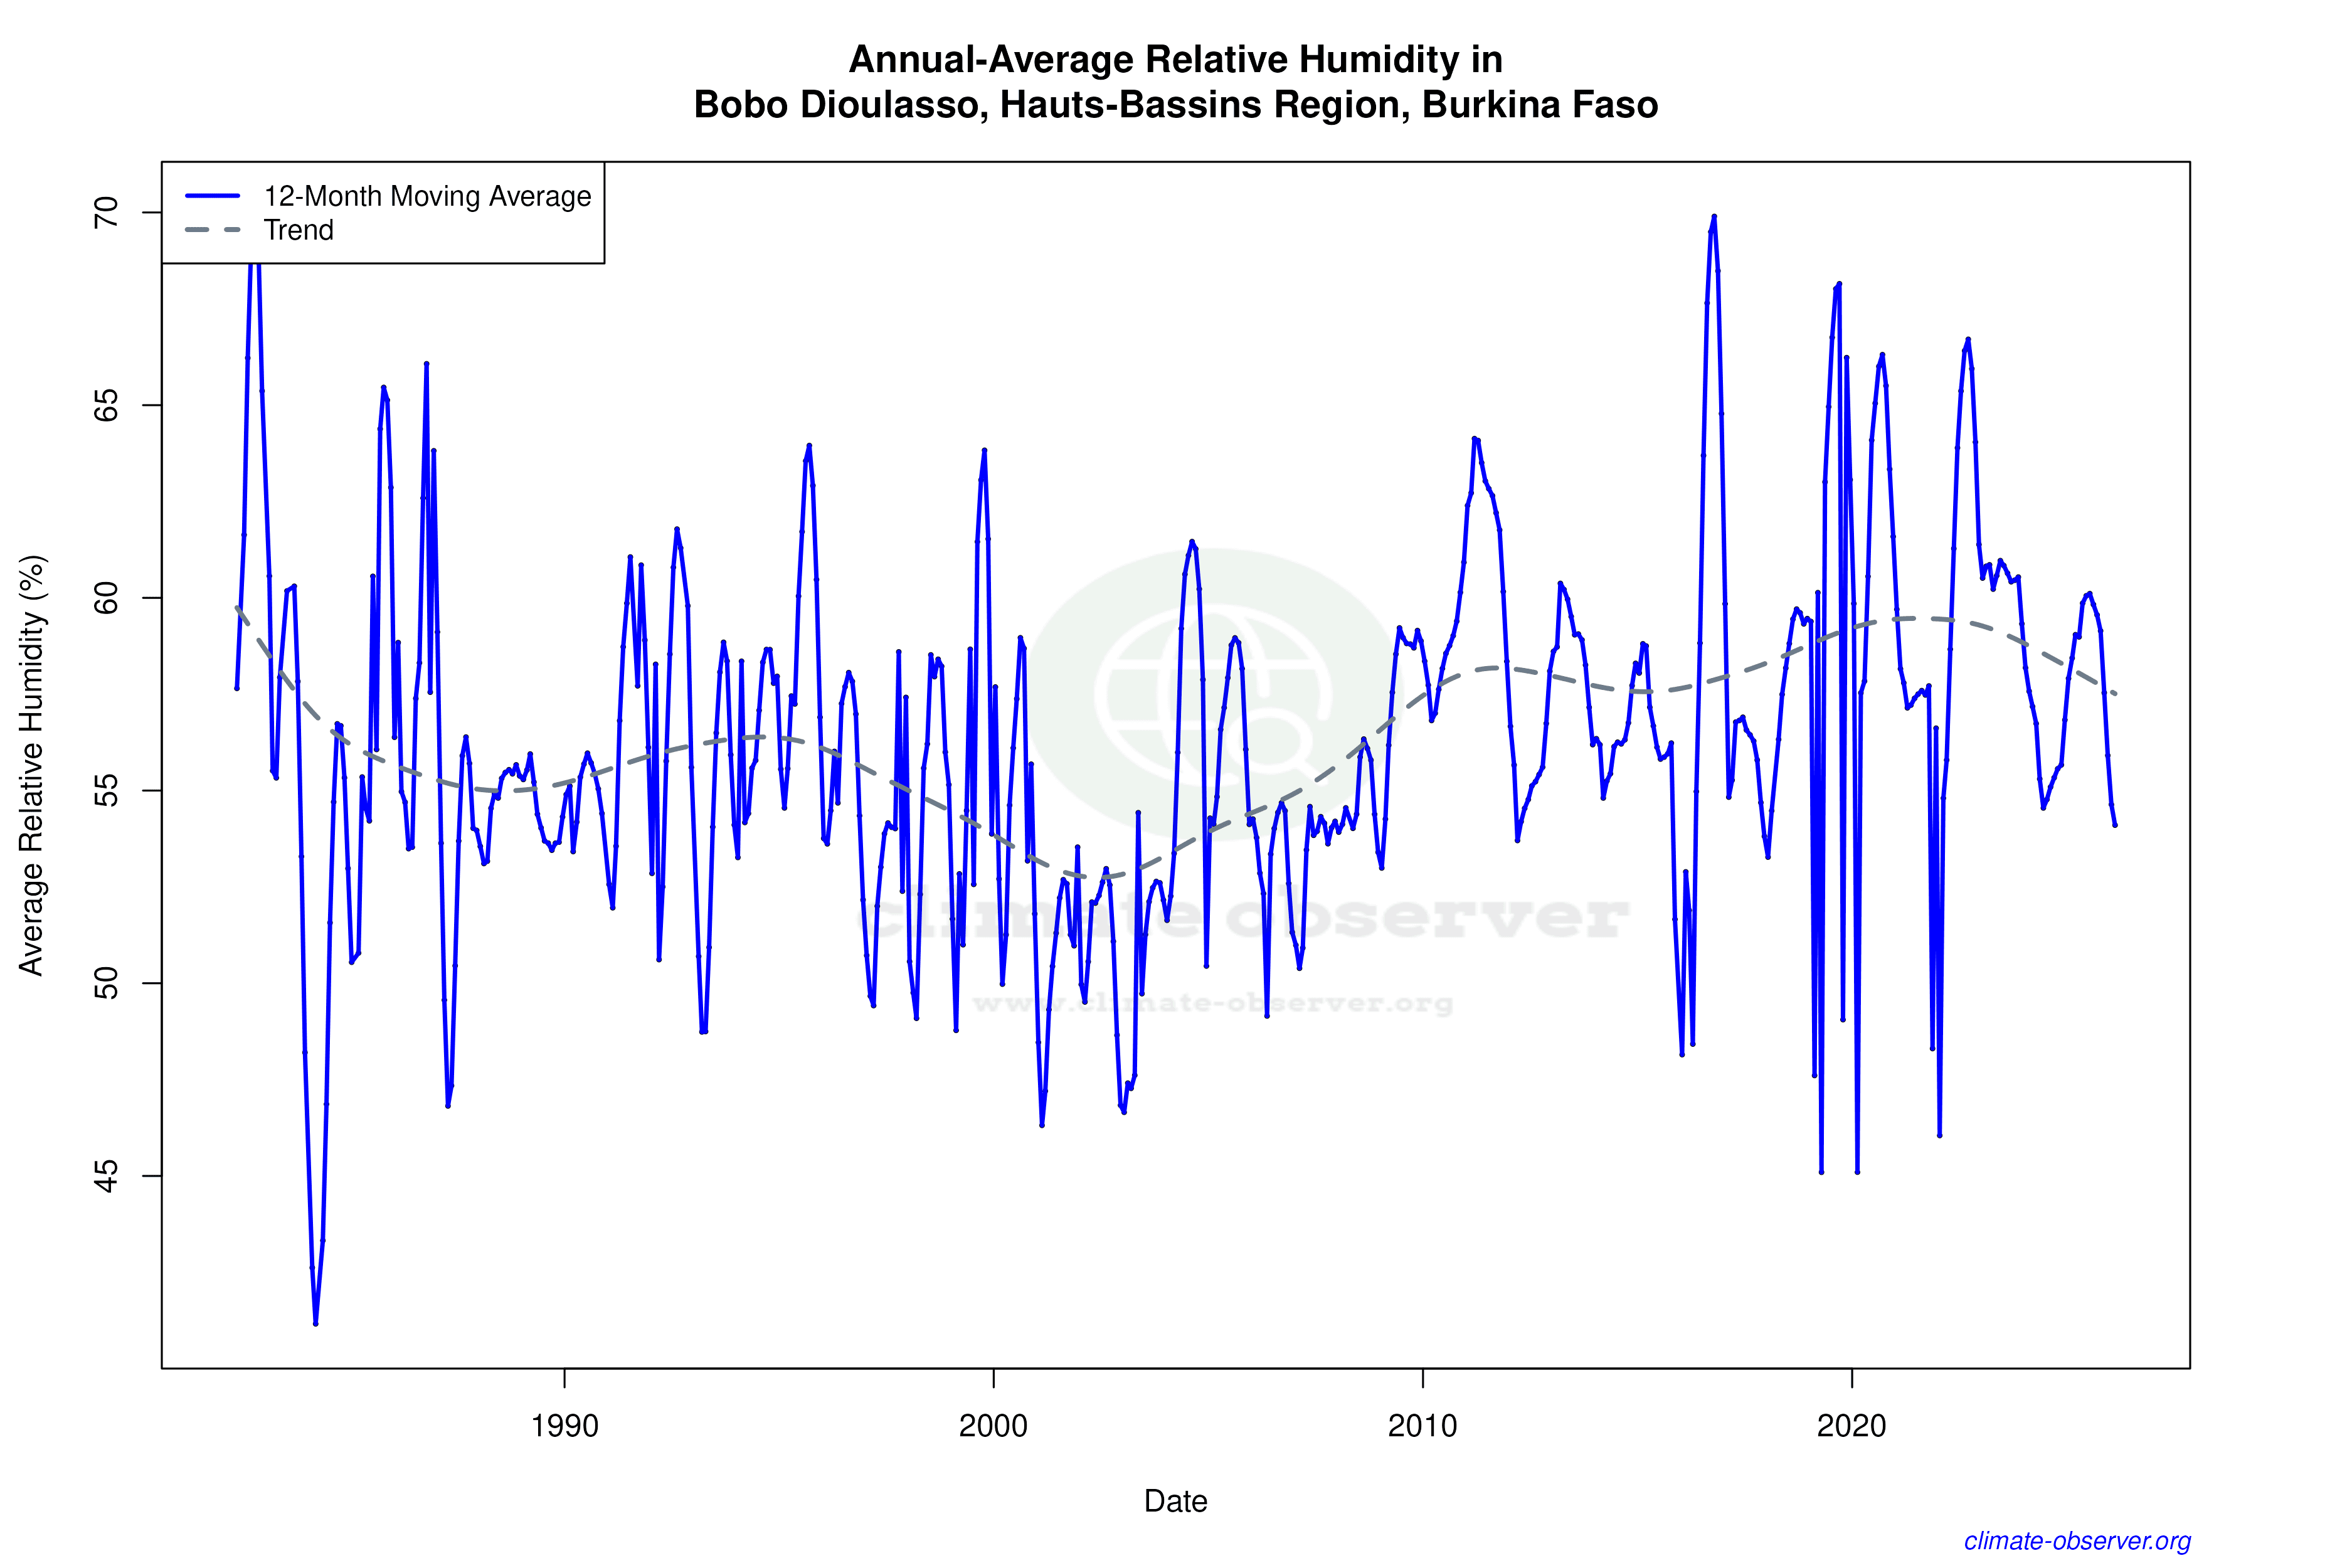

Max Temperature 12-Month MA | 1 of 6
Daily Data Points and Averages Throughout the Year


Average Max Temperature Throughout Year | 1 of 5
