Climate for Station: Henry e Rohlsen Ap, Saint Croix, Virgin Islands [United States]
Loading live weather...
Climate Analysis & Overview
The Henry E Rohlsen Airport in Saint Croix, United States Virgin Islands, is experiencing a warming trend with a notable increase in both high and low temperatures over the past decade. The precipitation pattern has become slightly more even, suggesting a subtle shift in rainfall distribution.
Tropical Climate Dynamics
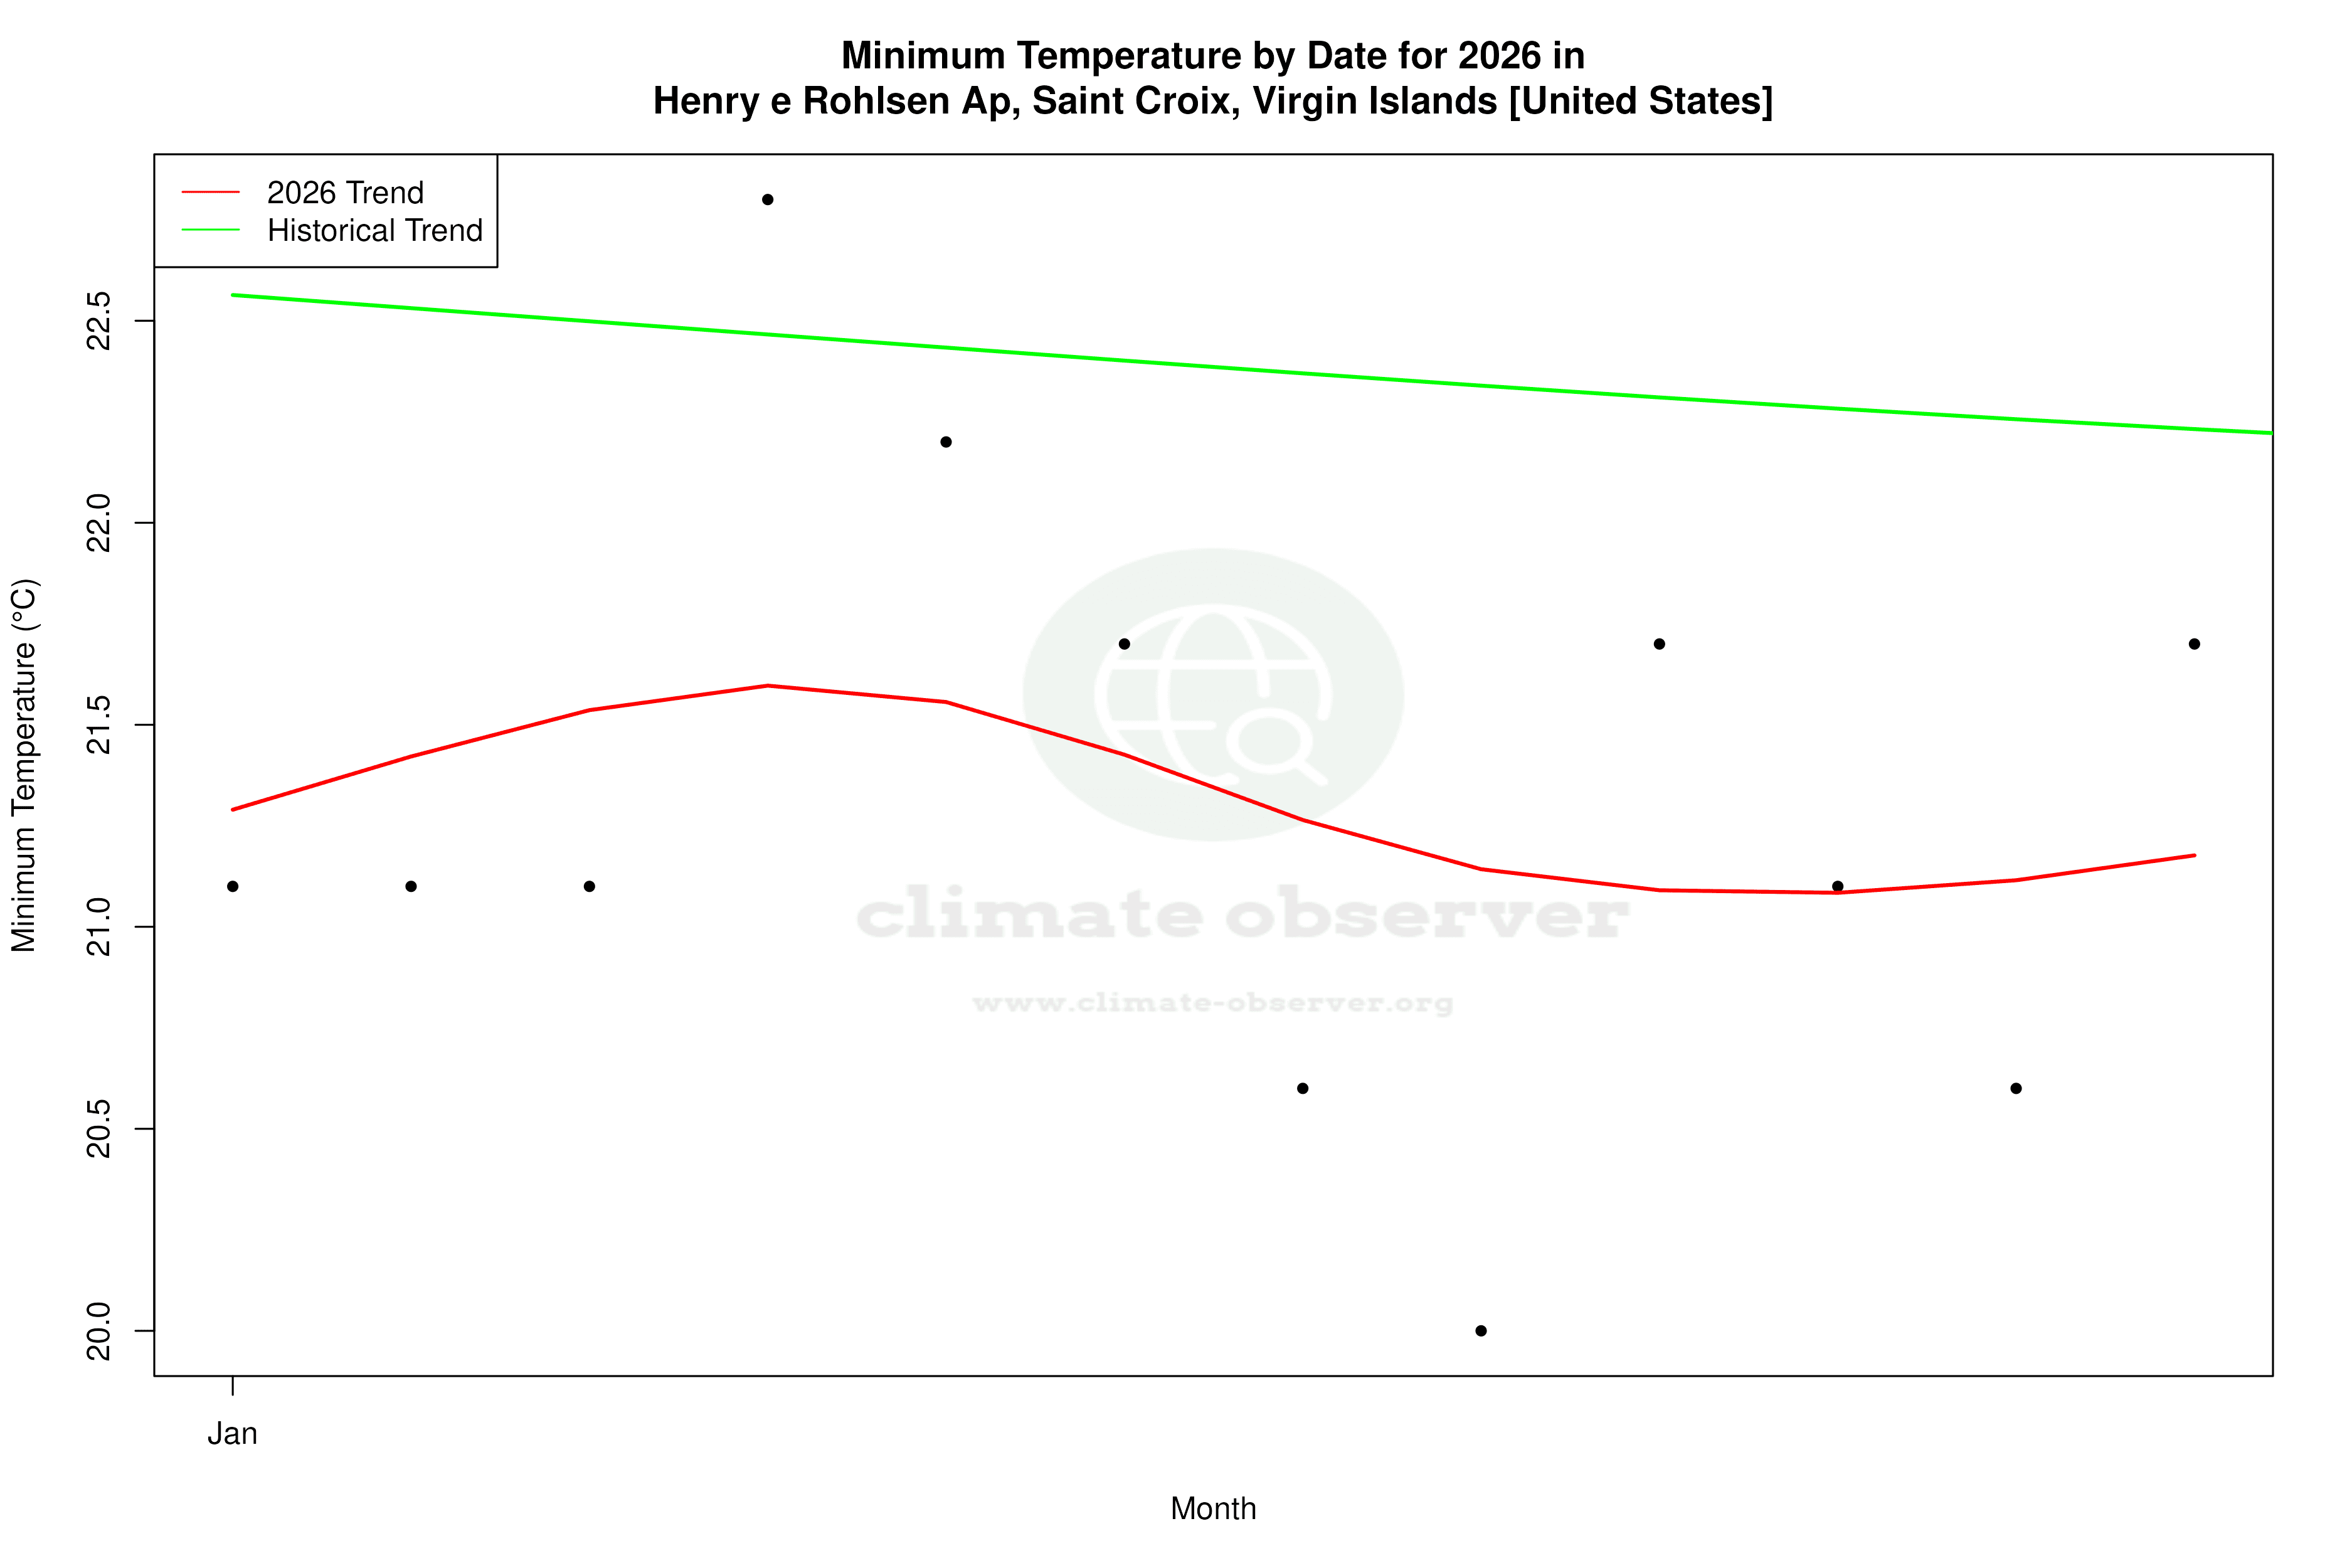
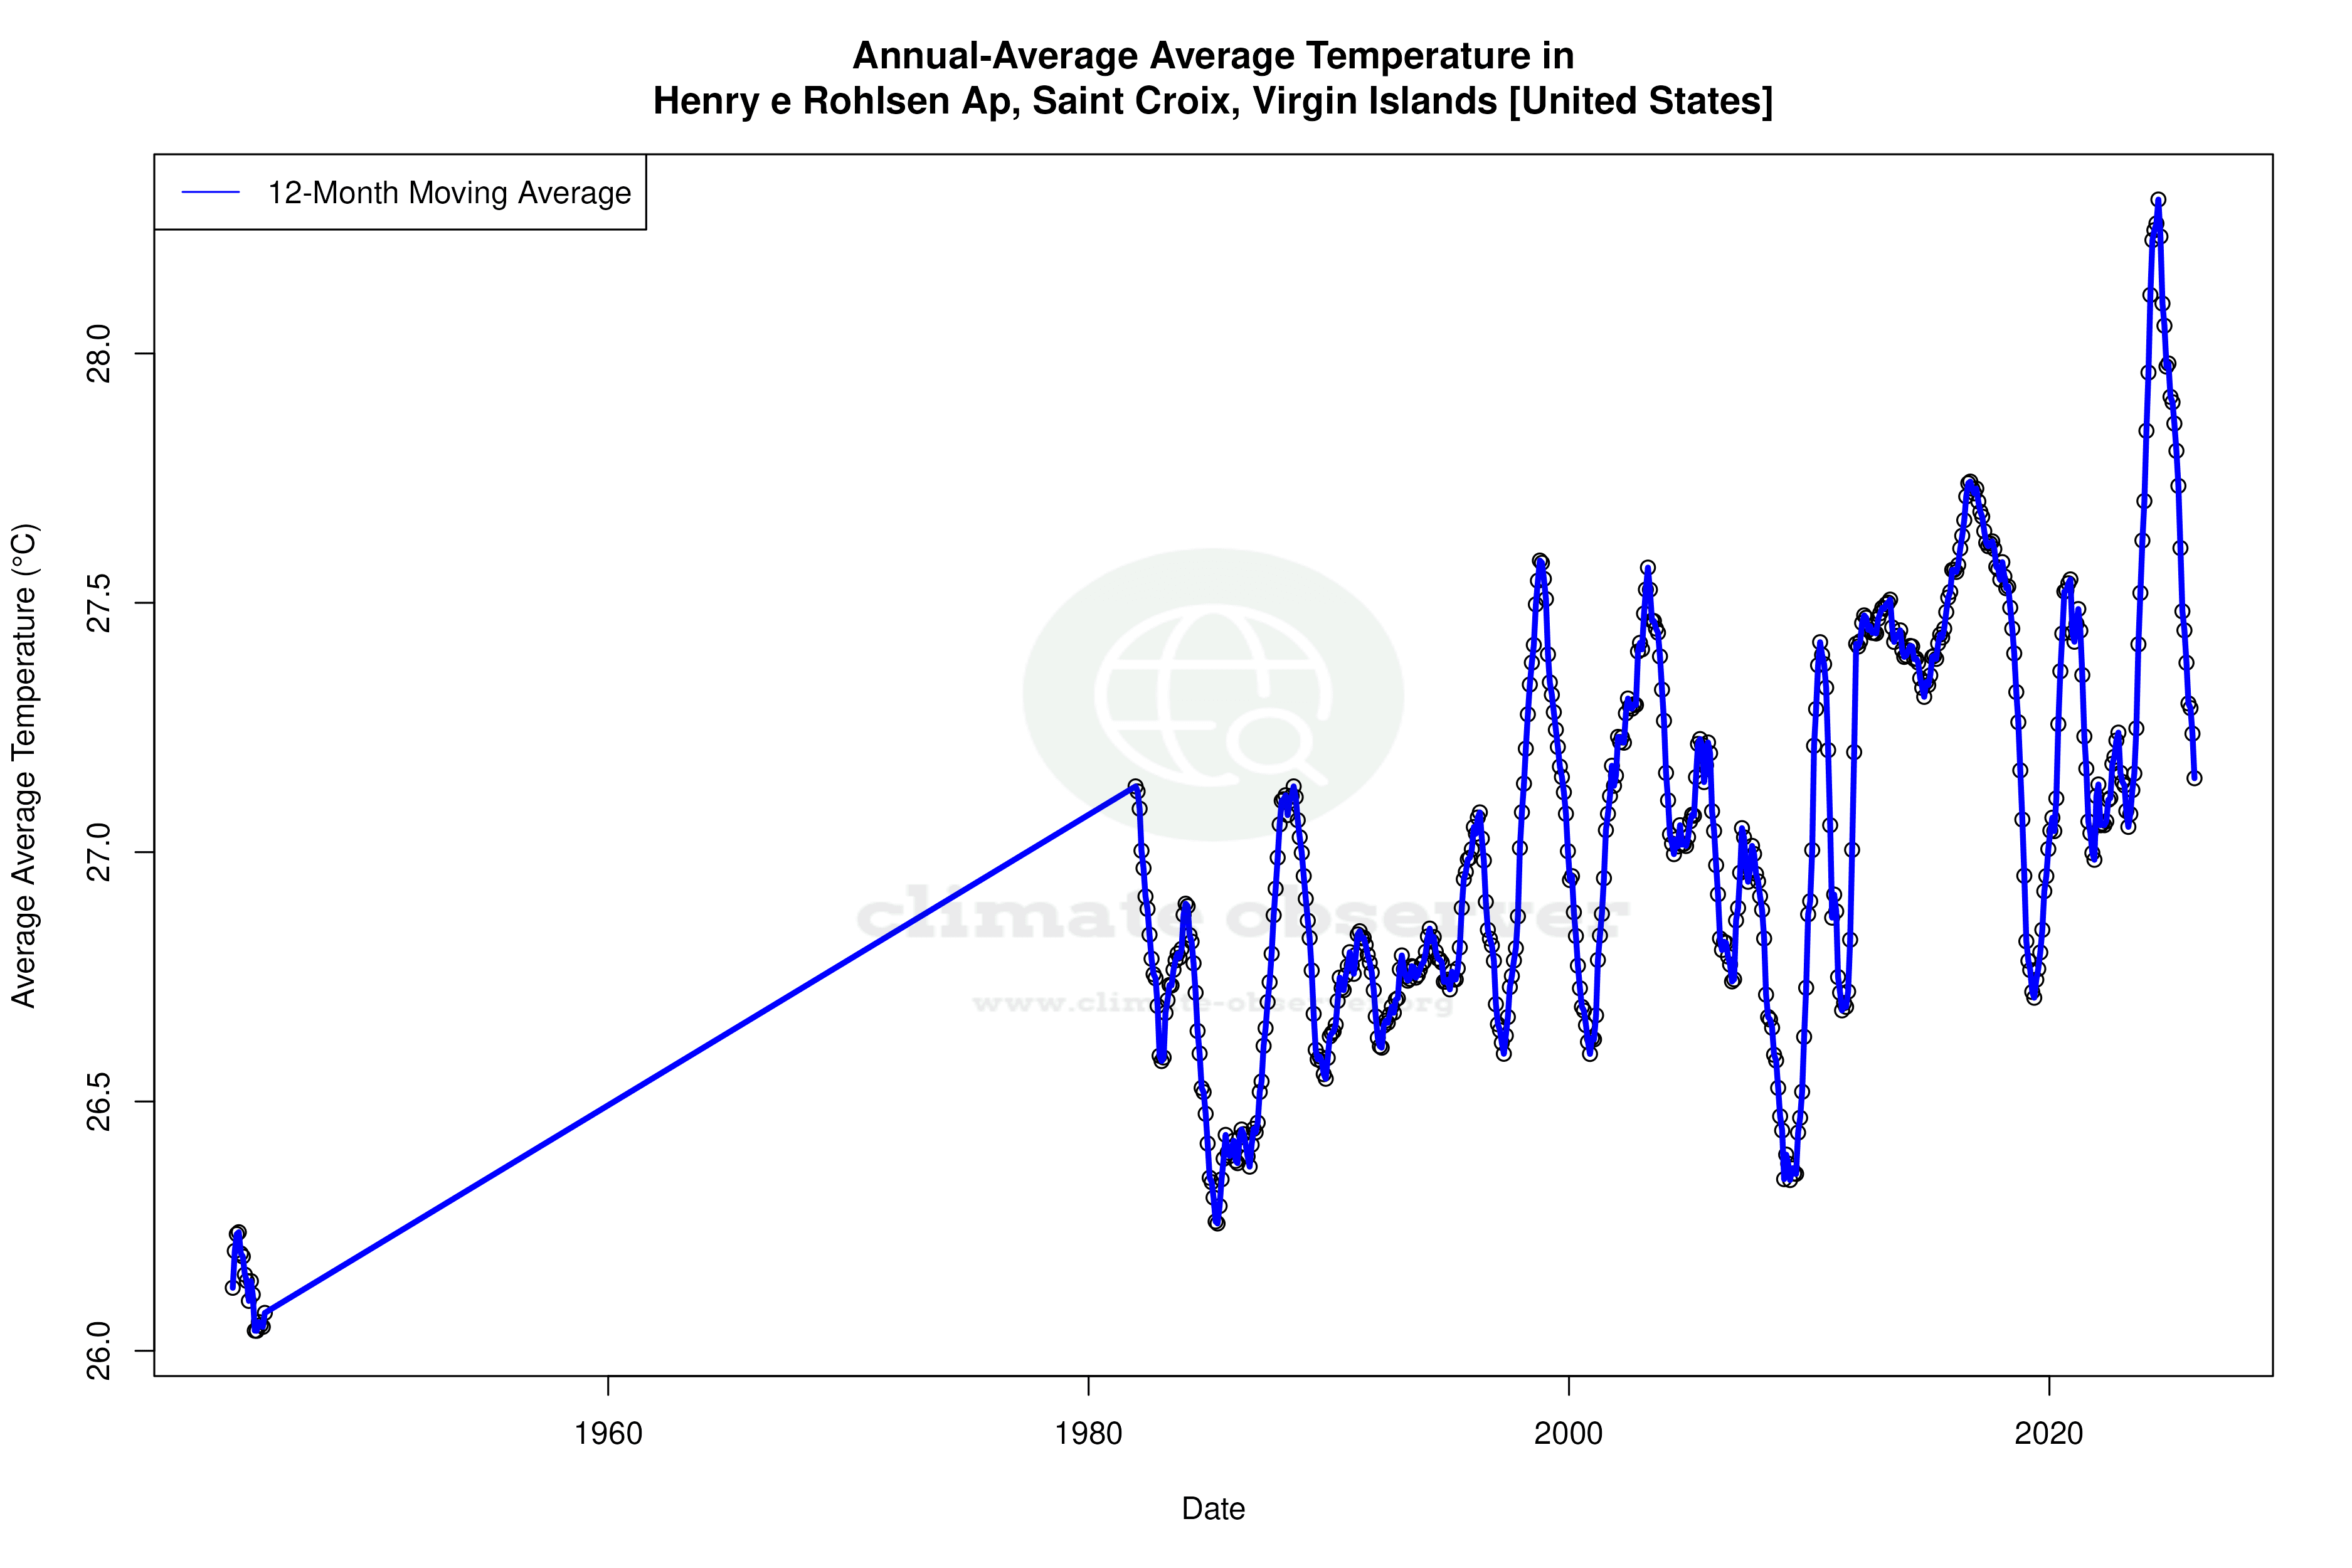
Situated at 17.6997°N, -64.8125°W, the Henry E Rohlsen Airport resides within a tropical climate zone, specifically classified as a tropical savanna climate (Aw) under the Köppen system. The geographical location, surrounded by the Caribbean Sea, plays a significant role in moderating temperature extremes and influencing local weather patterns. The all-time temperature trends indicate a warming of 0.12°C (0.22°F) for highs and 0.14°C (0.26°F) for lows. This gradual rise aligns with broader regional climate goals aimed at understanding and mitigating the impacts of climate change.
Decadal Temperature Trends
Over the past decade, the station has recorded a more pronounced warming, with high temperatures increasing by 0.81°C (1.46°F) and low temperatures by 0.69°C (1.24°F). These trends are more substantial than the all-time records, indicating a recent acceleration in warming. This could be attributed to a combination of global climate change influences and localised factors such as urbanisation and land-use changes.
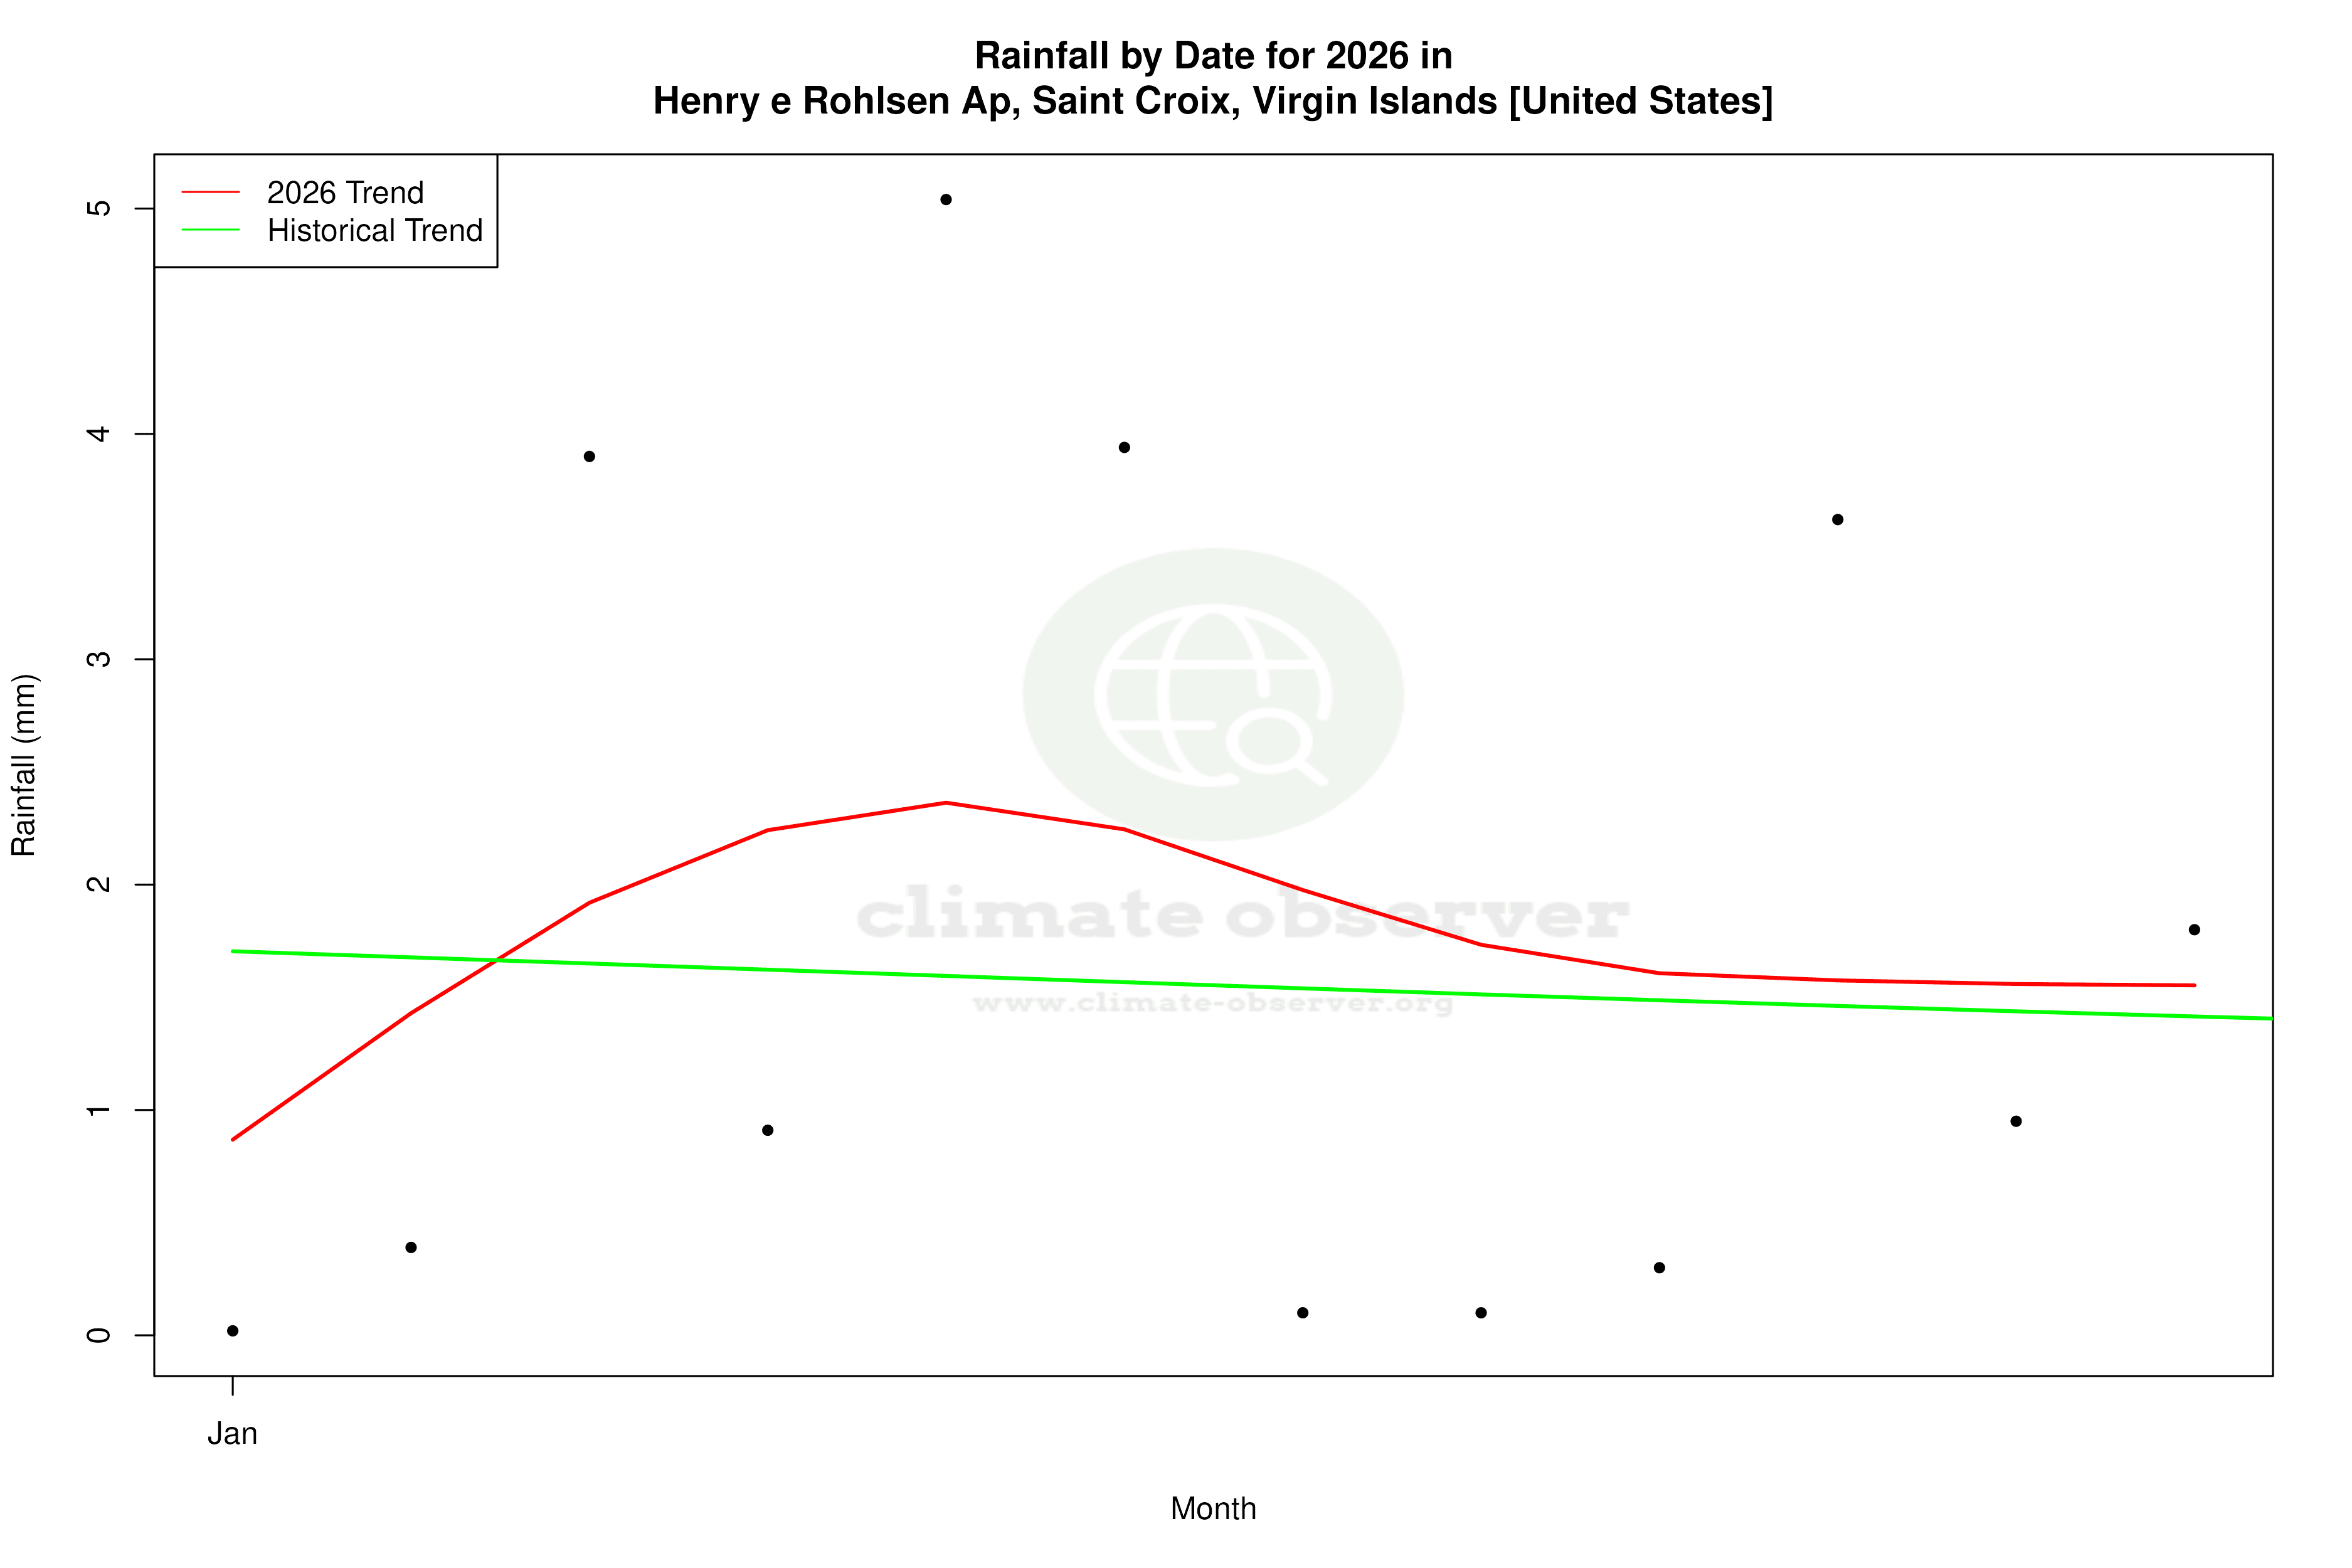
Precipitation Patterns
The Precipitation Concentration Index (PCI), a measure of how rainfall is distributed over time, has shown a slight decrease from a baseline of 12.81 to a current value of 11.67. This suggests that precipitation events are becoming slightly more evenly distributed throughout the year. While the change is marginal, it could have implications for water resource management and agricultural planning in the region.
Temperature Extremes
The station's temperature records reveal an absolute maximum of 36.7°C (98.1°F) and a minimum of 15.0°C (59.0°F). These extremes highlight the range of temperatures that can occur in this tropical environment, although such variations are moderated by the surrounding sea. The relatively stable all-time trends suggest that while extremes are possible, they are not becoming more frequent or severe at this time.
Regional Climate Implications
The warming trends observed at Henry E Rohlsen Airport are consistent with broader climate patterns across the Caribbean. The United States Virgin Islands have been actively working towards enhancing climate resilience, focusing on sustainable development and disaster preparedness. Recent weather events, such as hurricanes, underscore the importance of understanding these climatic changes to better prepare for future challenges.
Station Statistics
10-Year Trend
High: +0.81 °C/decade
Low: +0.70 °C/decade
Rain: +0.51 mm/decade
25-Year Trend
High: +0.60 °C/decade
Low: +0.22 °C/decade
Rain: +0.07 mm/decade
50-Year Trend
High: +0.34 °C/decade
Low: -0.03 °C/decade
Rain: -0.20 mm/decade
All-Time Trend
High: +0.11 °C/decade
Low: +0.15 °C/decade
Rain: -0.17 mm/decade
Percentage Above-Average Days
Last 12 Months: 64.4%
This Year: 82.5%
Precipitation Concentration Index (PCI) ℹ️
Last 12 Months: 10.5
Historical Average: 13.0
Percentile Rank of Last 12 Months ℹ️
High: 90th percentile
Low: 81st percentile
Rain: 52nd percentile
Change in Variance ℹ️
High: -25.4%
Low: -17.4%
Intraday: -56.7%
Data Coverage
74.9%
First Year of Data
1943
Station Location
Historical Weather Records
| Max High | Avg High | Min High | Max Avg | Avg Avg | Min Avg | Max Low | Avg Low | Min Low | Max Precipitation | Avg Precipitation | Max Snow | Avg Snow | |
|---|---|---|---|---|---|---|---|---|---|---|---|---|---|
| Record | 36.7 °C | — | 23.3 °C | 31.5 °C | — | 21.7 °C | 32.2 °C | — | 15.0 °C | 435.6 mm | — | 0.0 mm | — |
| January | 33.3 °C | 28.7 °C | 23.3 °C | 28.3 °C | 25.6 °C | 22.4 °C | 27.8 °C | 22.2 °C | 15.0 °C | 113.0 mm | 1.4 mm | 0.0 mm | 0.0 mm |
| February | 33.9 °C | 28.8 °C | 24.4 °C | 29.1 °C | 25.5 °C | 22.6 °C | 27.2 °C | 22.3 °C | 16.1 °C | 62.0 mm | 1.3 mm | 0.0 mm | 0.0 mm |
| March | 33.3 °C | 29.1 °C | 24.4 °C | 28.6 °C | 25.6 °C | 23.3 °C | 27.2 °C | 22.4 °C | 15.6 °C | 36.3 mm | 1.1 mm | 0.0 mm | 0.0 mm |
| April | 33.9 °C | 29.6 °C | 24.1 °C | 28.9 °C | 26.3 °C | 22.7 °C | 30.0 °C | 23.4 °C | 16.7 °C | 46.2 mm | 1.6 mm | 0.0 mm | 0.0 mm |
| May | 34.4 °C | 30.2 °C | 25.6 °C | 29.7 °C | 27.1 °C | 22.9 °C | 28.3 °C | 24.4 °C | 16.7 °C | 74.9 mm | 2.6 mm | 0.0 mm | 0.0 mm |
| June | 36.1 °C | 31.1 °C | 26.1 °C | 30.4 °C | 27.9 °C | 22.8 °C | 30.0 °C | 25.4 °C | 16.7 °C | 87.9 mm | 2.0 mm | 0.0 mm | 0.0 mm |
| July | 34.4 °C | 31.4 °C | 26.2 °C | 30.4 °C | 28.1 °C | 25.9 °C | 31.1 °C | 25.5 °C | 19.4 °C | 96.3 mm | 2.5 mm | 0.0 mm | 0.0 mm |
| August | 35.6 °C | 31.6 °C | 27.1 °C | 31.0 °C | 28.3 °C | 25.8 °C | 30.6 °C | 25.5 °C | 18.9 °C | 227.3 mm | 3.2 mm | 0.0 mm | 0.0 mm |
| September | 36.1 °C | 31.3 °C | 25.6 °C | 31.5 °C | 28.2 °C | 24.4 °C | 29.4 °C | 25.1 °C | 17.2 °C | 435.6 mm | 4.1 mm | 0.0 mm | 0.0 mm |
| October | 36.7 °C | 30.9 °C | 25.6 °C | 30.6 °C | 27.9 °C | 24.5 °C | 28.9 °C | 24.7 °C | 18.3 °C | 255.0 mm | 3.8 mm | 0.0 mm | 0.0 mm |
| November | 33.9 °C | 30.1 °C | 25.0 °C | 29.8 °C | 27.1 °C | 22.6 °C | 28.9 °C | 23.9 °C | 16.1 °C | 113.8 mm | 3.6 mm | 0.0 mm | 0.0 mm |
| December | 33.3 °C | 29.2 °C | 24.4 °C | 28.5 °C | 26.2 °C | 21.7 °C | 32.2 °C | 22.9 °C | 16.1 °C | 205.0 mm | 2.2 mm | 0.0 mm | 0.0 mm |
Data Visualisations
Remove WatermarksCurrent Year Climate Trends vs Historical
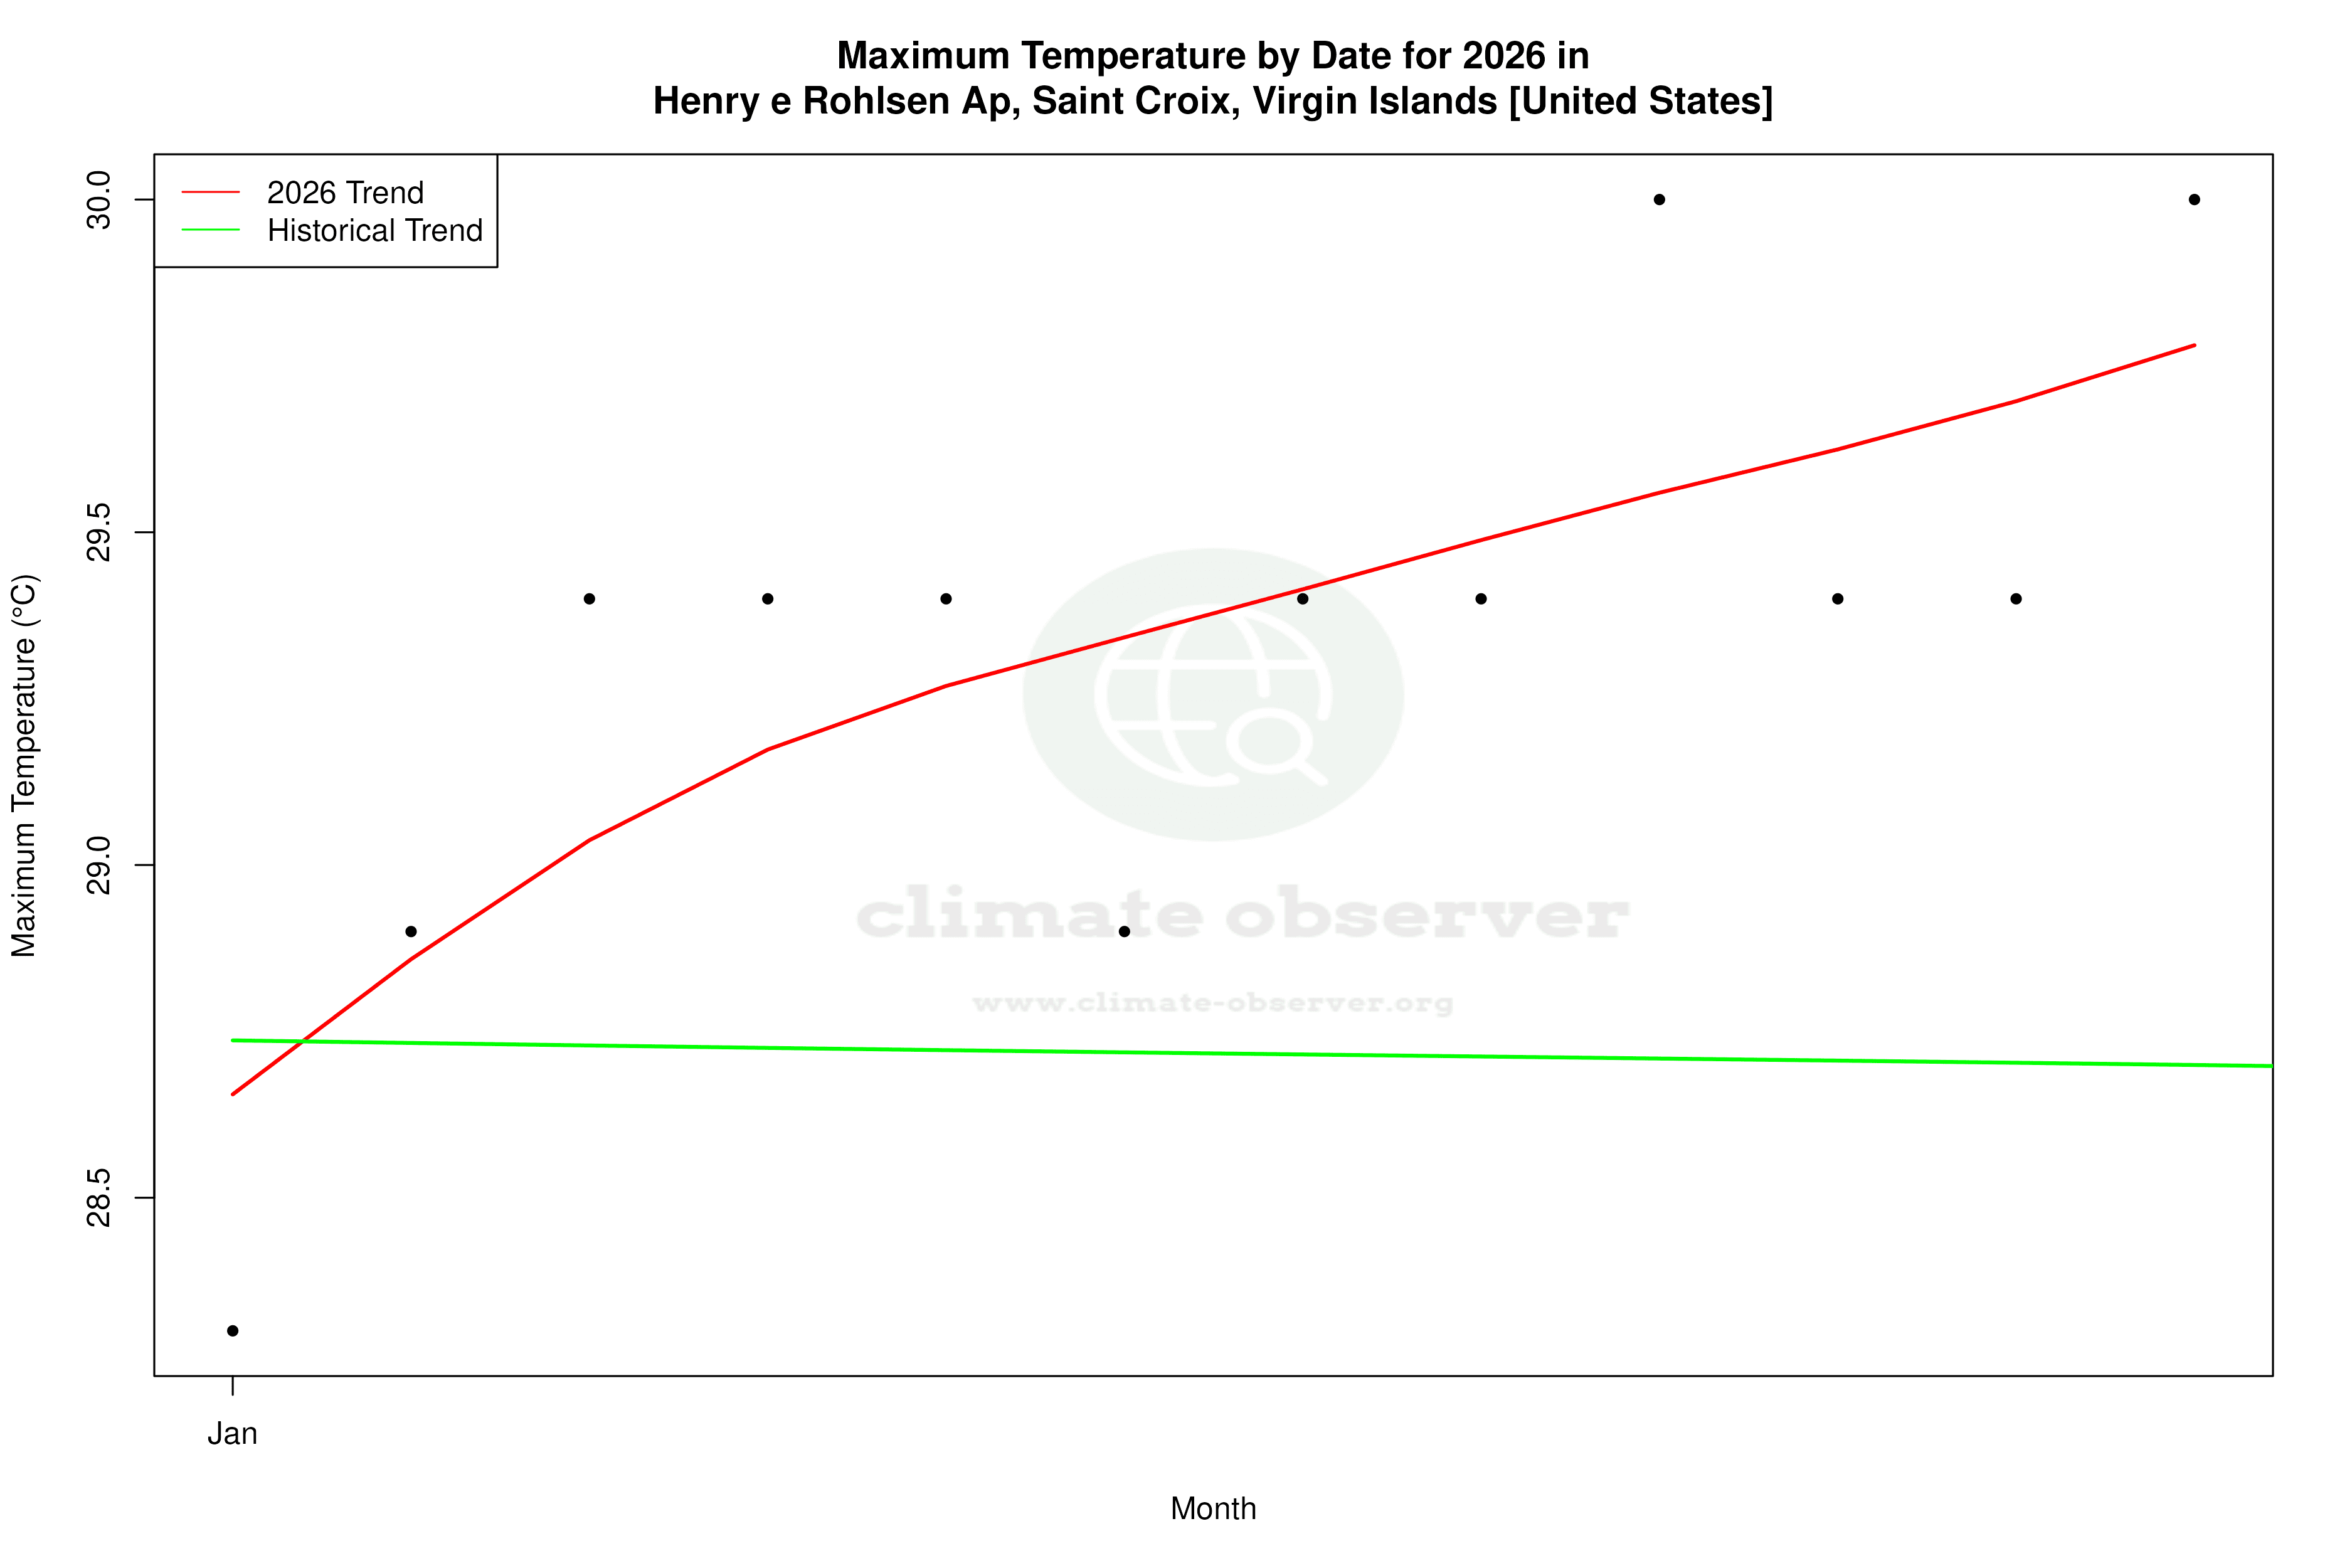


Max Temperature this Year | 1 of 6
Climate 12-Month Moving Averages


Max Temperature 12-Month MA | 1 of 6
Daily Data Points and Averages Throughout the Year


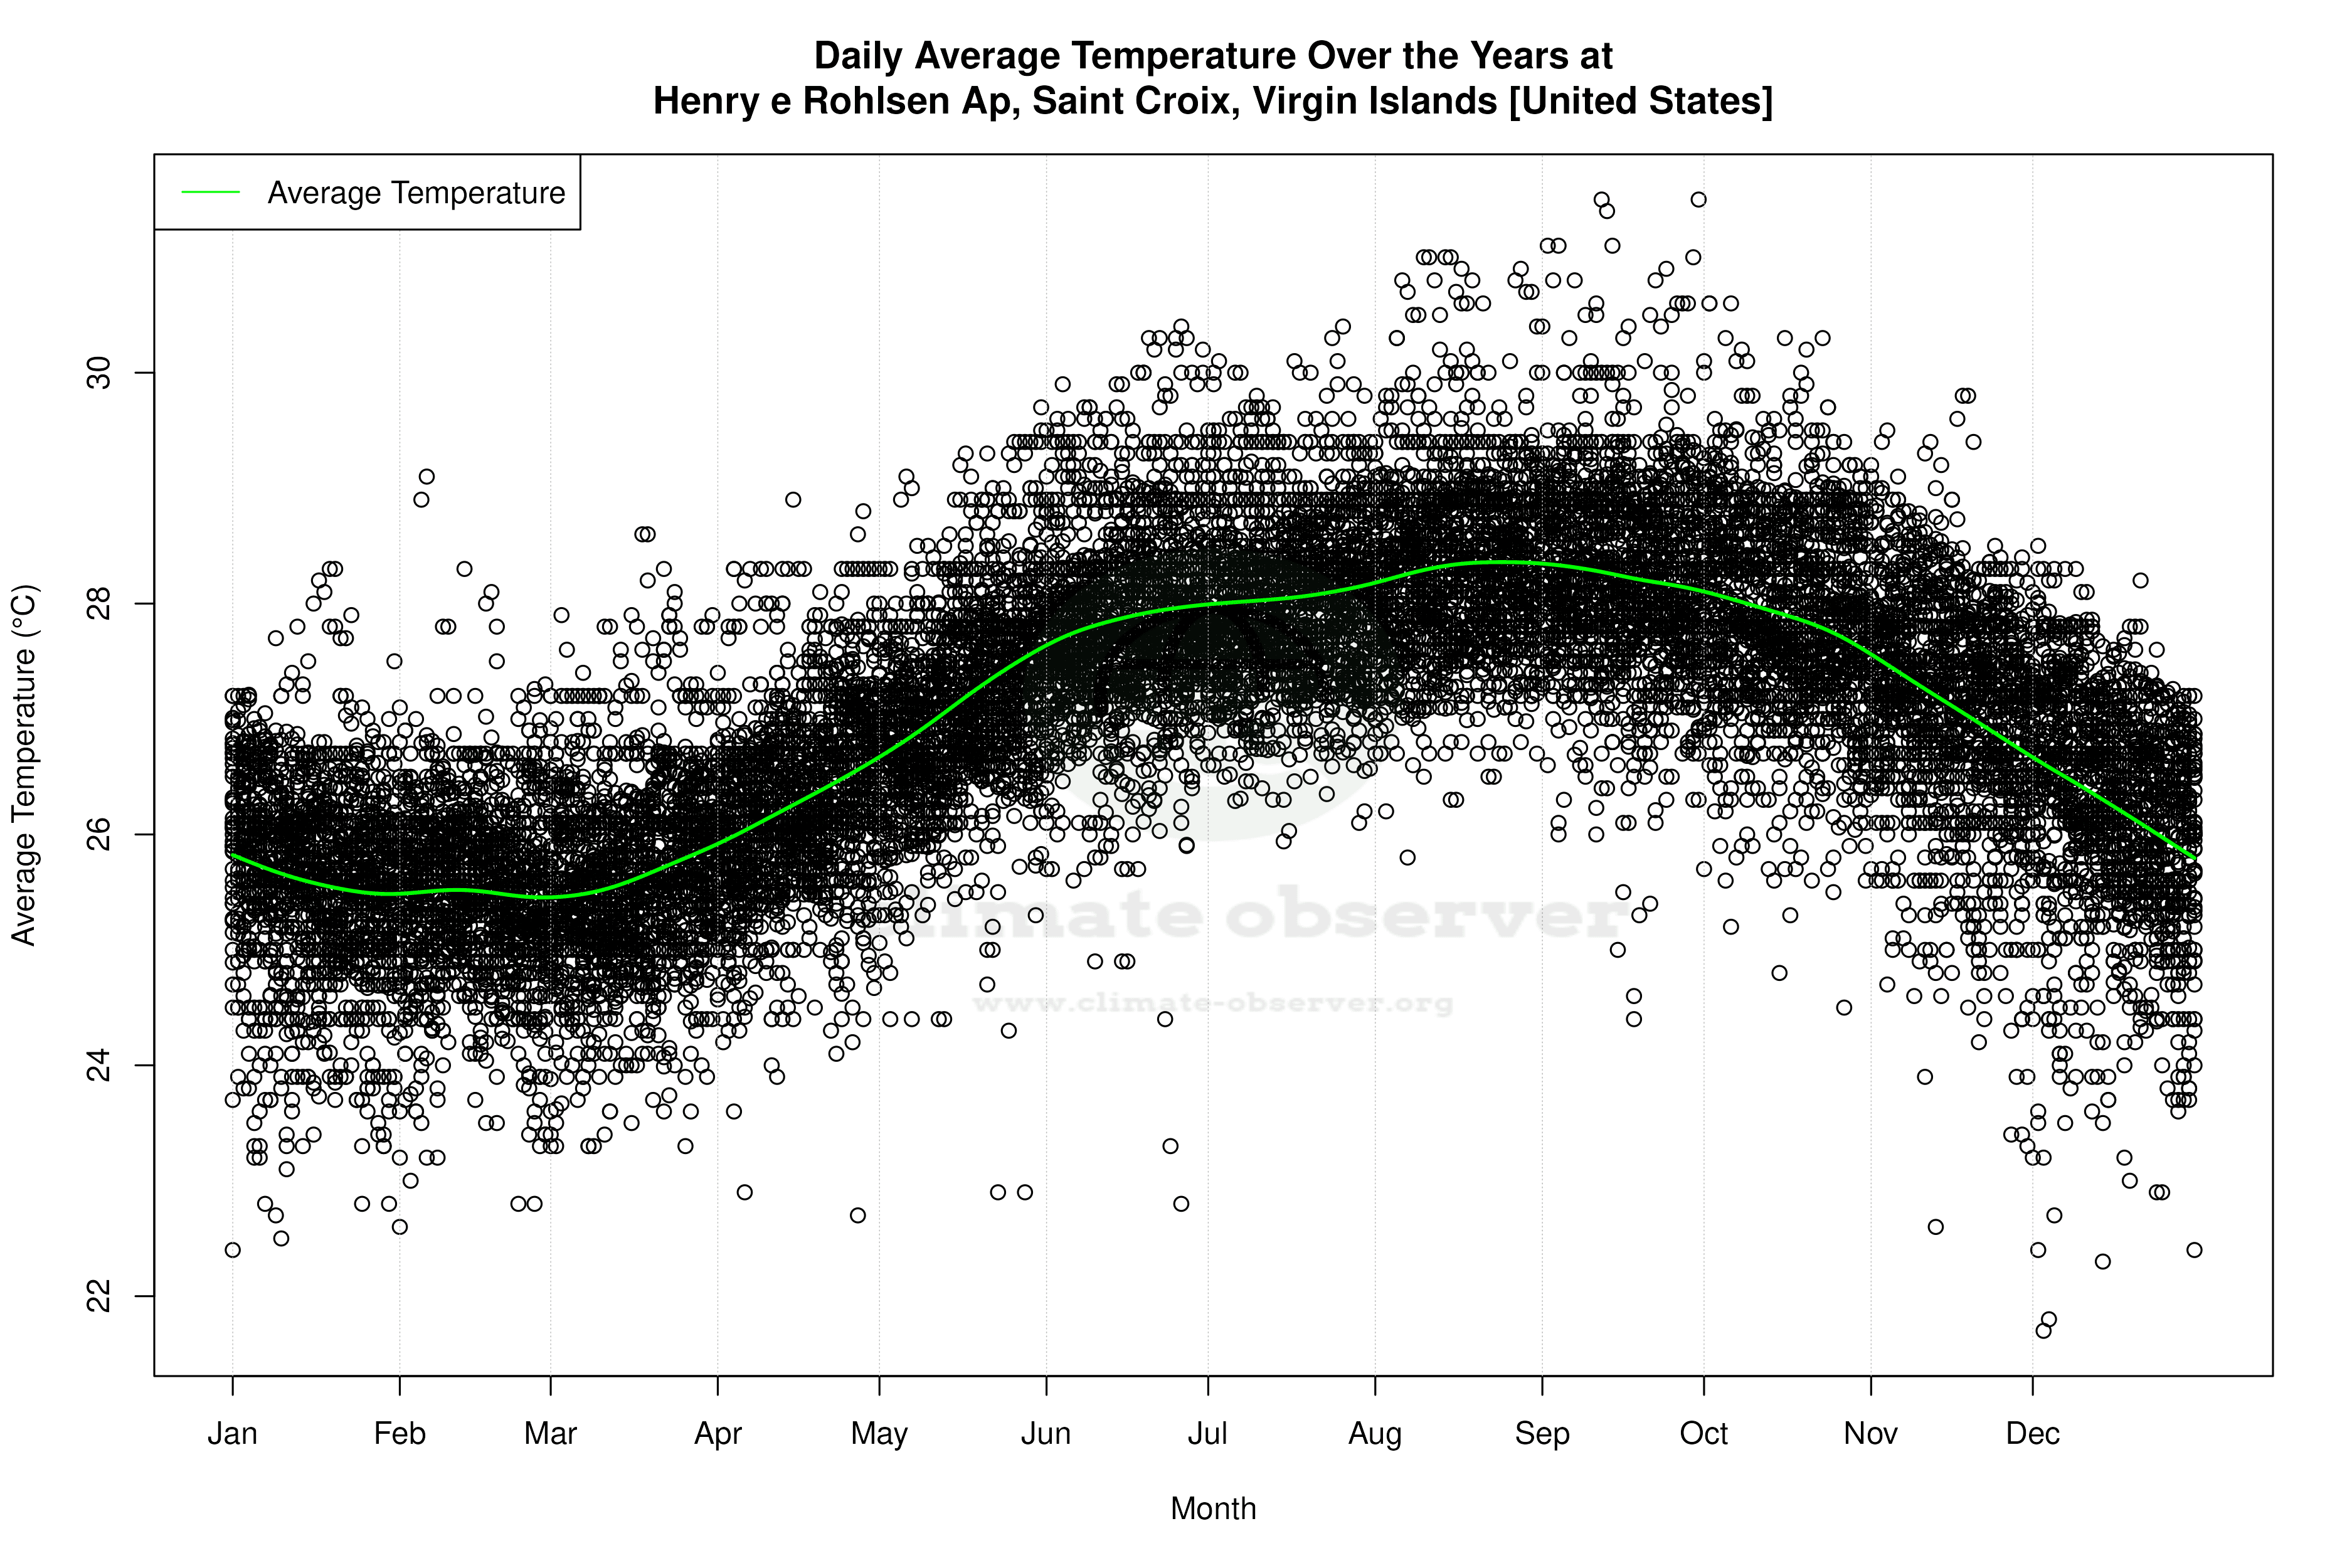


Average Max Temperature Throughout Year | 1 of 5
