Climate for Station: J.g.h. Van Der Wath Airp, ǁKharas, Namibia
Loading live weather...
Climate Analysis & Overview
J.g.h. Van Der Wath Airport in Namibia's ǁKharas Region is experiencing a complex climate narrative. While long-term trends indicate a warming pattern, recent years show a counterintuitive cooling of high temperatures. Precipitation patterns have become more evenly distributed, suggesting shifts in local weather dynamics.
Climate Classification and Geographic Influence
J.g.h. Van Der Wath Airport is situated in the arid ǁKharas Region of Namibia, characterised by a BWh climate under the Köppen classification, denoting a desert climate with minimal rainfall. The region's geography, predominantly flat with sporadic mountain ranges, plays a crucial role in its climatic conditions. The absence of significant water bodies or coastal influences results in extreme temperature variations, which are evident in the station's all-time temperature records, with a maximum of 42.8°C (109.0°F) and a minimum of -3.5°C (25.7°F).
Temperature Trends: A Tale of Two Decades
Long-term data from J.g.h. Van Der Wath Airport indicates a warming trend with all-time high temperatures rising by 0.62°C (1.12°F) and lows by 0.29°C (0.52°F). However, the past decade presents a contrasting picture. High temperatures have shown a cooling trend of -1.27°C (-2.28°F), while low temperatures have continued to rise by 0.60°C (1.08°F). This divergence suggests a complex interplay of local and possibly global climatic factors, warranting further investigation.
Precipitation Patterns: From Concentration to Distribution
The Precipitation Concentration Index (PCI) is a measure of how rainfall is distributed throughout the year. A decrease from a baseline PCI of 26.9 to a current value of 16.3 indicates a significant shift towards more evenly distributed rainfall events. This change suggests that while the region remains arid, the nature of rainfall events has evolved, potentially affecting local agriculture and water resource management.
Regional Climate Goals and Implications
Namibia has been proactive in addressing climate change, with initiatives aimed at sustainable water management and renewable energy. The observed climatic shifts at J.g.h. Van Der Wath Airport align with broader regional goals of adapting to and mitigating the impacts of climate change. The more evenly distributed precipitation could aid in water conservation efforts, while the cooling of recent high temperatures might offer temporary relief to the region's ecosystems and inhabitants.
Complex Climate Dynamics
The juxtaposition of long-term warming trends with recent cooling in high temperatures at J.g.h. Van Der Wath Airport exemplifies the complexity of climate dynamics in the ǁKharas Region. These trends, coupled with changes in precipitation distribution, underscore the need for ongoing monitoring and research to inform adaptive strategies in the face of evolving climatic conditions.
Station Statistics
10-Year Trend
High: -1.54 °C/decade
Low: +0.59 °C/decade
Rain: +0.06 mm/decade
25-Year Trend
High: +0.55 °C/decade
Low: +0.62 °C/decade
Rain: -0.05 mm/decade
50-Year Trend
High: +0.64 °C/decade
Low: +0.33 °C/decade
Rain: +0.02 mm/decade
All-Time Trend
High: +0.61 °C/decade
Low: +0.29 °C/decade
Rain: -0.00 mm/decade
Percentage Above-Average Days
Last 12 Months: 54.0%
This Year: 53.5%
Precipitation Concentration Index (PCI) ℹ️
Last 12 Months: 16.0
Historical Average: 28.1
Percentile Rank of Last 12 Months ℹ️
High: 66th percentile
Low: 95th percentile
Rain: 71st percentile
Change in Variance ℹ️
High: -5.6%
Low: -2.5%
Intraday: -9.5%
Data Coverage
79.1%
First Year of Data
1949
Station Location
Historical Weather Records
| Max High | Avg High | Min High | Max Avg | Avg Avg | Min Avg | Max Low | Avg Low | Min Low | Max Precipitation | Avg Precipitation | Max Snow | Avg Snow | |
|---|---|---|---|---|---|---|---|---|---|---|---|---|---|
| Record | 42.8 °C | — | 8.6 °C | 37.2 °C | — | 1.4 °C | 33.2 °C | — | -3.5 °C | 100.0 mm | — | — | — |
| January | 42.8 °C | 35.7 °C | 21.0 °C | 37.2 °C | 27.7 °C | 14.0 °C | 33.2 °C | 19.3 °C | 9.0 °C | 72.0 mm | 1.0 mm | — | — |
| February | 42.0 °C | 34.8 °C | 22.8 °C | 35.7 °C | 27.4 °C | 17.4 °C | 27.8 °C | 19.4 °C | 7.8 °C | 62.0 mm | 1.4 mm | — | — |
| March | 41.1 °C | 33.2 °C | 18.6 °C | 34.1 °C | 25.7 °C | 12.3 °C | 27.0 °C | 18.0 °C | 3.5 °C | 57.0 mm | 1.1 mm | — | — |
| April | 37.6 °C | 29.5 °C | 12.8 °C | 33.4 °C | 22.3 °C | 9.8 °C | 24.0 °C | 14.7 °C | 3.0 °C | 52.0 mm | 0.6 mm | — | — |
| May | 35.8 °C | 26.0 °C | 12.6 °C | 31.0 °C | 18.7 °C | 7.9 °C | 22.0 °C | 10.8 °C | 0.0 °C | 38.9 mm | 0.1 mm | — | — |
| June | 31.6 °C | 22.4 °C | 8.8 °C | 27.9 °C | 14.8 °C | 1.4 °C | 17.4 °C | 7.2 °C | -3.5 °C | 14.0 mm | 0.1 mm | — | — |
| July | 30.8 °C | 22.1 °C | 9.6 °C | 23.7 °C | 14.4 °C | 3.2 °C | 18.5 °C | 6.6 °C | -2.8 °C | 5.2 mm | 0.0 mm | — | — |
| August | 34.6 °C | 24.3 °C | 8.6 °C | 29.6 °C | 16.1 °C | 2.4 °C | 20.0 °C | 7.7 °C | -2.8 °C | 10.0 mm | 0.0 mm | — | — |
| September | 39.0 °C | 28.1 °C | 11.8 °C | 32.3 °C | 19.8 °C | 6.0 °C | 24.0 °C | 10.8 °C | -1.6 °C | 73.5 mm | 0.1 mm | — | — |
| October | 40.7 °C | 31.3 °C | 12.5 °C | 34.8 °C | 23.1 °C | 7.1 °C | 25.6 °C | 14.0 °C | 1.1 °C | 28.0 mm | 0.1 mm | — | — |
| November | 42.7 °C | 33.5 °C | 15.0 °C | 36.1 °C | 25.3 °C | 12.5 °C | 27.4 °C | 16.0 °C | 3.5 °C | 74.3 mm | 0.3 mm | — | — |
| December | 42.8 °C | 35.4 °C | 22.7 °C | 36.3 °C | 27.0 °C | 14.9 °C | 28.4 °C | 17.9 °C | 0.0 °C | 100.0 mm | 0.4 mm | — | — |
Data Visualisations
Remove WatermarksCurrent Year Climate Trends vs Historical


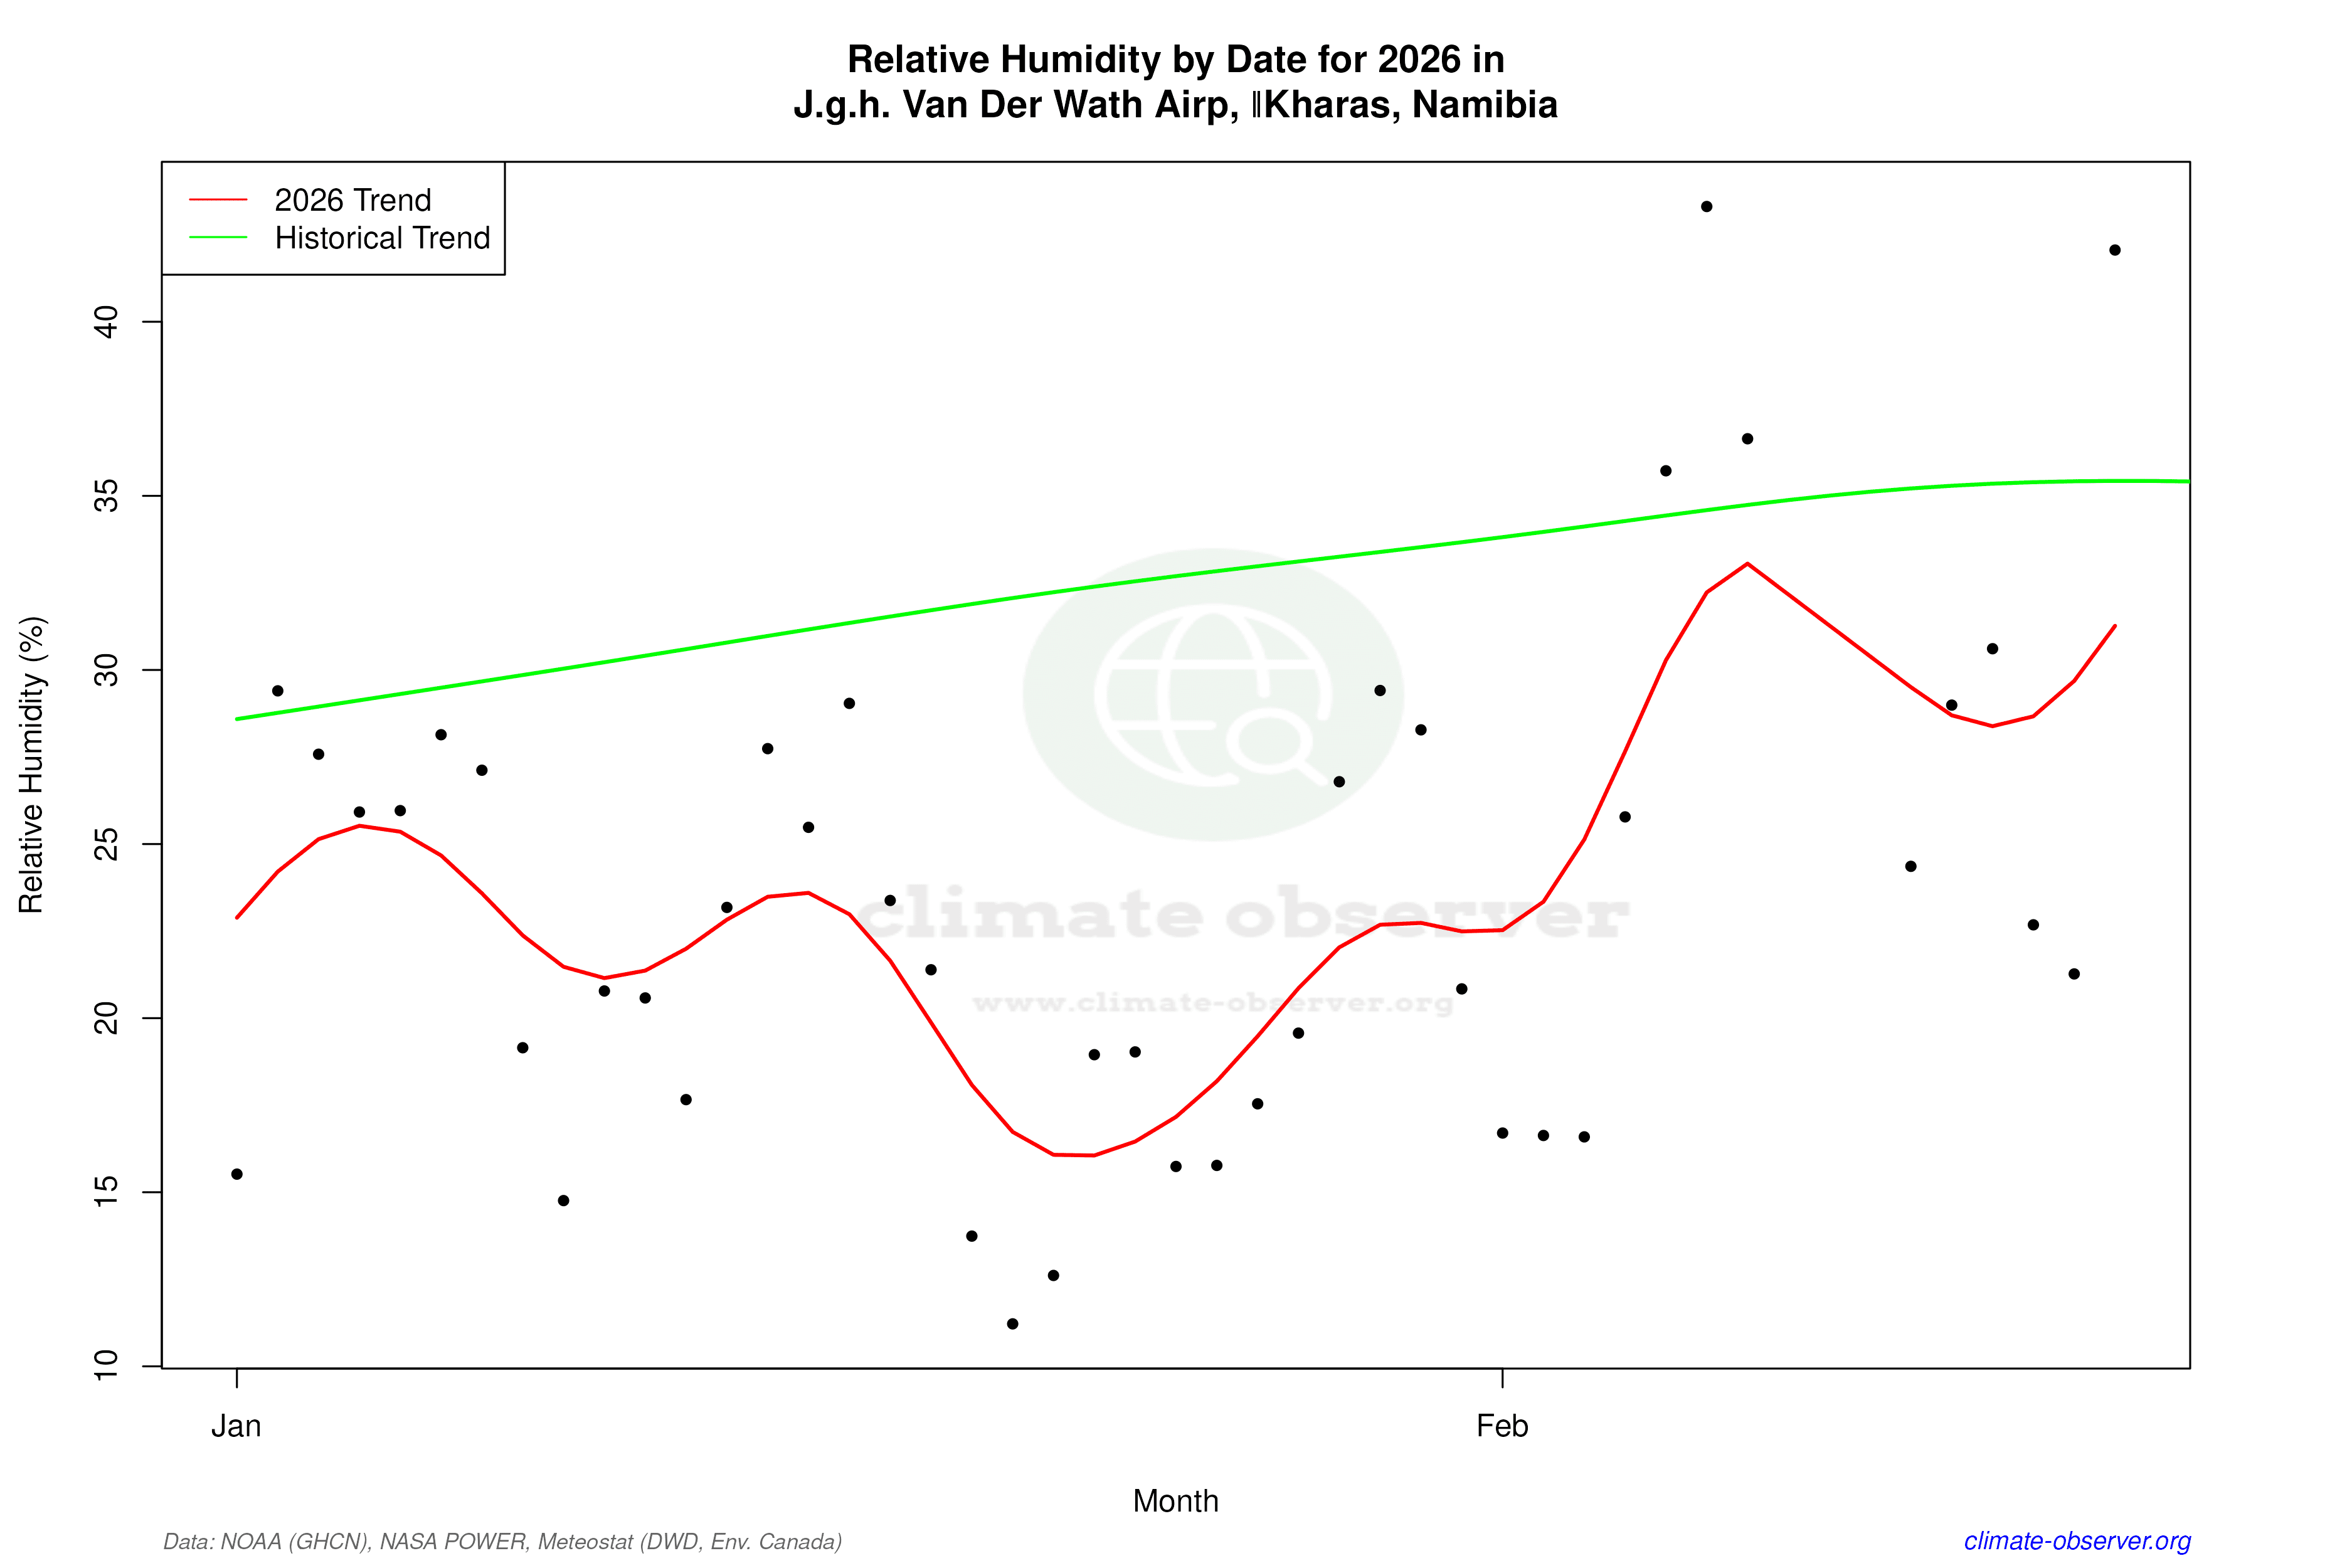

Max Temperature this Year | 1 of 6
Climate 12-Month Moving Averages


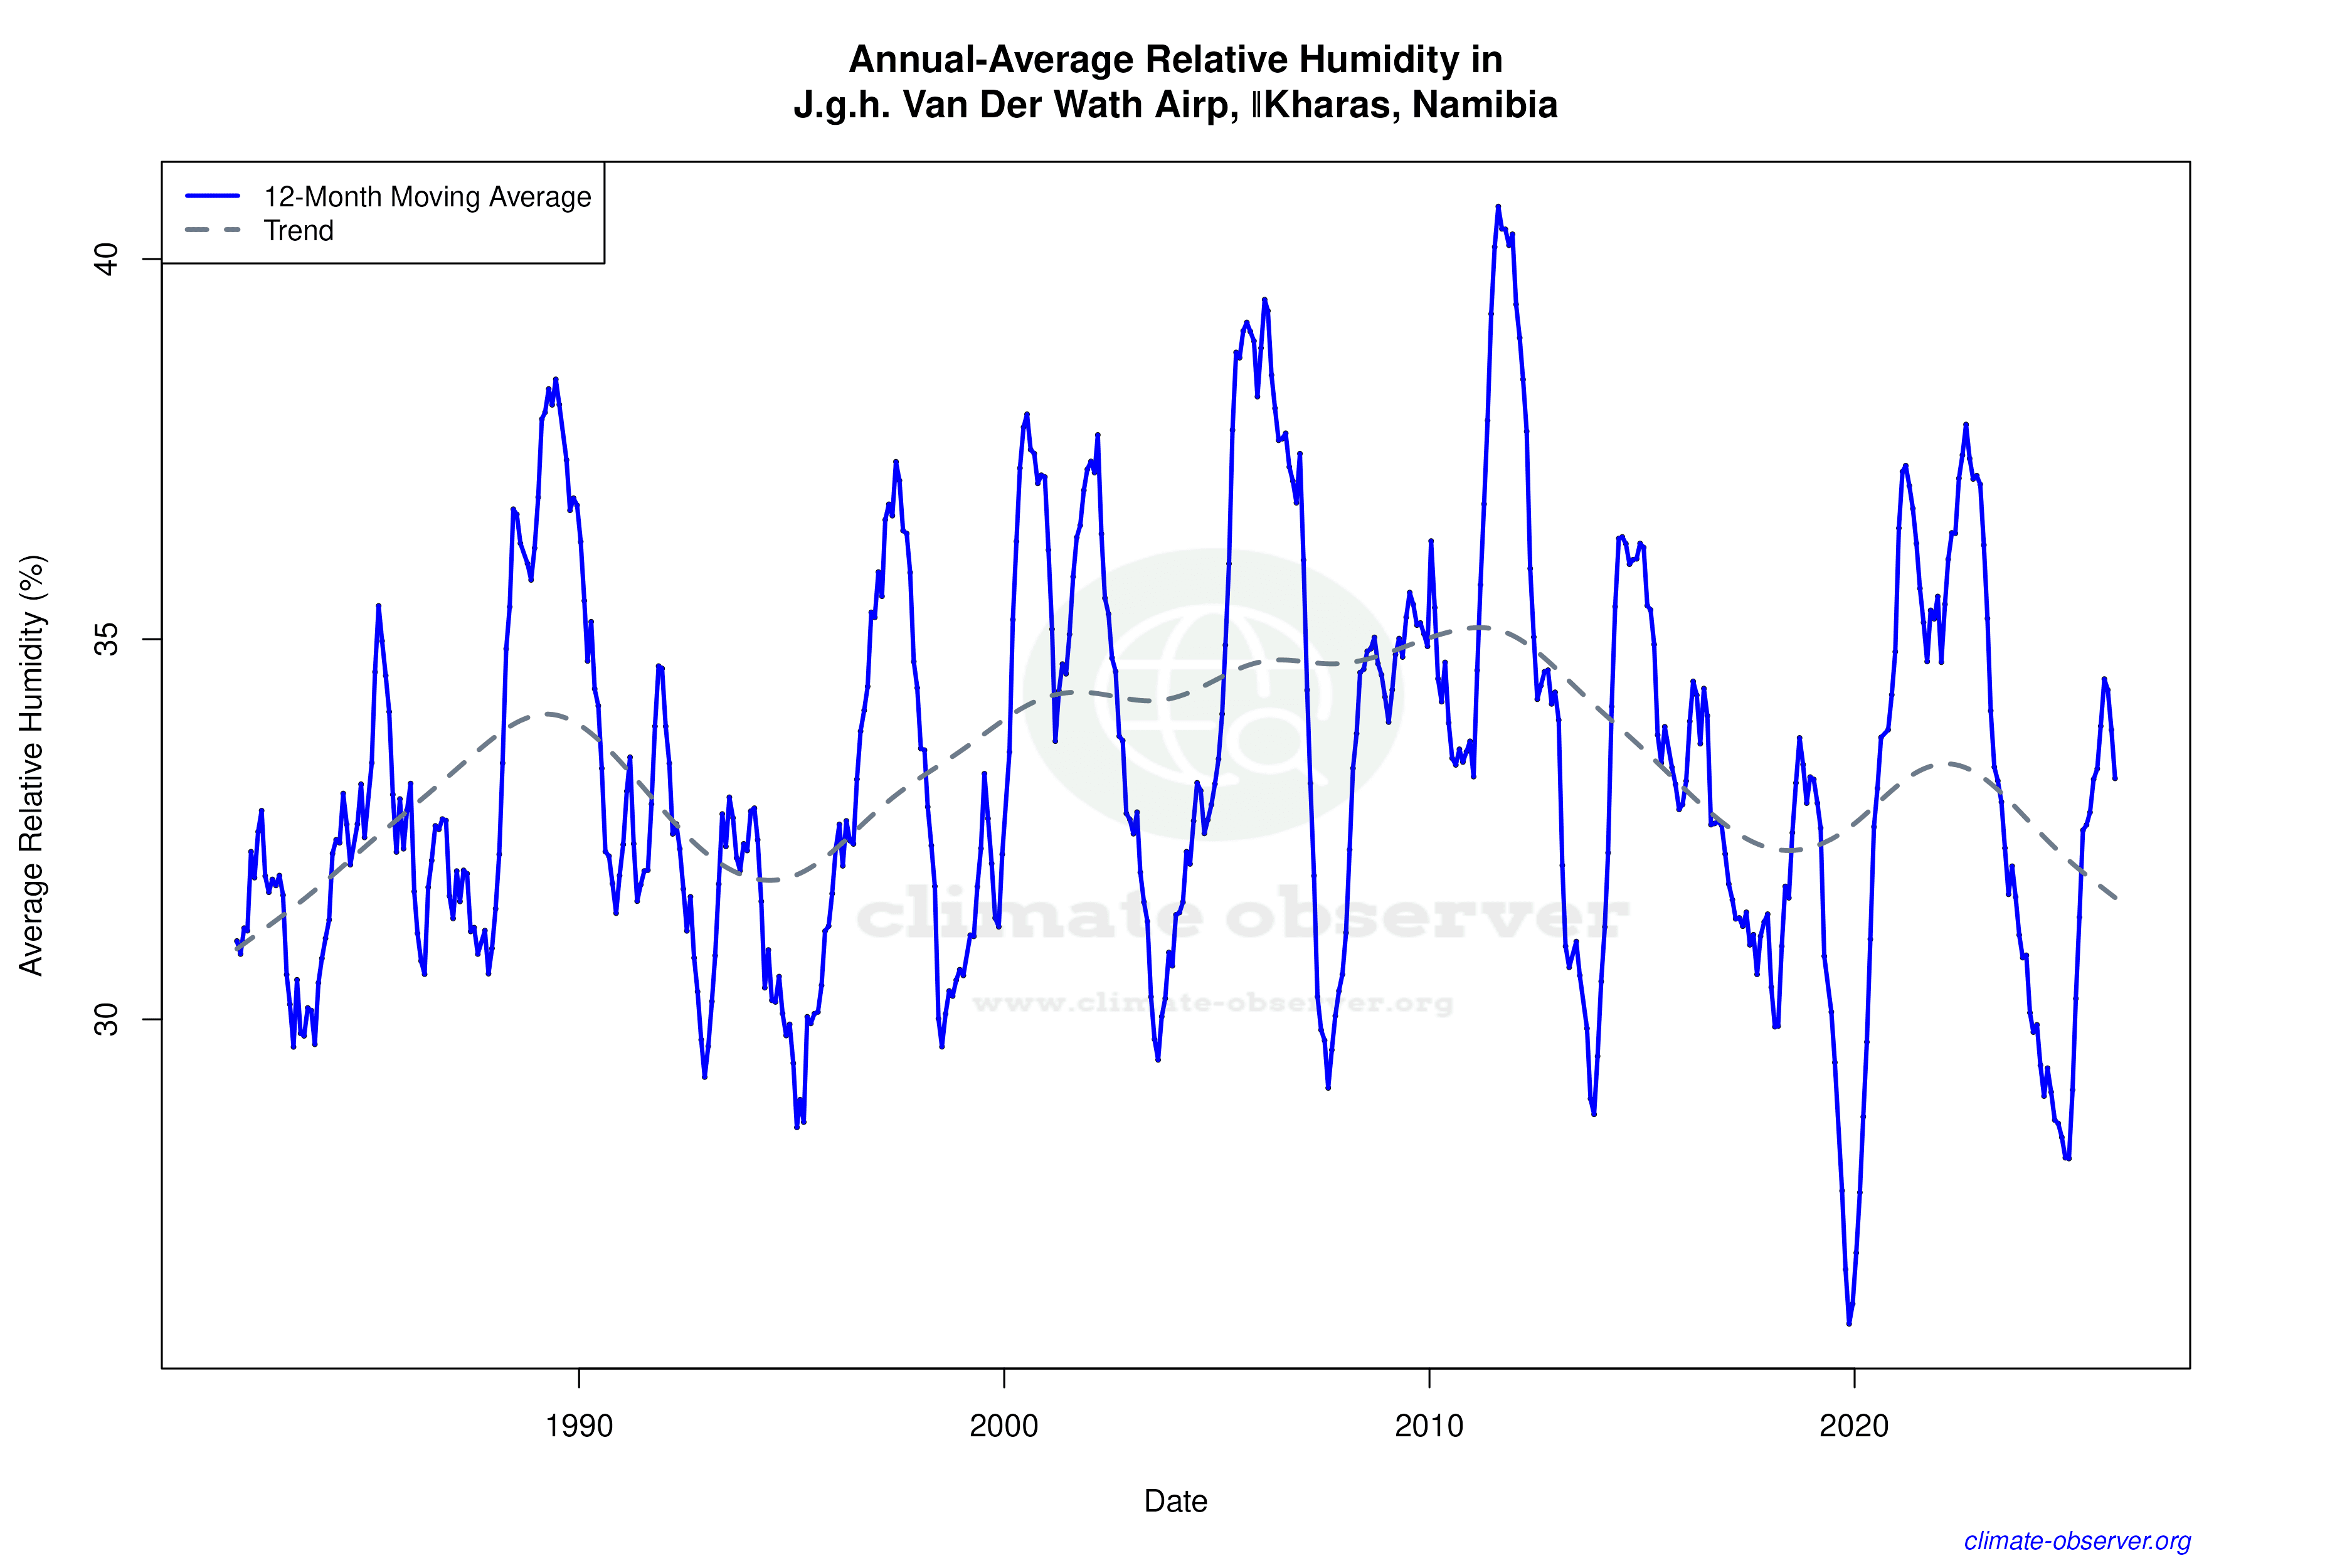

Max Temperature 12-Month MA | 1 of 6
Daily Data Points and Averages Throughout the Year

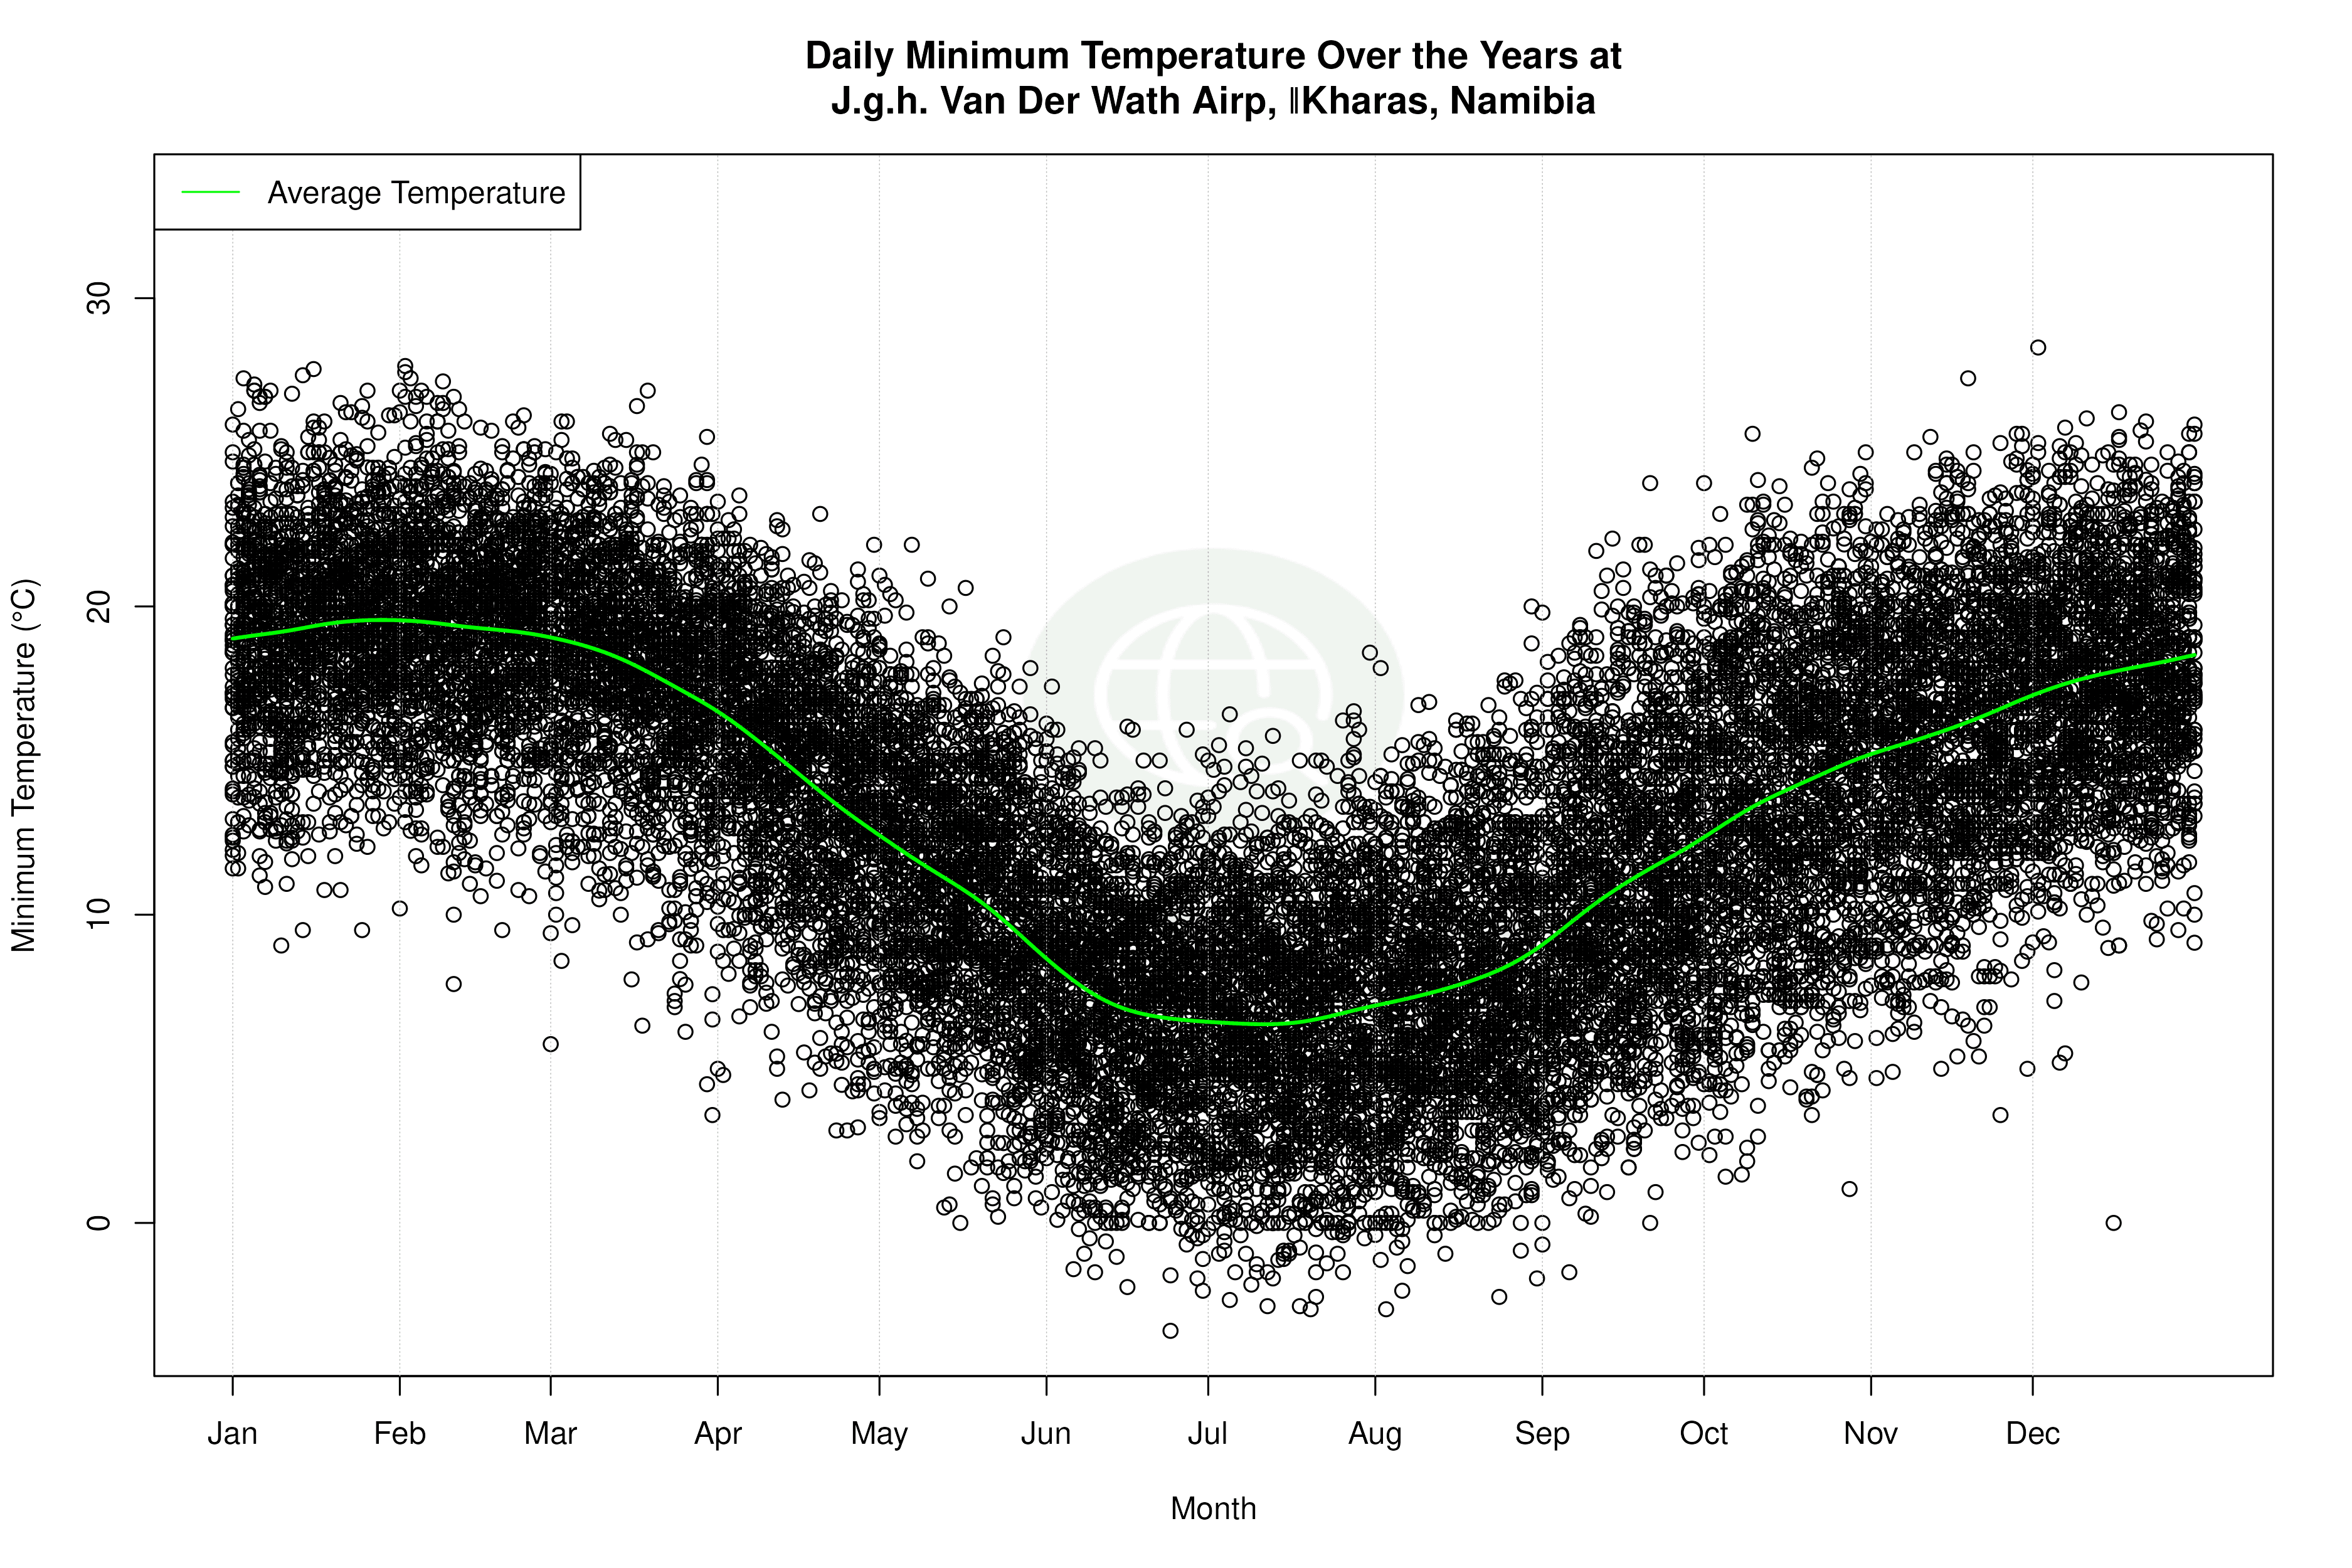


Average Max Temperature Throughout Year | 1 of 5
