Climate for Station: Hihifo (Ile Wallis), Wallis, Wallis and Futuna [France]
Loading live weather...
Climate Analysis & Overview
Hihifo, located on Ile Wallis, is experiencing a complex climate narrative with a notable warming trend in low temperatures over the past decade, contrasted by a slight cooling in high temperatures. Precipitation is becoming more evenly distributed, indicating a shift in rainfall patterns that could impact local ecosystems and water resources.
Tropical Maritime Climate Dynamics
Hihifo, situated at the coordinates -13.233, -176.167, falls under the tropical rainforest climate classification (Af) according to the Köppen system. This classification is characterised by high humidity and significant rainfall throughout the year, typical of maritime climates influenced by surrounding oceanic conditions. The geographical setting of Ile Wallis, with its coastal proximity, plays a pivotal role in moderating temperature fluctuations and enhancing rainfall distribution.
Temperature Trends: A Tale of Two Extremes
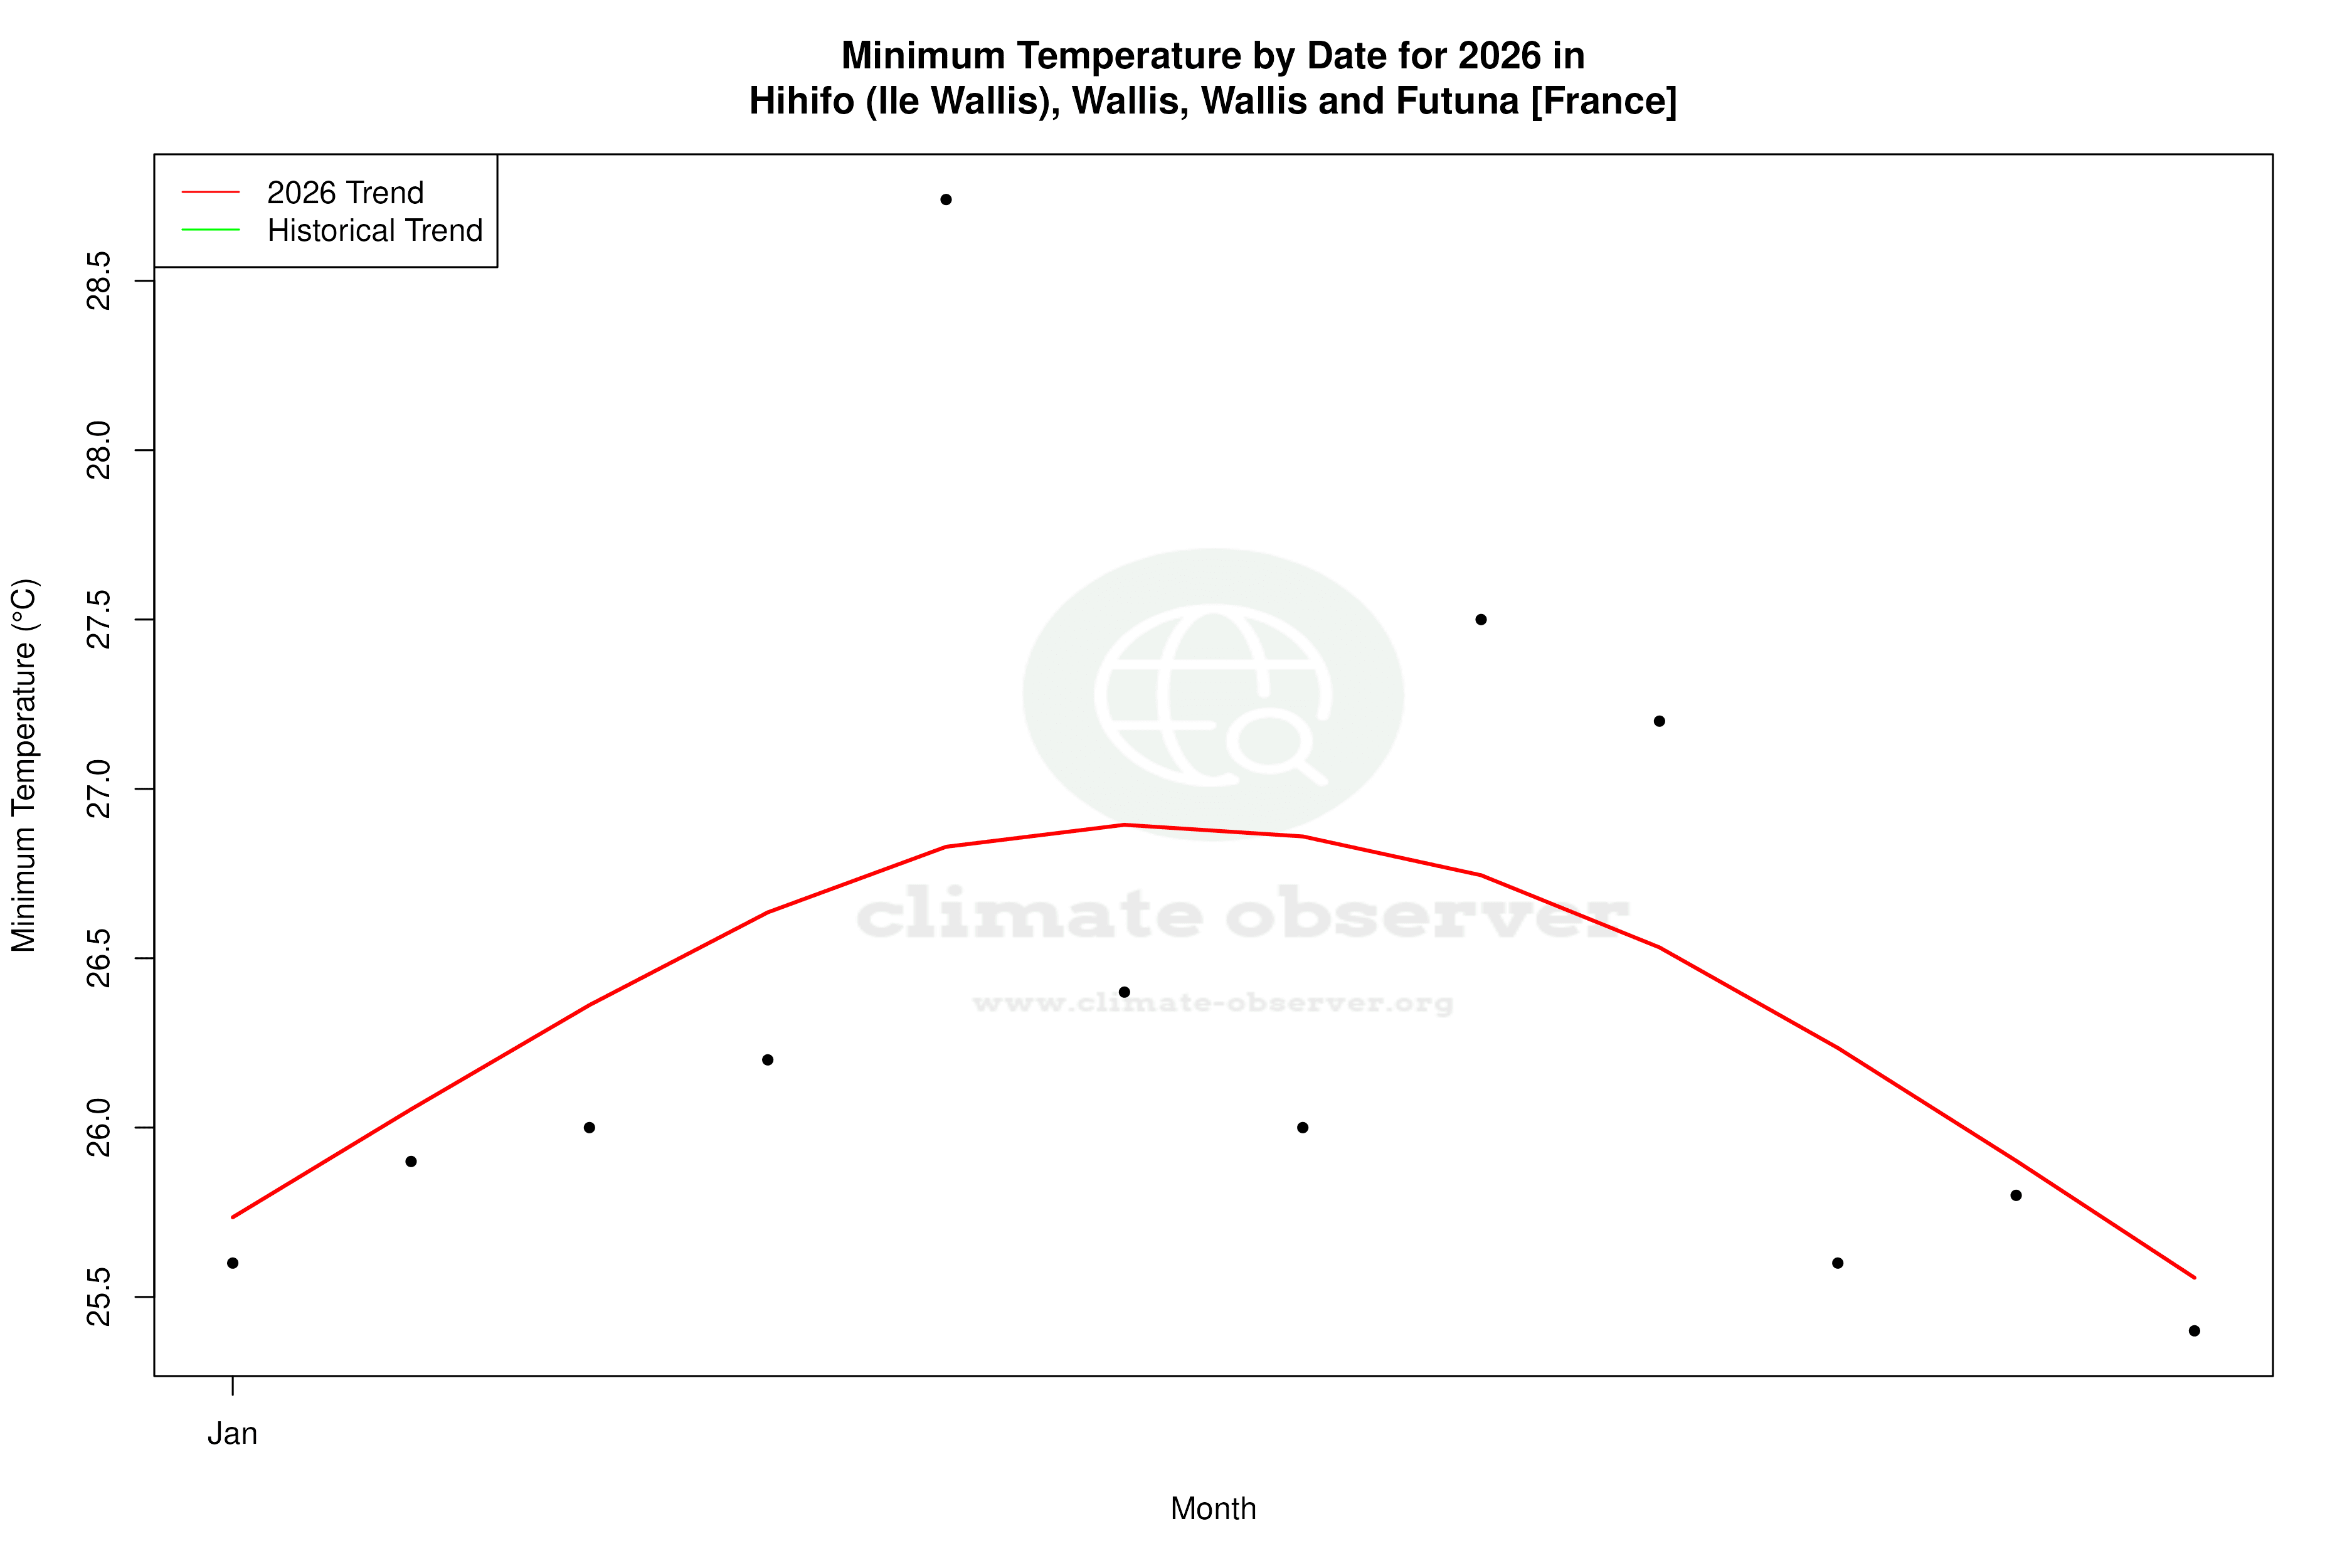
Over the past decade, Hihifo has witnessed a dichotomy in temperature trends. High temperatures have shown a slight cooling trend of -0.05°C (-0.09°F), while low temperatures have risen by 0.27°C (0.49°F). This divergence suggests a narrowing of the daily temperature range, potentially affecting local biodiversity and agricultural cycles. When considering the all-time data, both high and low temperatures have risen, with highs increasing by 0.18°C (0.32°F) and lows by 0.27°C (0.48°F). This overall warming trend aligns with broader regional climate patterns observed across Wallis and Futuna.
Precipitation Patterns: A Shift Towards Even Distribution
The Precipitation Concentration Index (PCI) has decreased from a baseline of 12.37 to a current value of 9.96. This shift towards a more even distribution of rainfall suggests that precipitation events are becoming less concentrated and more frequent. Such a change can have significant implications for water resource management and agricultural planning, as it may reduce the risk of extreme weather events like flash floods while ensuring a more consistent water supply.
Record Extremes: Historical Context
Hihifo's climate record showcases a maximum temperature of 33.5°C (92.3°F) and a minimum of 18.2°C (64.8°F). These records provide context for understanding the variability and extremities of the local climate. The relatively high maximum temperature underscores the potential for heat stress, while the minimum temperature highlights the cooler nights typical of tropical maritime climates.
Regional Climate Goals and Implications
Wallis and Futuna, as part of France, are committed to regional climate goals that emphasise sustainability and resilience. The observed trends in Hihifo, particularly the warming of low temperatures and the more even distribution of precipitation, may influence future policy decisions and adaptation strategies. These changes are crucial for maintaining ecological balance and supporting the livelihoods of communities dependent on consistent climate conditions.
Station Statistics
10-Year Trend
High: -0.03 °C/decade
Low: +0.26 °C/decade
Rain: -2.33 mm/decade
25-Year Trend
High: -0.07 °C/decade
Low: +0.08 °C/decade
Rain: +0.99 mm/decade
50-Year Trend
High: +0.18 °C/decade
Low: +0.28 °C/decade
Rain: +0.29 mm/decade
All-Time Trend
High: +0.18 °C/decade
Low: +0.26 °C/decade
Rain: +0.29 mm/decade
Percentage Above-Average Days
Last 12 Months: 29.3%
This Year: 20.0%
Precipitation Concentration Index (PCI) ℹ️
Last 12 Months: 11.2
Historical Average: 12.4
Percentile Rank of Last 12 Months ℹ️
High: 48th percentile
Low: 98th percentile
Rain: 70th percentile
Change in Variance ℹ️
High: -4.8%
Low: -22.5%
Intraday: -5.7%
Data Coverage
62.4%
First Year of Data
1944
Station Location
Historical Weather Records
| Max High | Avg High | Min High | Max Avg | Avg Avg | Min Avg | Max Low | Avg Low | Min Low | Max Precipitation | Avg Precipitation | Max Snow | Avg Snow | |
|---|---|---|---|---|---|---|---|---|---|---|---|---|---|
| Record | 33.5 °C | — | 25.0 °C | 31.4 °C | — | 23.0 °C | 29.4 °C | — | 18.0 °C | 215.4 mm | — | — | — |
| January | 33.5 °C | 30.4 °C | 25.7 °C | 29.9 °C | 27.6 °C | 24.3 °C | 29.4 °C | 24.8 °C | 19.9 °C | 191.0 mm | 11.1 mm | — | — |
| February | 33.0 °C | 30.6 °C | 26.0 °C | 30.7 °C | 27.6 °C | 24.6 °C | 29.2 °C | 24.8 °C | 20.5 °C | 215.4 mm | 10.7 mm | — | — |
| March | 33.5 °C | 30.6 °C | 25.4 °C | 30.6 °C | 27.7 °C | 24.1 °C | 29.1 °C | 24.8 °C | 19.6 °C | 154.9 mm | 8.0 mm | — | — |
| April | 33.4 °C | 30.5 °C | 25.8 °C | 30.8 °C | 27.6 °C | 24.2 °C | 28.8 °C | 24.8 °C | 19.3 °C | 199.4 mm | 8.8 mm | — | — |
| May | 32.8 °C | 30.1 °C | 25.0 °C | 31.4 °C | 27.4 °C | 23.9 °C | 29.3 °C | 24.8 °C | 18.5 °C | 164.1 mm | 6.4 mm | — | — |
| June | 32.1 °C | 29.6 °C | 26.0 °C | 29.3 °C | 27.2 °C | 23.5 °C | 28.9 °C | 24.8 °C | 19.7 °C | 127.0 mm | 5.2 mm | — | — |
| July | 31.4 °C | 29.2 °C | 25.1 °C | 29.1 °C | 26.7 °C | 23.5 °C | 28.2 °C | 24.4 °C | 18.0 °C | 142.0 mm | 5.4 mm | — | — |
| August | 31.5 °C | 29.3 °C | 25.1 °C | 29.4 °C | 26.7 °C | 23.1 °C | 27.6 °C | 24.4 °C | 18.4 °C | 124.5 mm | 4.6 mm | — | — |
| September | 32.4 °C | 29.6 °C | 25.0 °C | 29.1 °C | 26.9 °C | 23.0 °C | 28.3 °C | 24.6 °C | 19.2 °C | 103.9 mm | 5.0 mm | — | — |
| October | 32.4 °C | 29.8 °C | 25.0 °C | 29.4 °C | 27.1 °C | 23.2 °C | 28.4 °C | 24.6 °C | 19.5 °C | 166.6 mm | 7.8 mm | — | — |
| November | 33.1 °C | 30.2 °C | 25.3 °C | 29.9 °C | 27.3 °C | 23.9 °C | 28.6 °C | 24.7 °C | 20.5 °C | 170.9 mm | 8.8 mm | — | — |
| December | 33.0 °C | 30.5 °C | 26.3 °C | 30.0 °C | 27.6 °C | 24.3 °C | 29.1 °C | 24.8 °C | 19.5 °C | 191.0 mm | 9.3 mm | — | — |
Data Visualisations
Remove WatermarksCurrent Year Climate Trends vs Historical


Max Temperature this Year | 1 of 6
Climate 12-Month Moving Averages


Max Temperature 12-Month MA | 1 of 6
Daily Data Points and Averages Throughout the Year


Average Max Temperature Throughout Year | 1 of 5
