Climate for Station: Masvingo, Zimbabwe
Loading live weather...
Climate Analysis & Overview
Masvingo, Zimbabwe, exhibits a nuanced climate profile with contrasting temperature trends and a notable shift in precipitation distribution. While long-term data indicates a slight warming, recent years suggest a cooling trend in daytime highs, highlighting the complex dynamics at play in this region.
Köppen Climate Context
Masvingo is situated in a region classified under the Köppen climate system as a Cwa climate, characterised by a humid subtropical climate with dry winters. The city's geographical position, at approximately -20.067° latitude and 30.867° longitude, places it in the south-eastern part of Zimbabwe, influenced by its proximity to the Great Zimbabwe ruins and Lake Mutirikwi. This location contributes to its unique climatic patterns, where seasonal variations are impacted by both altitude and local water bodies, which can moderate temperatures and affect precipitation patterns.
Temperature Trends and Variability
Examining the temperature trends, Masvingo presents a complex picture. Over the past decade, there has been a cooling of 0.97°C (1.75°F) in daytime highs, contrasting with a slight warming of 0.08°C (0.14°F) in nighttime lows. This recent cooling of daytime temperatures diverges from the all-time data, which indicates a slight warming of 0.24°C (0.43°F) for highs and 0.16°C (0.29°F) for lows. This suggests a dynamic interplay between short-term climatic fluctuations and long-term warming trends, possibly influenced by regional climatic shifts or localised environmental changes.
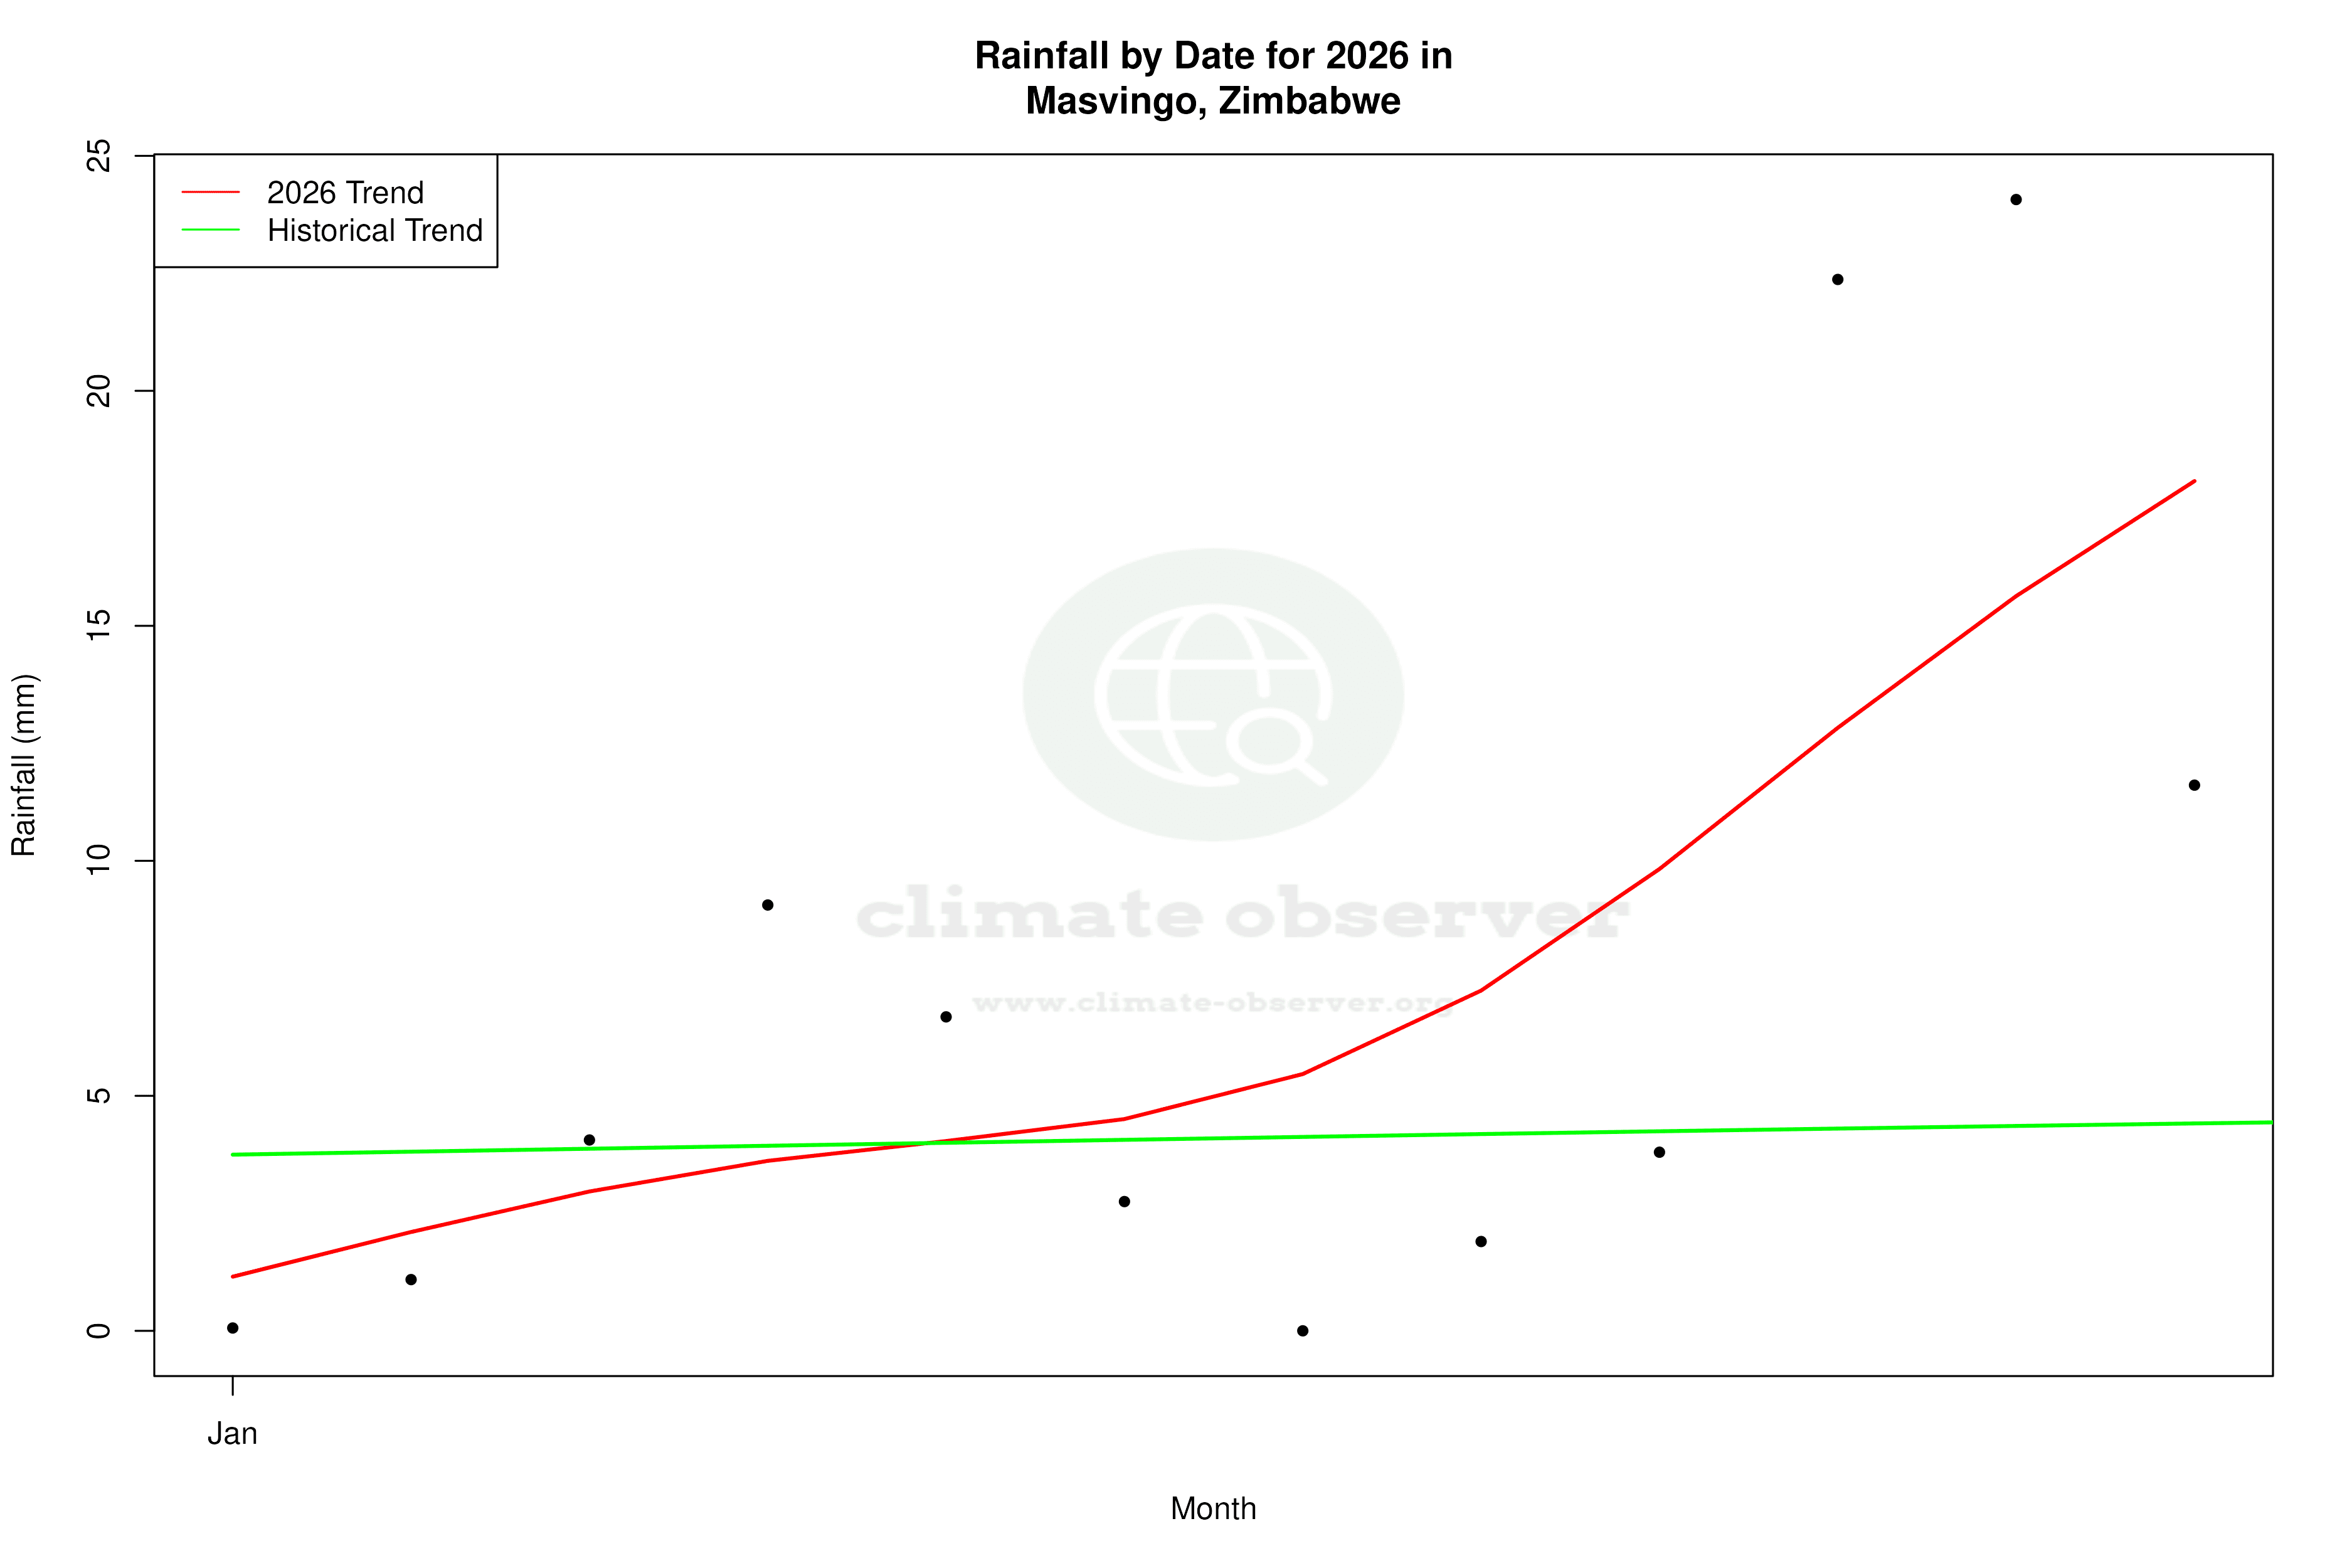
Precipitation Patterns and Distribution
The Precipitation Concentration Index (PCI) for Masvingo has seen a notable change, moving from a baseline of 20.99 to a current value of 17.75. This decrease in PCI suggests that precipitation is becoming more evenly distributed throughout the year, reducing the concentration of rainfall in fewer, more intense events. Such a shift could have significant implications for agriculture and water resource management in the region, providing more consistent water availability but potentially affecting the timing of planting and harvesting cycles.
Extreme Temperature Records
Masvingo's climate is marked by significant temperature extremes, with recorded highs reaching 41.41°C (106.54°F) and lows dropping to -4.6°C (23.72°F). These extremes highlight the region's susceptibility to both intense heat and occasional cold snaps, which can challenge both human and ecological systems. Understanding these extremes is crucial for developing adaptive strategies to mitigate their impacts on local communities and ecosystems.
Regional Climate Goals and Implications
Zimbabwe has been actively pursuing climate resilience and adaptation strategies, focusing on sustainable agriculture and water management. The observed climatic trends in Masvingo, particularly the recent cooling in daytime highs and the more even distribution of rainfall, could influence these national strategies. By aligning local climate data with broader regional goals, Masvingo can enhance its resilience to climate variability and change, ensuring sustainable development and improved quality of life for its inhabitants.
Station Statistics
10-Year Trend
High: -0.67 °C/decade
Low: +0.15 °C/decade
Rain: +0.27 mm/decade
25-Year Trend
High: -0.33 °C/decade
Low: +0.30 °C/decade
Rain: +0.00 mm/decade
50-Year Trend
High: +0.20 °C/decade
Low: +0.25 °C/decade
Rain: +0.08 mm/decade
All-Time Trend
High: +0.24 °C/decade
Low: +0.17 °C/decade
Rain: +0.01 mm/decade
Percentage Above-Average Days
Last 12 Months: 50.7%
This Year: 52.4%
Precipitation Concentration Index (PCI) ℹ️
Last 12 Months: 20.4
Historical Average: 22.1
Percentile Rank of Last 12 Months ℹ️
High: 57th percentile
Low: 91st percentile
Rain: 73rd percentile
Change in Variance ℹ️
High: -1.4%
Low: -7.0%
Intraday: +2.1%
Data Coverage
91.2%
First Year of Data
1951
Station Location
Historical Weather Records
| Max High | Avg High | Min High | Max Avg | Avg Avg | Min Avg | Max Low | Avg Low | Min Low | Max Precipitation | Avg Precipitation | Max Snow | Avg Snow | |
|---|---|---|---|---|---|---|---|---|---|---|---|---|---|
| Record | 41.4 °C | — | 8.8 °C | 33.4 °C | — | 3.9 °C | 24.2 °C | — | -4.6 °C | 142.0 mm | — | — | — |
| January | 38.9 °C | 28.5 °C | 16.0 °C | 31.1 °C | 23.0 °C | 14.2 °C | 22.4 °C | 17.4 °C | 9.7 °C | 142.0 mm | 4.6 mm | — | — |
| February | 41.4 °C | 28.1 °C | 16.6 °C | 33.1 °C | 22.6 °C | 15.3 °C | 23.3 °C | 17.1 °C | 10.0 °C | 102.8 mm | 4.2 mm | — | — |
| March | 38.2 °C | 27.5 °C | 16.3 °C | 30.1 °C | 21.7 °C | 14.2 °C | 21.6 °C | 15.7 °C | 8.1 °C | 97.8 mm | 2.4 mm | — | — |
| April | 35.5 °C | 26.3 °C | 15.0 °C | 28.1 °C | 19.7 °C | 7.7 °C | 20.2 °C | 12.9 °C | 2.4 °C | 83.6 mm | 1.1 mm | — | — |
| May | 34.0 °C | 24.7 °C | 10.7 °C | 26.8 °C | 17.1 °C | 8.9 °C | 18.5 °C | 8.9 °C | 0.0 °C | 31.7 mm | 0.3 mm | — | — |
| June | 32.5 °C | 22.3 °C | 9.2 °C | 25.4 °C | 14.6 °C | 3.9 °C | 15.0 °C | 6.4 °C | -4.6 °C | 26.7 mm | 0.2 mm | — | — |
| July | 31.5 °C | 22.1 °C | 8.8 °C | 26.1 °C | 14.4 °C | 6.8 °C | 14.7 °C | 5.8 °C | -3.6 °C | 17.9 mm | 0.2 mm | — | — |
| August | 35.4 °C | 25.1 °C | 10.5 °C | 28.5 °C | 17.2 °C | 8.9 °C | 18.1 °C | 8.1 °C | -0.3 °C | 16.3 mm | 0.1 mm | — | — |
| September | 38.5 °C | 28.3 °C | 9.7 °C | 31.8 °C | 20.7 °C | 7.3 °C | 21.0 °C | 11.8 °C | 2.5 °C | 35.5 mm | 0.3 mm | — | — |
| October | 41.1 °C | 29.8 °C | 13.3 °C | 33.4 °C | 22.6 °C | 11.7 °C | 23.7 °C | 15.0 °C | 3.2 °C | 64.5 mm | 0.8 mm | — | — |
| November | 40.4 °C | 29.6 °C | 11.2 °C | 33.1 °C | 23.4 °C | 11.7 °C | 24.2 °C | 16.7 °C | 6.3 °C | 95.0 mm | 2.9 mm | — | — |
| December | 39.6 °C | 28.8 °C | 15.2 °C | 33.3 °C | 23.2 °C | 13.8 °C | 23.1 °C | 17.4 °C | 8.3 °C | 112.8 mm | 4.9 mm | — | — |
Data Visualisations
Remove WatermarksCurrent Year Climate Trends vs Historical


Max Temperature this Year | 1 of 6
Climate 12-Month Moving Averages


Max Temperature 12-Month MA | 1 of 6
Daily Data Points and Averages Throughout the Year
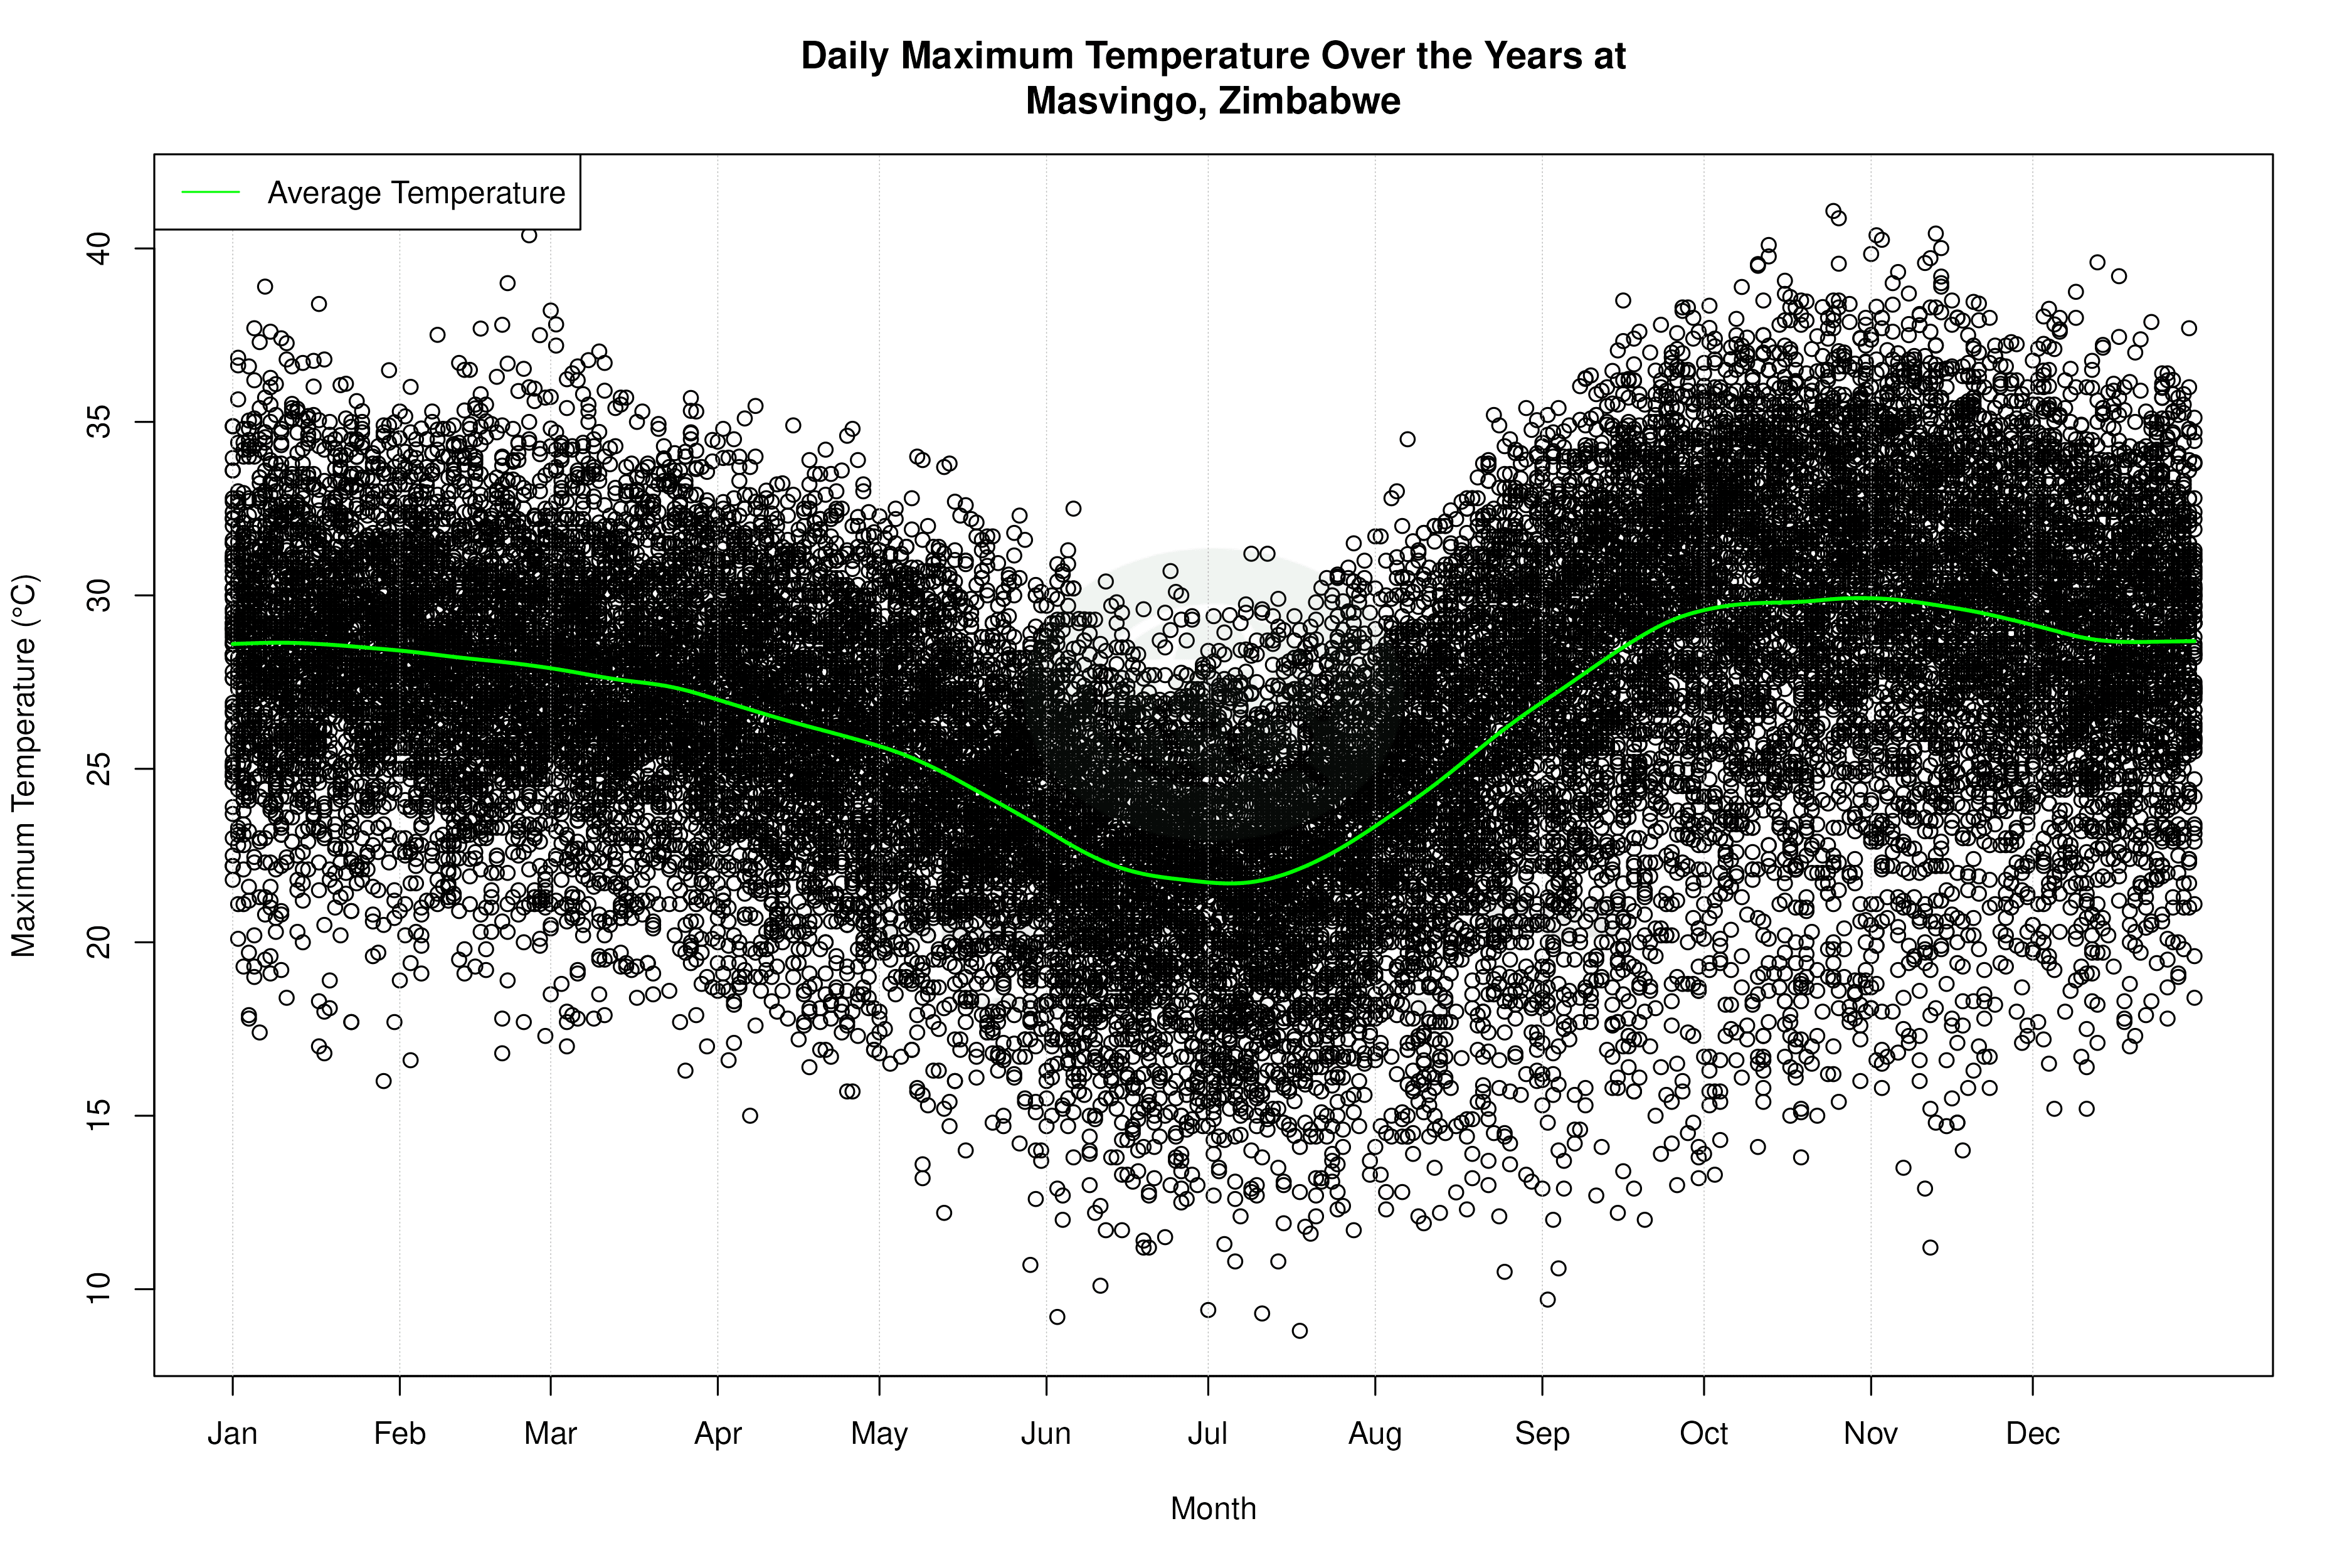


Average Max Temperature Throughout Year | 1 of 5
