Climate for Station: El-Golea, El Menia, Algeria
Loading live weather...
Climate Analysis & Overview
El-Golea is experiencing a warming trend, particularly in its minimum temperatures, with a significant shift towards more evenly distributed precipitation. This aligns with Algeria's climate goals of adapting to changing weather patterns and reducing the impacts of extreme events.
Desert Climate Dynamics
El-Golea, located in Algeria, falls under the BWh category of the Köppen climate classification, indicating a hot desert climate. This region is characterised by extremely high temperatures and minimal rainfall, influenced by its geographical position in the Sahara Desert. The all-time temperature trends reveal a warming of 0.06°C (0.11°F) in maximum temperatures and a more pronounced increase of 0.15°C (0.27°F) in minimum temperatures. These changes suggest a gradual rise in baseline temperatures, particularly during the night, which can affect local ecosystems and human activities.
Recent Thermal Shifts
Over the past decade, El-Golea has witnessed a more pronounced warming trend. Maximum temperatures have increased by 0.68°C (1.22°F), while minimum temperatures have risen by a notable 1.78°C (3.20°F). This sharper increase in nighttime temperatures could lead to reduced thermal relief during the night, impacting agriculture and water resources. The significant rise in minimum temperatures over the last decade is a crucial indicator of the region's changing climate dynamics.
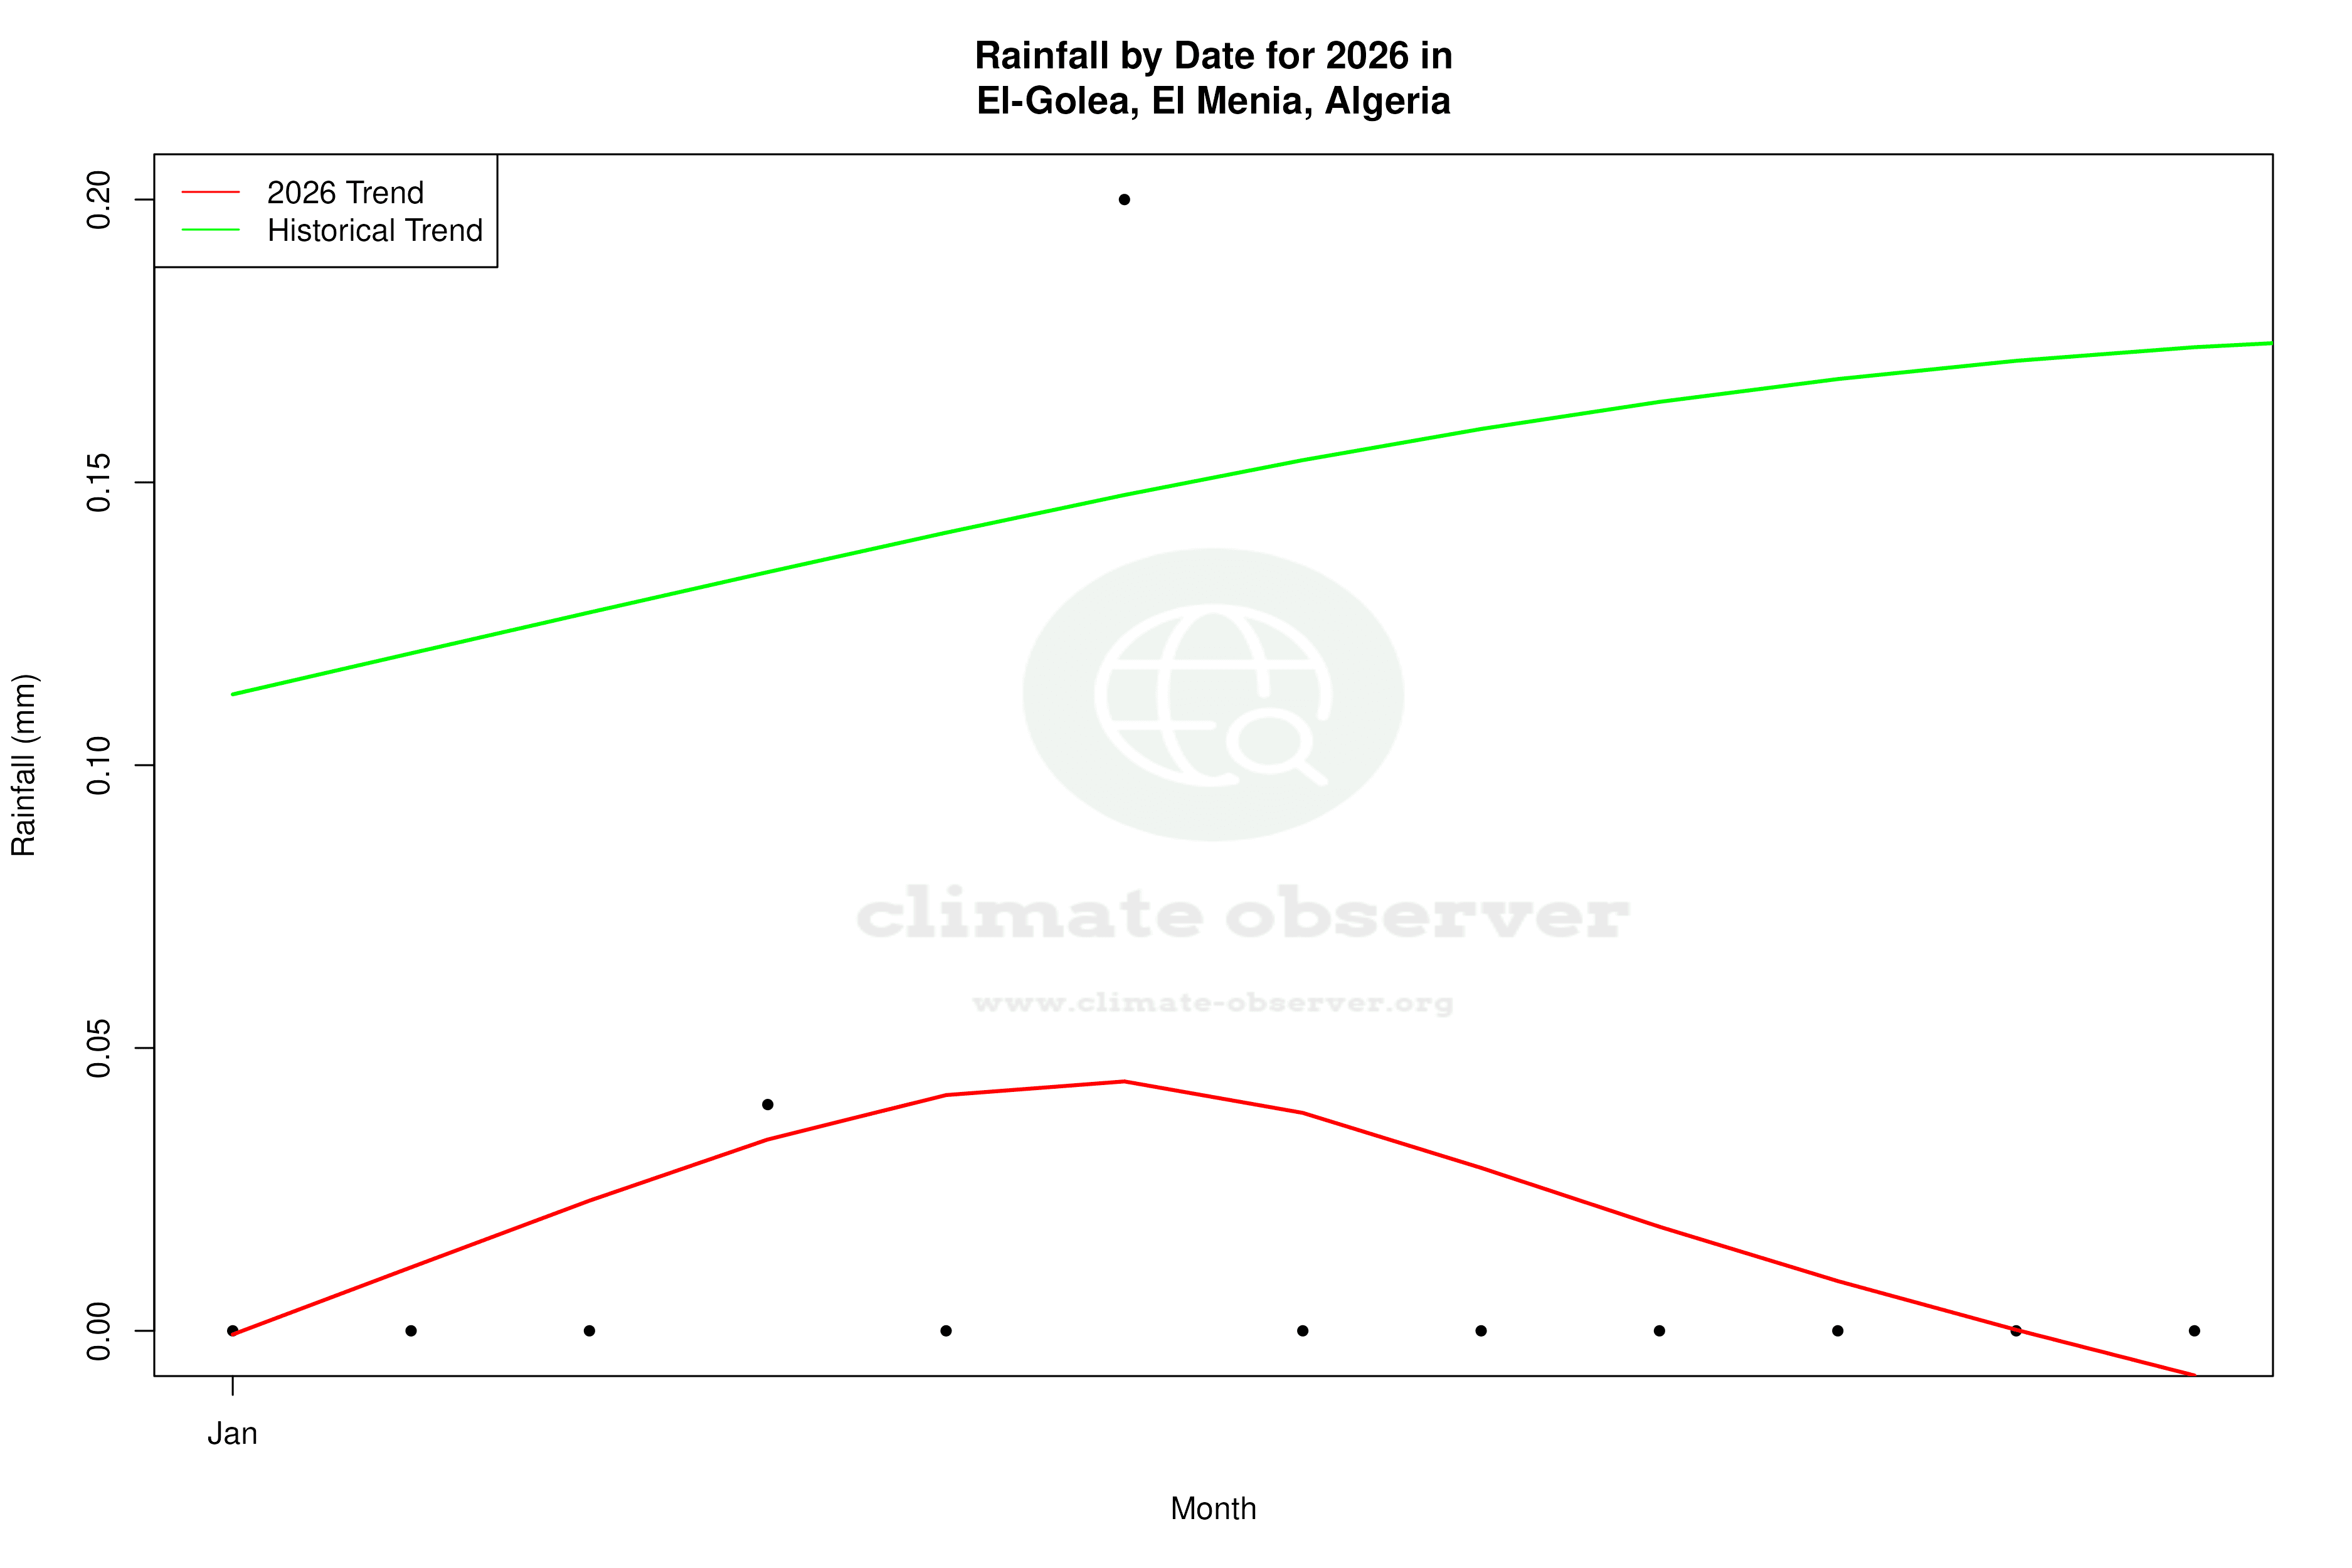
Precipitation Patterns Evolving
The Precipitation Concentration Index (PCI) for El-Golea has shown a significant shift from a baseline of 30.3 to a current value of 21.9. PCI measures how precipitation is distributed throughout the year, with higher values indicating more concentrated rainfall events. The decrease in PCI suggests that rainfall is now more evenly distributed across the year, which could benefit agricultural practices by reducing the risk of flood events and improving water availability.
Temperature Extremes
El-Golea's record temperatures highlight the extremes of its desert climate. The highest recorded temperature is 50.1°C (122.2°F), while the lowest is -8.7°C (16.3°F). These extremes underscore the region's vulnerability to severe temperature fluctuations, which can have profound effects on infrastructure, health, and the environment.
Regional Climate Goals
Algeria has been actively pursuing climate adaptation strategies to mitigate the impacts of climate change. The observed trends in El-Golea, particularly the warming of minimum temperatures and the more even distribution of precipitation, align with these goals. By understanding and adapting to these changes, the region can better manage its natural resources and reduce the vulnerability of its communities to climate-related challenges.
Station Statistics
10-Year Trend
High: +1.18 °F/decade
Low: +3.43 °F/decade
Rain: -0.001 in/decade
25-Year Trend
High: -0.02 °F/decade
Low: +1.30 °F/decade
Rain: -0.000 in/decade
50-Year Trend
High: +0.82 °F/decade
Low: +0.70 °F/decade
Rain: +0.000 in/decade
All-Time Trend
High: +0.11 °F/decade
Low: +0.27 °F/decade
Rain: -0.000 in/decade
Percentage Above-Average Days
Last 12 Months: 55.1%
This Year: 55.6%
Precipitation Concentration Index (PCI) ℹ️
Last 12 Months: 30.7
Historical Average: 45.9
Percentile Rank of Last 12 Months ℹ️
High: 76th percentile
Low: 97th percentile
Rain: 54th percentile
Change in Variance ℹ️
High: +1.1%
Low: +9.4%
Intraday: -11.3%
Data Coverage
66.3%
First Year of Data
1892
Station Location
Historical Weather Records
| Max High | Avg High | Min High | Max Avg | Avg Avg | Min Avg | Max Low | Avg Low | Min Low | Max Precipitation | Avg Precipitation | Max Snow | Avg Snow | |
|---|---|---|---|---|---|---|---|---|---|---|---|---|---|
| Record | 122.18 °F | — | 42.17 °F | 107.24 °F | — | 36.86 °F | 96.44 °F | — | 16.34 °F | 3.74 in | — | — | — |
| January | 85.46 °F | 63.08 °F | 42.17 °F | 73.04 °F | 50.00 °F | 36.86 °F | 60.80 °F | 37.06 °F | 16.34 °F | 1.73 in | 0.01 in | — | — |
| February | 97.70 °F | 68.43 °F | 45.14 °F | 78.26 °F | 55.32 °F | 38.66 °F | 64.58 °F | 41.29 °F | 23.00 °F | 0.91 in | 0.00 in | — | — |
| March | 100.76 °F | 75.58 °F | 50.54 °F | 82.04 °F | 62.53 °F | 45.14 °F | 76.10 °F | 47.96 °F | 26.42 °F | 1.02 in | 0.01 in | — | — |
| April | 110.12 °F | 83.76 °F | 54.68 °F | 90.14 °F | 71.05 °F | 51.62 °F | 77.36 °F | 55.83 °F | 35.60 °F | 0.91 in | 0.00 in | — | — |
| May | 113.00 °F | 92.82 °F | 68.00 °F | 98.42 °F | 80.35 °F | 58.10 °F | 88.88 °F | 64.58 °F | 42.80 °F | 0.43 in | 0.00 in | — | — |
| June | 120.20 °F | 102.74 °F | 78.26 °F | 105.98 °F | 90.04 °F | 72.14 °F | 93.20 °F | 74.05 °F | 51.98 °F | 0.39 in | 0.00 in | — | — |
| July | 122.18 °F | 107.32 °F | 86.00 °F | 107.24 °F | 94.47 °F | 75.56 °F | 93.92 °F | 78.31 °F | 60.26 °F | 0.04 in | 0.00 in | — | — |
| August | 120.20 °F | 105.98 °F | 86.90 °F | 105.62 °F | 93.07 °F | 75.92 °F | 96.44 °F | 77.34 °F | 56.12 °F | 0.29 in | 0.00 in | — | — |
| September | 118.40 °F | 98.18 °F | 72.14 °F | 100.22 °F | 85.60 °F | 61.34 °F | 87.80 °F | 71.55 °F | 45.68 °F | 0.55 in | 0.00 in | — | — |
| October | 107.96 °F | 85.94 °F | 64.04 °F | 91.58 °F | 73.64 °F | 53.24 °F | 81.14 °F | 59.92 °F | 35.24 °F | 1.26 in | 0.00 in | — | — |
| November | 98.06 °F | 73.06 °F | 52.16 °F | 79.16 °F | 60.11 °F | 42.80 °F | 69.80 °F | 47.32 °F | 26.96 °F | 1.42 in | 0.01 in | — | — |
| December | 92.48 °F | 64.04 °F | 47.30 °F | 72.32 °F | 51.72 °F | 37.76 °F | 66.02 °F | 39.23 °F | 20.84 °F | 3.74 in | 0.01 in | — | — |
Data Visualisations
Remove WatermarksCurrent Year Climate Trends vs Historical


Max Temperature this Year | 1 of 6
Climate 12-Month Moving Averages


Max Temperature 12-Month MA | 1 of 6
Daily Data Points and Averages Throughout the Year


Average Max Temperature Throughout Year | 1 of 5
