Climate for Station: Biskra, Algeria
Loading live weather...
Climate Analysis & Overview
Biskra is experiencing a noticeable warming trend, with both high and low temperatures rising over the past decade. The Precipitation Concentration Index indicates a slight increase in precipitation concentration, suggesting more intense rainfall events. These shifts align with broader regional climate trends in Algeria, which has been focusing on climate adaptation strategies.
Arid Desert Climate Dynamics
Biskra, located in Algeria, falls under the BWh classification of the Köppen climate system, indicating a hot desert climate. The Sahara Desert's proximity heavily influences its weather patterns, characterised by extremely high temperatures and minimal rainfall. The city's location in a flat, arid region means it is less affected by moderating influences such as mountains or large bodies of water, leading to more extreme temperatures.
Rising Temperatures: A Decade of Change
Over the past ten years, Biskra has seen a significant warming trend. High temperatures have increased by 1.58°C (2.84°F), while low temperatures have risen by 1.59°C (2.86°F). These changes are more pronounced than the all-time trends, where highs and lows have increased by 0.14°C (0.25°F) and 0.13°C (0.24°F), respectively. This suggests an acceleration of warming in recent years, consistent with global climate patterns.
Record Extremes: The Heat and Cold of Biskra
Biskra's climate is marked by its extreme temperature records. The highest recorded temperature is a scorching 51.0°C (123.8°F), while the lowest is a frigid -5.0°C (23.0°F). These extremes highlight the city's vulnerability to both intense heat waves and rare cold snaps, posing challenges for local agriculture and infrastructure.
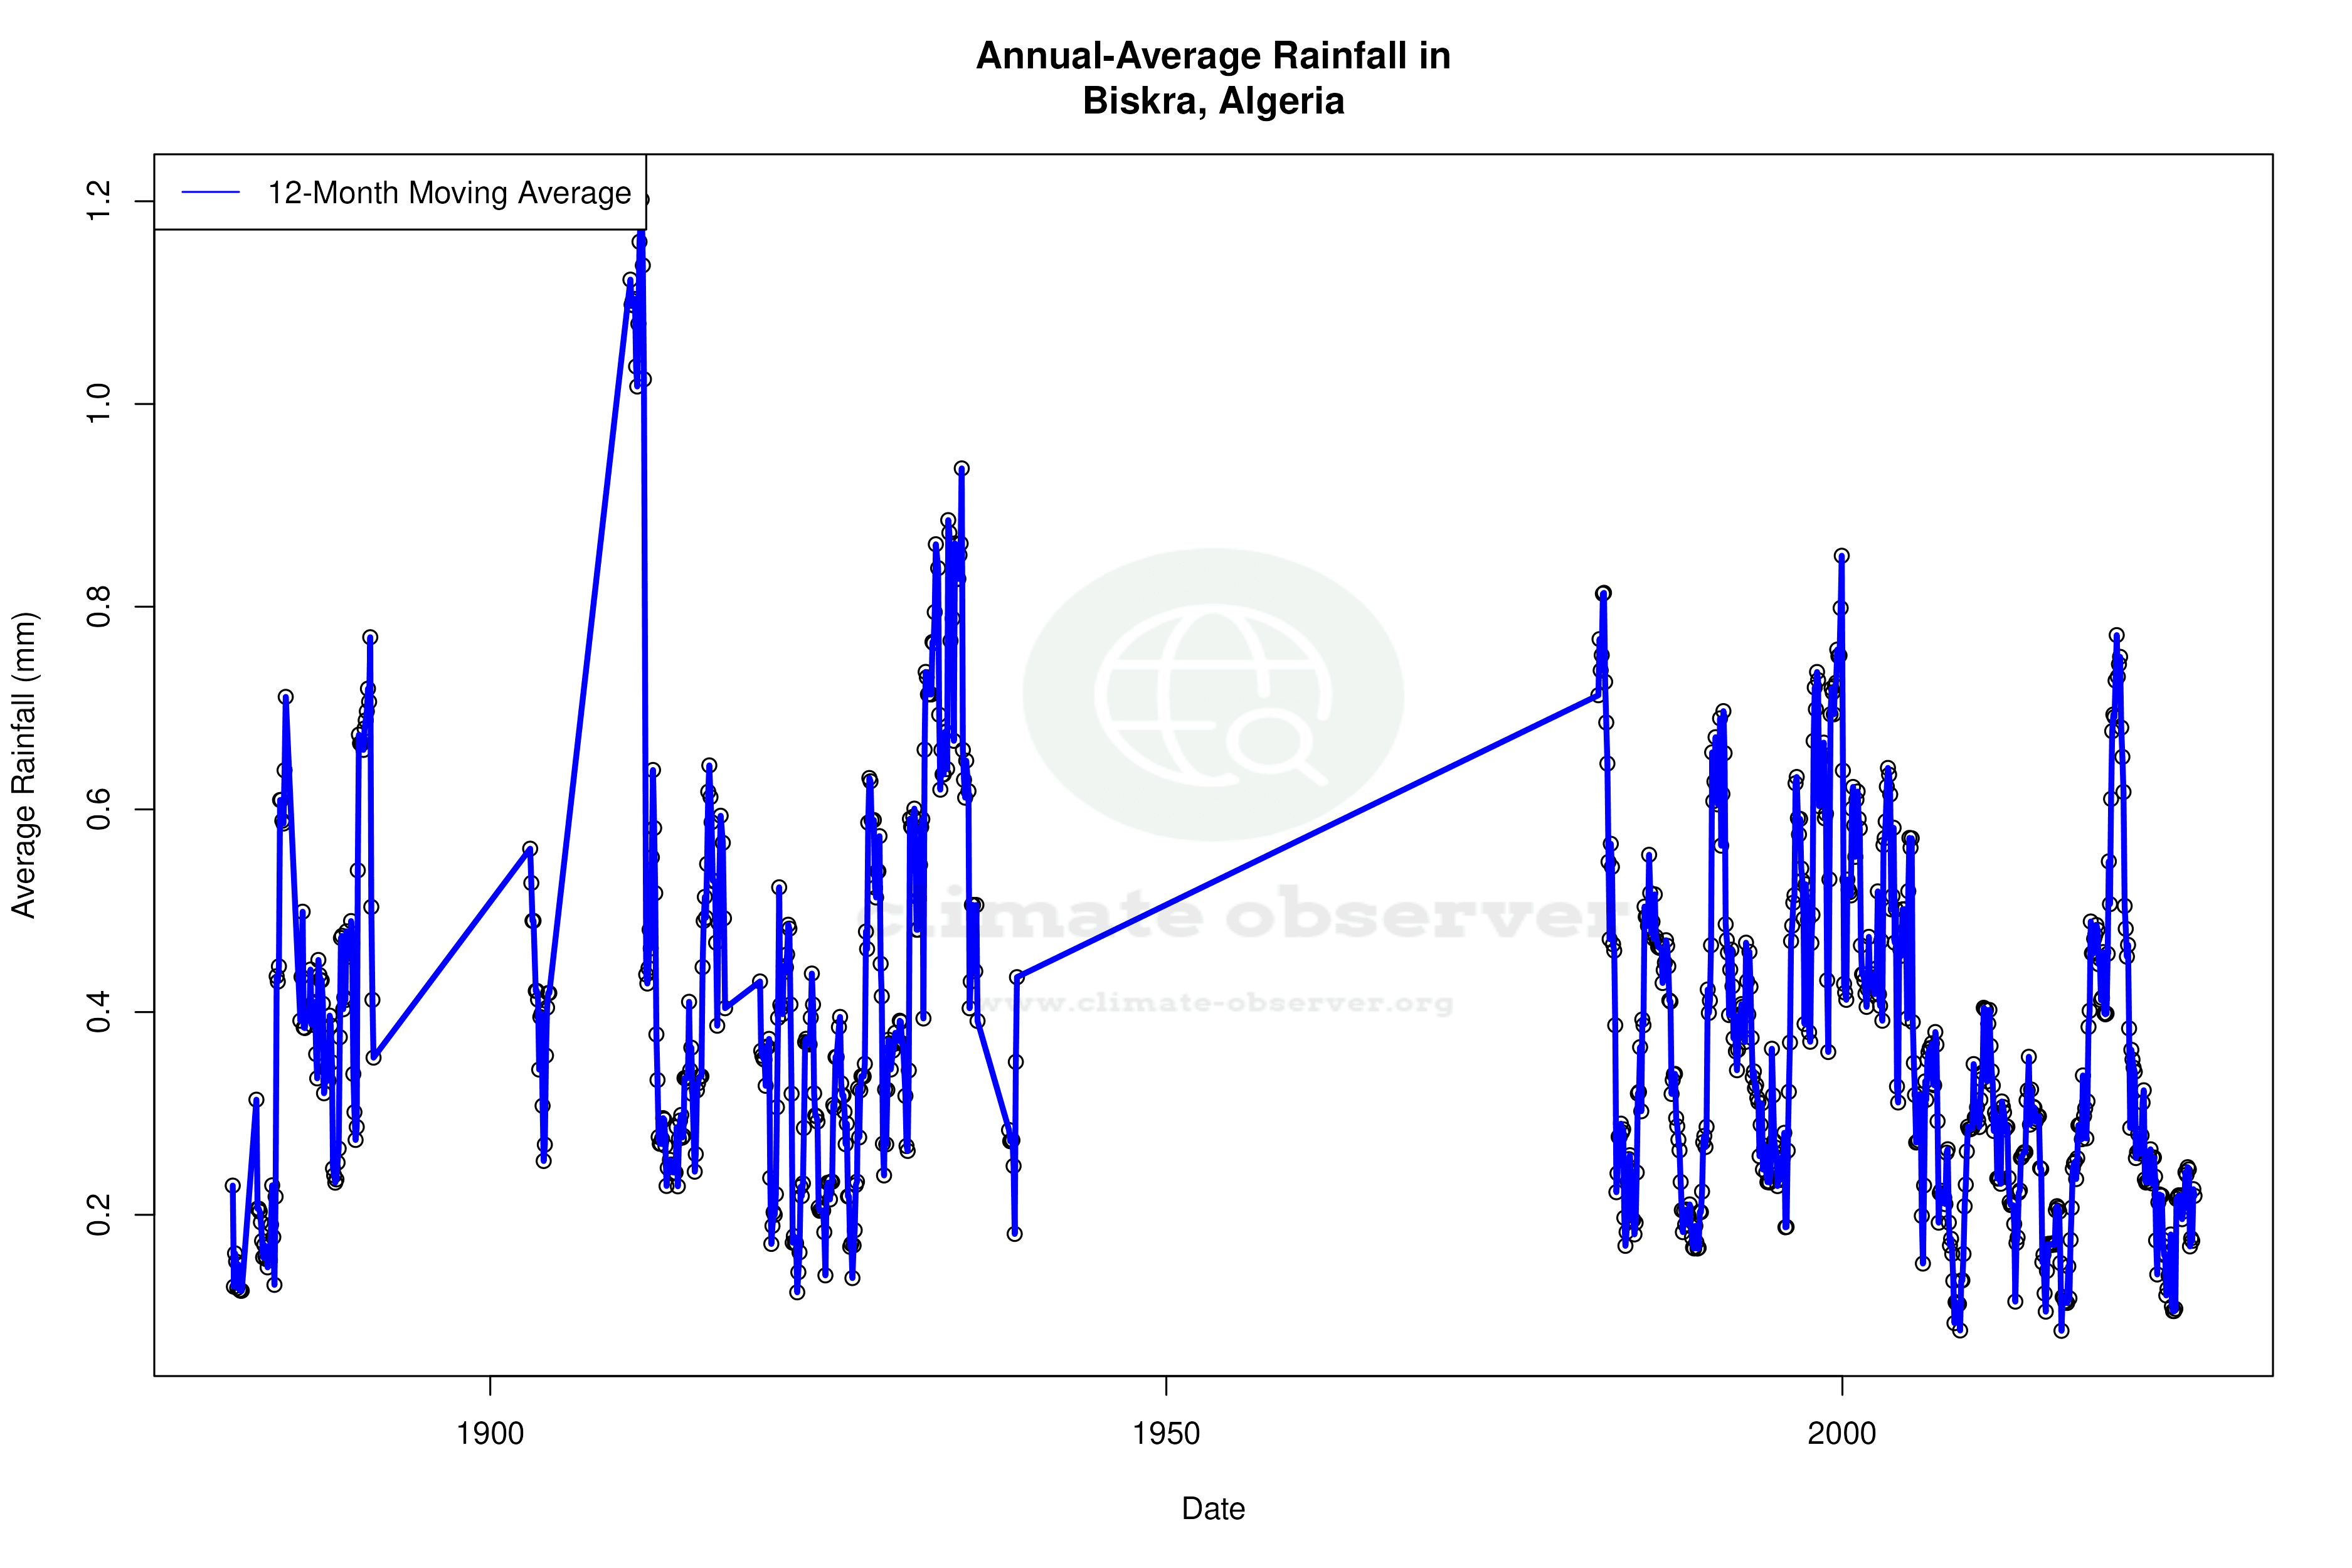
Precipitation Patterns: Concentration Increases
The Precipitation Concentration Index (PCI) for Biskra has shown a slight increase from a baseline of 16.4 to a current value of 16.7. This indicates that rainfall is becoming slightly more concentrated in fewer, more intense events. While not yet reaching the highly concentrated threshold of 20, this trend suggests potential impacts on water management and agriculture, as intense rainfall can lead to flooding and soil erosion.
Regional Context: Algeria's Climate Goals
Algeria has been actively working towards climate resilience, focusing on water management and desertification mitigation. The warming trends and changing precipitation patterns in Biskra reflect broader climatic shifts that the country is addressing through national policies. These efforts are crucial as the region faces increasing climate variability, impacting both urban and rural communities.
Station Statistics
10-Year Trend
High: +2.56 °F/decade
Low: +2.56 °F/decade
Rain: -0.006 in/decade
25-Year Trend
High: +1.07 °F/decade
Low: +1.68 °F/decade
Rain: -0.002 in/decade
50-Year Trend
High: +0.88 °F/decade
Low: +0.67 °F/decade
Rain: -0.002 in/decade
All-Time Trend
High: +0.27 °F/decade
Low: +0.26 °F/decade
Rain: -0.000 in/decade
Percentage Above-Average Days
Last 12 Months: 50.3%
This Year: 51.7%
Precipitation Concentration Index (PCI) ℹ️
Last 12 Months: 17.6
Historical Average: 19.4
Percentile Rank of Last 12 Months ℹ️
High: 88th percentile
Low: 92nd percentile
Rain: 40th percentile
Change in Variance ℹ️
High: +4.5%
Low: +14.8%
Intraday: -24.8%
Data Coverage
58.6%
First Year of Data
1880
Station Location
Historical Weather Records
| Max High | Avg High | Min High | Max Avg | Avg Avg | Min Avg | Max Low | Avg Low | Min Low | Max Precipitation | Avg Precipitation | Max Snow | Avg Snow | |
|---|---|---|---|---|---|---|---|---|---|---|---|---|---|
| Record | 123.80 °F | — | 43.57 °F | 108.50 °F | — | 40.28 °F | 100.40 °F | — | 23.00 °F | 5.39 in | — | — | — |
| January | 84.20 °F | 62.25 °F | 44.01 °F | 69.80 °F | 53.48 °F | 40.28 °F | 64.40 °F | 44.00 °F | 26.56 °F | 1.81 in | 0.02 in | — | — |
| February | 87.80 °F | 66.02 °F | 44.60 °F | 75.92 °F | 56.81 °F | 42.08 °F | 70.70 °F | 46.65 °F | 27.79 °F | 3.02 in | 0.02 in | — | — |
| March | 94.64 °F | 72.37 °F | 50.07 °F | 80.96 °F | 62.85 °F | 42.62 °F | 71.60 °F | 51.56 °F | 31.71 °F | 2.83 in | 0.02 in | — | — |
| April | 107.60 °F | 79.39 °F | 55.40 °F | 87.98 °F | 69.62 °F | 48.42 °F | 81.14 °F | 57.13 °F | 37.40 °F | 1.26 in | 0.02 in | — | — |
| May | 113.54 °F | 88.29 °F | 63.91 °F | 100.58 °F | 79.03 °F | 59.00 °F | 89.60 °F | 65.41 °F | 41.00 °F | 5.39 in | 0.02 in | — | — |
| June | 117.32 °F | 98.14 °F | 73.76 °F | 107.06 °F | 88.57 °F | 66.92 °F | 97.52 °F | 74.52 °F | 52.20 °F | 1.36 in | 0.01 in | — | — |
| July | 123.80 °F | 104.57 °F | 80.60 °F | 108.50 °F | 94.19 °F | 78.44 °F | 100.40 °F | 80.08 °F | 60.98 °F | 0.78 in | 0.00 in | — | — |
| August | 120.20 °F | 103.17 °F | 84.90 °F | 106.70 °F | 93.02 °F | 77.54 °F | 97.88 °F | 79.65 °F | 59.00 °F | 0.89 in | 0.01 in | — | — |
| September | 114.80 °F | 93.82 °F | 69.80 °F | 101.48 °F | 84.42 °F | 62.96 °F | 91.40 °F | 72.75 °F | 51.80 °F | 1.34 in | 0.02 in | — | — |
| October | 104.90 °F | 82.63 °F | 55.76 °F | 89.78 °F | 74.06 °F | 53.78 °F | 87.80 °F | 62.98 °F | 39.56 °F | 1.85 in | 0.02 in | — | — |
| November | 95.54 °F | 70.83 °F | 47.32 °F | 80.06 °F | 62.26 °F | 47.14 °F | 72.14 °F | 52.77 °F | 33.80 °F | 1.77 in | 0.02 in | — | — |
| December | 81.50 °F | 63.44 °F | 43.57 °F | 71.24 °F | 54.88 °F | 42.44 °F | 66.20 °F | 45.86 °F | 23.00 °F | 1.17 in | 0.02 in | — | — |
Data Visualisations
Remove WatermarksCurrent Year Climate Trends vs Historical


Max Temperature this Year | 1 of 6
Climate 12-Month Moving Averages


Max Temperature 12-Month MA | 1 of 6
Daily Data Points and Averages Throughout the Year


Average Max Temperature Throughout Year | 1 of 5
