Climate for Station: Annaba, Algeria
Loading live weather...
Climate Analysis & Overview
Annaba is experiencing a warming trend, with significant increases in both high and low temperatures over the past decade. The Precipitation Concentration Index (PCI) indicates a shift towards more evenly distributed rainfall, contrasting with its historical patterns. These changes are critical in the context of Algeria's climate goals and regional weather dynamics.
Warming Patterns in Annaba
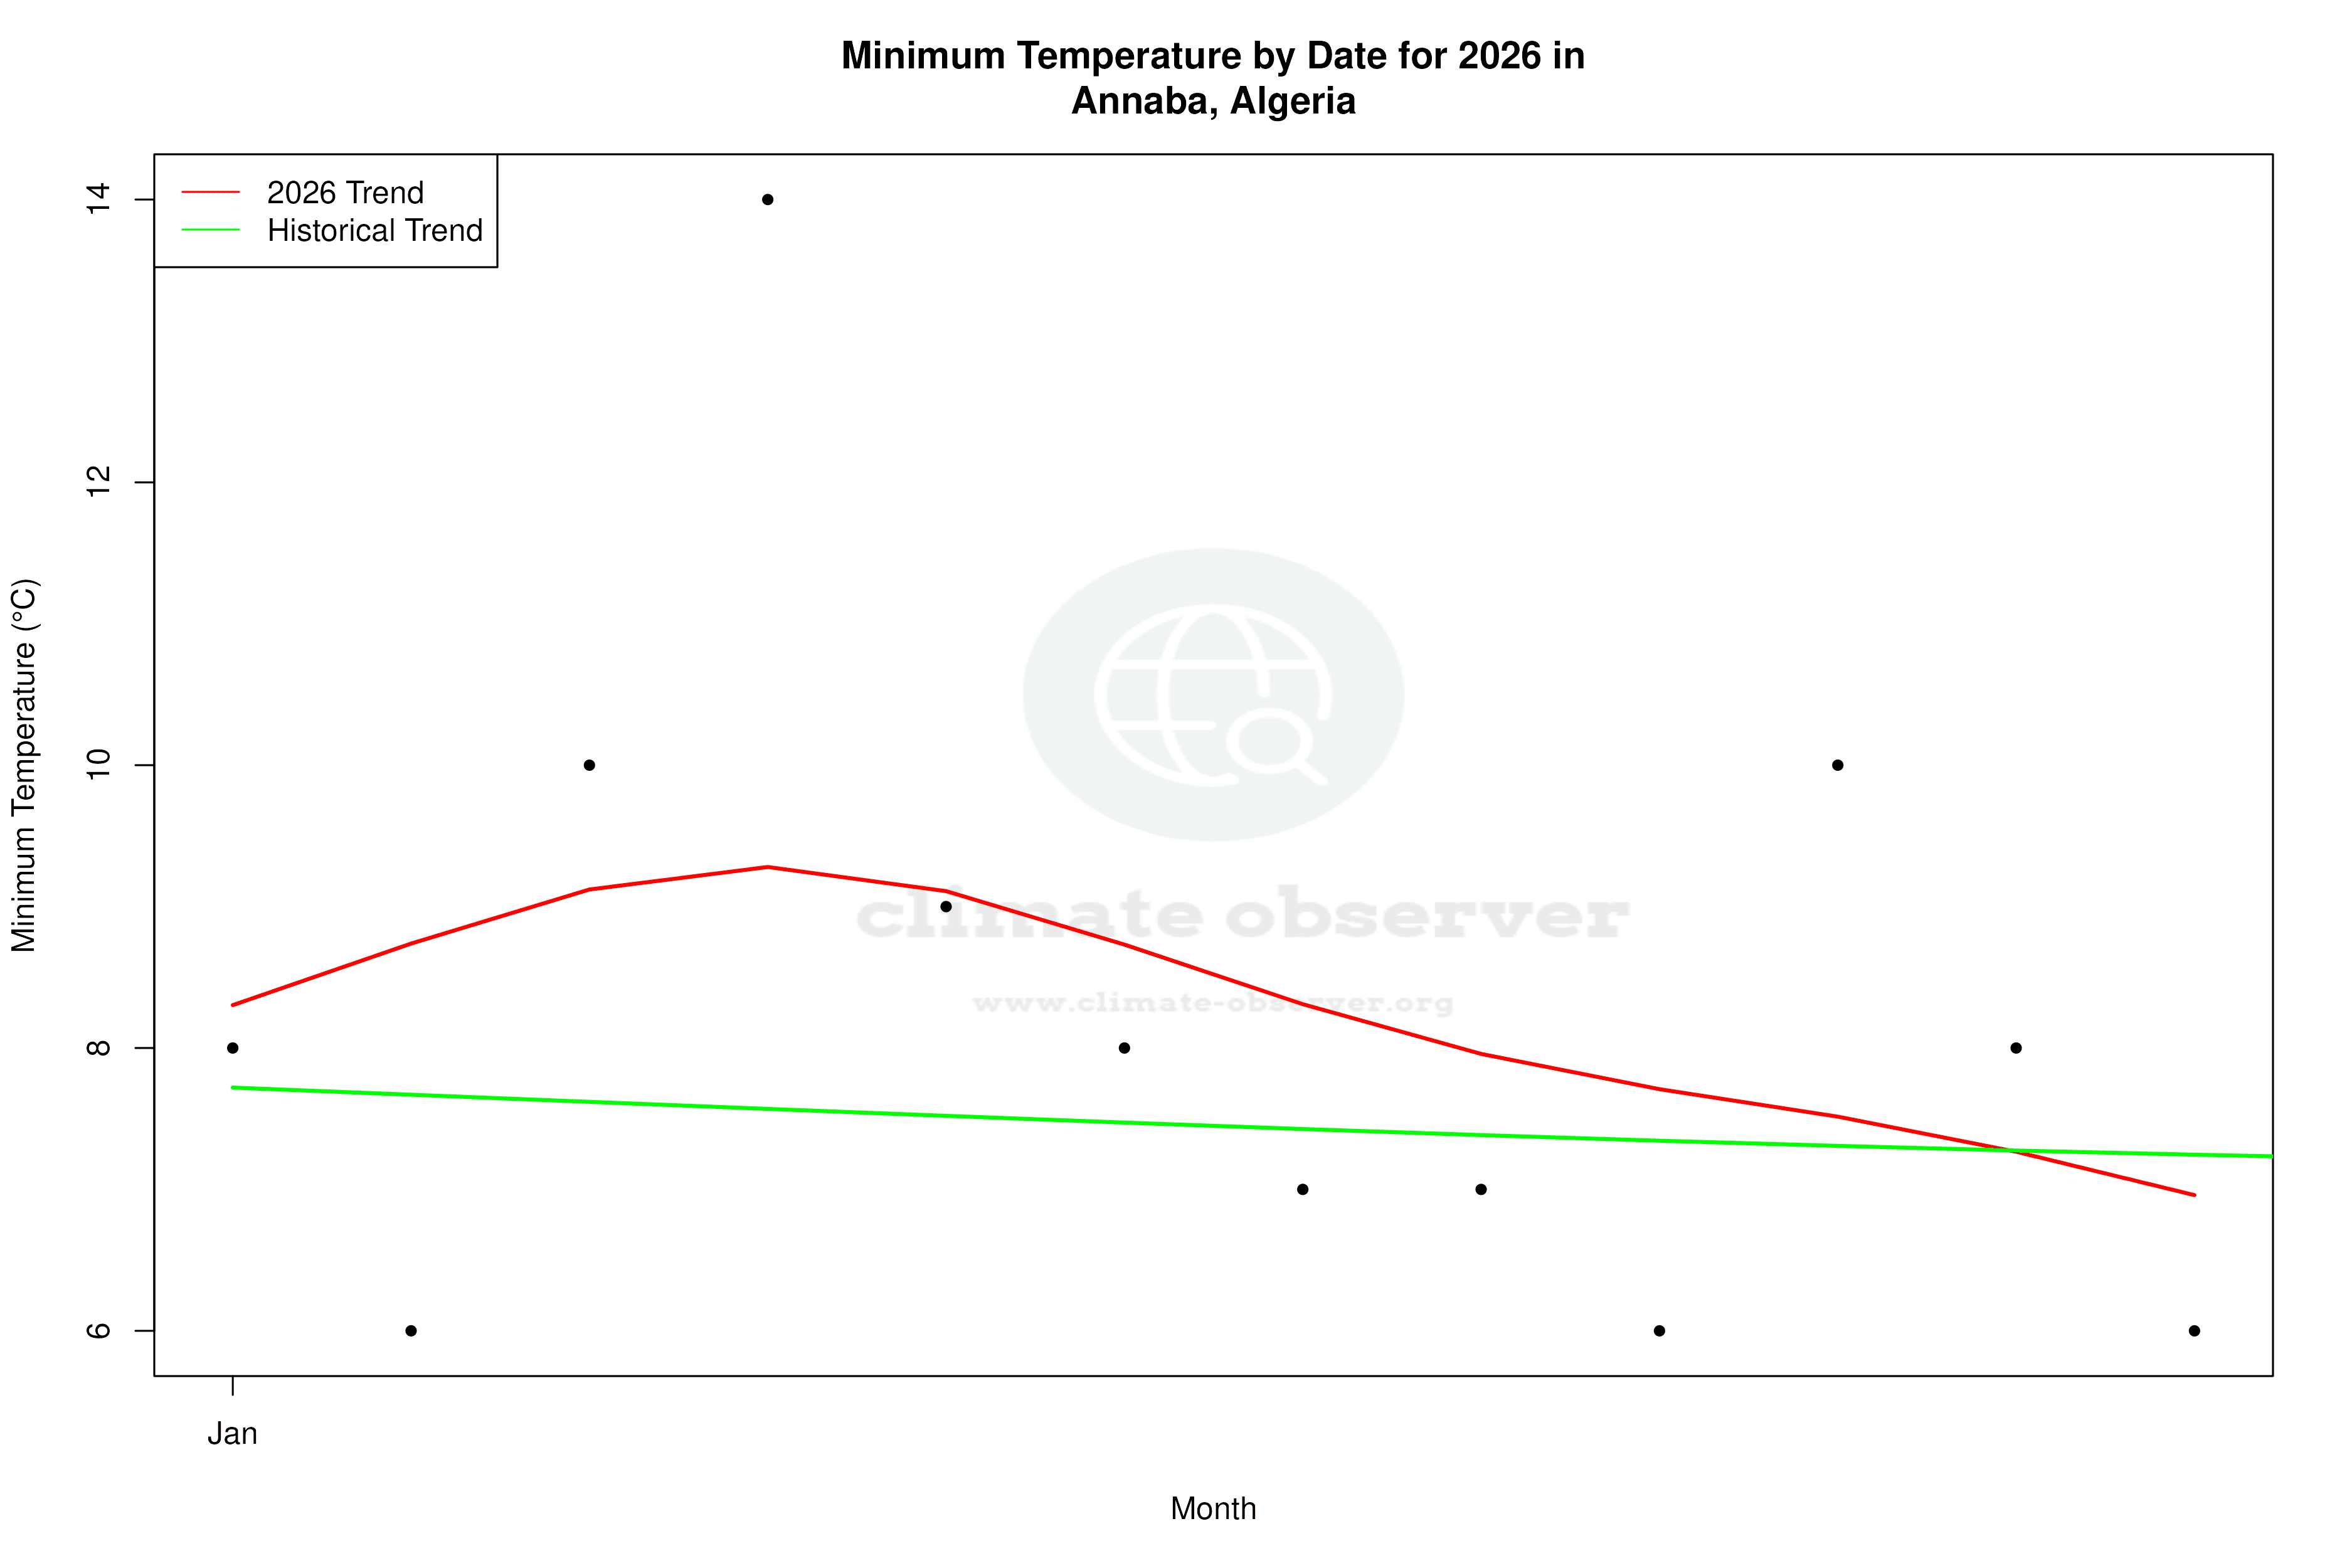
Annaba, located on Algeria's northeastern coast, is characterised by a Mediterranean climate, marked by hot, dry summers and mild, wet winters. Recent data indicates a notable warming trend, particularly over the past decade. The 10-year trend shows an increase in high temperatures by 1.90°C (3.42°F) and low temperatures by 0.81°C (1.45°F). This is a more pronounced change compared to the all-time trends, which exhibit a more modest warming of 0.25°C (0.45°F) for highs and 0.07°C (0.13°F) for lows. This suggests a recent acceleration in temperature increases, potentially linked to broader regional climate shifts.
Temperature Extremes and Records
Annaba's temperature records highlight the potential for extreme weather events. The highest recorded temperature is 45.4°C (113.7°F), while the lowest is -4.0°C (24.8°F). These extremes underscore the variability inherent in Annaba's climate, which can pose challenges for local agriculture and infrastructure, particularly in the context of ongoing climate change.
Precipitation Distribution Shifts
The Precipitation Concentration Index (PCI) for Annaba has decreased from a baseline of 15.3 to a current value of 12.3. This reduction indicates a shift towards more evenly distributed rainfall throughout the year, as opposed to concentrated precipitation events. Such a change can influence water resource management and agricultural planning, offering potential benefits by reducing the risk of flooding and soil erosion.
Regional Climate Context
Annaba's climatic changes are set against the backdrop of Algeria's national climate goals, which include enhancing resilience to climate impacts and promoting sustainable water management. The warming trends observed in Annaba align with broader regional patterns, where increased temperatures are a growing concern. Recent weather events in the region, such as heatwaves and irregular rainfall, further highlight the importance of adaptive strategies to mitigate climate risks.
Geographical Influences on Climate
Annaba's geographical position, bordered by the Mediterranean Sea and proximate to the Tell Atlas mountains, plays a crucial role in its climatic conditions. The sea moderates temperature extremes, while the mountains influence precipitation patterns. These geographical factors, combined with the observed climatic changes, suggest a complex interplay of natural and anthropogenic influences shaping Annaba's climate profile.
Station Statistics
10-Year Trend
High: +3.48 °F/decade
Low: +1.81 °F/decade
Rain: -0.006 in/decade
25-Year Trend
High: +0.58 °F/decade
Low: +0.26 °F/decade
Rain: -0.007 in/decade
50-Year Trend
High: +0.46 °F/decade
Low: +0.01 °F/decade
Rain: -0.002 in/decade
All-Time Trend
High: +0.43 °F/decade
Low: +0.08 °F/decade
Rain: -0.002 in/decade
Percentage Above-Average Days
Last 12 Months: 53.0%
This Year: 53.0%
Precipitation Concentration Index (PCI) ℹ️
Last 12 Months: 13.3
Historical Average: 15.6
Percentile Rank of Last 12 Months ℹ️
High: 96th percentile
Low: 81st percentile
Rain: 31st percentile
Change in Variance ℹ️
High: +2.3%
Low: +4.9%
Intraday: -16.1%
Data Coverage
68.4%
First Year of Data
1945
Station Location
Historical Weather Records
| Max High | Avg High | Min High | Max Avg | Avg Avg | Min Avg | Max Low | Avg Low | Min Low | Max Precipitation | Avg Precipitation | Max Snow | Avg Snow | |
|---|---|---|---|---|---|---|---|---|---|---|---|---|---|
| Record | 113.72 °F | — | 41.72 °F | 96.96 °F | — | 38.48 °F | 83.84 °F | — | 24.80 °F | 3.23 in | — | — | — |
| January | 80.96 °F | 61.45 °F | 41.72 °F | 68.54 °F | 52.18 °F | 38.48 °F | 60.98 °F | 45.11 °F | 28.40 °F | 3.07 in | 0.12 in | — | — |
| February | 86.00 °F | 62.42 °F | 42.80 °F | 72.14 °F | 52.84 °F | 38.48 °F | 60.98 °F | 44.85 °F | 26.60 °F | 1.89 in | 0.10 in | — | — |
| March | 96.80 °F | 65.42 °F | 48.20 °F | 75.92 °F | 55.76 °F | 43.16 °F | 66.02 °F | 47.15 °F | 31.82 °F | 2.56 in | 0.09 in | — | — |
| April | 95.00 °F | 69.12 °F | 51.80 °F | 77.18 °F | 59.34 °F | 47.12 °F | 68.00 °F | 50.31 °F | 33.80 °F | 1.73 in | 0.06 in | — | — |
| May | 104.00 °F | 75.05 °F | 53.60 °F | 82.58 °F | 65.27 °F | 52.52 °F | 72.27 °F | 55.69 °F | 37.04 °F | 1.79 in | 0.04 in | — | — |
| June | 109.40 °F | 81.84 °F | 64.04 °F | 90.50 °F | 72.09 °F | 59.18 °F | 79.14 °F | 61.99 °F | 39.20 °F | 1.33 in | 0.01 in | — | — |
| July | 113.72 °F | 87.25 °F | 73.40 °F | 96.96 °F | 77.27 °F | 65.66 °F | 82.71 °F | 66.75 °F | 51.80 °F | 0.49 in | 0.00 in | — | — |
| August | 111.56 °F | 88.21 °F | 75.20 °F | 95.18 °F | 78.23 °F | 67.46 °F | 83.84 °F | 68.42 °F | 51.80 °F | 0.56 in | 0.01 in | — | — |
| September | 108.14 °F | 84.14 °F | 66.20 °F | 91.58 °F | 74.23 °F | 60.62 °F | 78.80 °F | 65.43 °F | 45.14 °F | 1.38 in | 0.05 in | — | — |
| October | 105.80 °F | 78.57 °F | 55.40 °F | 87.62 °F | 68.15 °F | 49.64 °F | 76.28 °F | 59.62 °F | 43.70 °F | 1.77 in | 0.07 in | — | — |
| November | 91.40 °F | 69.82 °F | 48.20 °F | 76.28 °F | 59.84 °F | 40.64 °F | 69.80 °F | 52.46 °F | 32.00 °F | 3.23 in | 0.12 in | — | — |
| December | 84.20 °F | 63.69 °F | 48.20 °F | 69.44 °F | 54.22 °F | 42.44 °F | 62.24 °F | 47.42 °F | 24.80 °F | 2.52 in | 0.13 in | — | — |
Data Visualisations
Remove WatermarksCurrent Year Climate Trends vs Historical


Max Temperature this Year | 1 of 6
Climate 12-Month Moving Averages


Max Temperature 12-Month MA | 1 of 6
Daily Data Points and Averages Throughout the Year


Average Max Temperature Throughout Year | 1 of 5
