Climate for Station: Mohamed Boudiaf Intl, Constantine, Algeria
Loading live weather...
Climate Analysis & Overview
Mohamed Boudiaf International Airport is experiencing a warming trend, with recent decades showing a sharper rise in temperatures. Precipitation patterns have become more evenly distributed, aligning with Algeria's climate adaptation goals.
Continental Climate Dynamics
Situated in Constantine, Algeria, Mohamed Boudiaf International Airport falls under the Köppen climate classification of Csa, indicating a Mediterranean climate with hot, dry summers and mild, wet winters. The region's topography, characterized by surrounding mountains, plays a crucial role in modulating its climate, influencing both temperature and precipitation patterns. Over the past decade, the area has witnessed a significant warming trend, with average high temperatures increasing by 1.54°C (2.77°F) and lows by 1.08°C (1.94°F). This recent warming is more pronounced than the all-time trends, which show a rise of 0.48°C (0.86°F) in highs and 0.15°C (0.27°F) in lows. Such trends suggest a shift towards warmer conditions, a critical factor considering Algeria's commitment to climate resilience.
Temperature Extremes and Records
The climate extremes at Mohamed Boudiaf International Airport highlight the variability in its weather patterns. The station has recorded an absolute maximum temperature of 44.6°C (112.3°F), indicative of the intense heatwaves that can occur during summer months. Conversely, the minimum recorded temperature is a chilling -10.0°C (14.0°F), reflecting the potential for cold snaps, especially during winter. These extremes underscore the need for adaptive strategies to mitigate the impacts of such temperature fluctuations on infrastructure and daily life.
Precipitation Patterns and Distribution
The Precipitation Concentration Index (PCI) offers insights into rainfall distribution. A decrease from a baseline of 14.3 to a current value of 11.9 suggests precipitation has become more evenly distributed across the year. This change is beneficial for water management and agriculture, reducing the risk of flooding from concentrated rainfall events. Such a trend aligns with Algeria's regional climate goals to enhance water resource management and agricultural productivity.
Regional Climate Goals and Adaptation
Algeria's climate strategy focuses on adaptation and resilience to climate variability. The observed warming trends at Mohamed Boudiaf International Airport highlight the urgency of these efforts. By understanding and anticipating changes in temperature and precipitation, local authorities can better plan for sustainable development. The more even distribution of rainfall, as indicated by the PCI, supports these goals by potentially reducing the frequency of extreme weather events, thereby enhancing the region's capacity to adapt to a changing climate.
Station Statistics
10-Year Trend
High: +2.75 °F/decade
Low: +2.29 °F/decade
Rain: -0.007 in/decade
25-Year Trend
High: +0.89 °F/decade
Low: +0.31 °F/decade
Rain: -0.004 in/decade
50-Year Trend
High: +0.86 °F/decade
Low: +0.18 °F/decade
Rain: -0.003 in/decade
All-Time Trend
High: +0.87 °F/decade
Low: +0.28 °F/decade
Rain: -0.003 in/decade
Percentage Above-Average Days
Last 12 Months: 52.6%
This Year: 66.5%
Precipitation Concentration Index (PCI) ℹ️
Last 12 Months: 11.8
Historical Average: 14.1
Percentile Rank of Last 12 Months ℹ️
High: 91st percentile
Low: 89th percentile
Rain: 33rd percentile
Change in Variance ℹ️
High: +3.7%
Low: +8.4%
Intraday: +0.6%
Data Coverage
64.1%
First Year of Data
1943
Station Location
Historical Weather Records
| Max High | Avg High | Min High | Max Avg | Avg Avg | Min Avg | Max Low | Avg Low | Min Low | Max Precipitation | Avg Precipitation | Max Snow | Avg Snow | |
|---|---|---|---|---|---|---|---|---|---|---|---|---|---|
| Record | 112.28 °F | — | 32.00 °F | 96.44 °F | — | 24.62 °F | 82.40 °F | — | 14.00 °F | 2.76 in | — | — | — |
| January | 73.94 °F | 54.42 °F | 35.60 °F | 63.68 °F | 44.44 °F | 29.12 °F | 53.96 °F | 36.46 °F | 21.20 °F | 2.28 in | 0.09 in | — | — |
| February | 80.60 °F | 56.46 °F | 32.00 °F | 66.02 °F | 45.99 °F | 24.62 °F | 59.00 °F | 37.25 °F | 14.00 °F | 1.93 in | 0.08 in | — | — |
| March | 89.78 °F | 61.14 °F | 36.68 °F | 70.52 °F | 49.95 °F | 33.26 °F | 57.92 °F | 40.15 °F | 24.80 °F | 2.01 in | 0.08 in | — | — |
| April | 93.74 °F | 67.14 °F | 42.80 °F | 75.74 °F | 55.16 °F | 37.04 °F | 64.22 °F | 44.30 °F | 28.04 °F | 1.38 in | 0.07 in | — | — |
| May | 106.34 °F | 76.52 °F | 51.80 °F | 87.08 °F | 63.20 °F | 44.78 °F | 73.04 °F | 50.91 °F | 32.00 °F | 2.07 in | 0.06 in | — | — |
| June | 112.28 °F | 87.27 °F | 57.38 °F | 93.56 °F | 72.67 °F | 53.78 °F | 79.16 °F | 59.12 °F | 39.20 °F | 1.16 in | 0.02 in | — | — |
| July | 111.61 °F | 94.42 °F | 68.00 °F | 95.52 °F | 79.12 °F | 60.26 °F | 82.40 °F | 64.64 °F | 44.06 °F | 0.45 in | 0.01 in | — | — |
| August | 111.20 °F | 93.53 °F | 68.00 °F | 96.44 °F | 78.36 °F | 60.80 °F | 81.50 °F | 64.91 °F | 50.00 °F | 1.15 in | 0.02 in | — | — |
| September | 106.34 °F | 84.33 °F | 56.30 °F | 88.52 °F | 70.78 °F | 53.24 °F | 75.58 °F | 59.74 °F | 44.60 °F | 1.30 in | 0.04 in | — | — |
| October | 98.96 °F | 74.99 °F | 48.20 °F | 83.48 °F | 62.65 °F | 42.98 °F | 69.80 °F | 52.45 °F | 35.60 °F | 1.57 in | 0.05 in | — | — |
| November | 84.20 °F | 63.16 °F | 35.60 °F | 68.54 °F | 52.53 °F | 32.36 °F | 60.98 °F | 44.02 °F | 24.80 °F | 1.69 in | 0.07 in | — | — |
| December | 77.54 °F | 56.10 °F | 37.40 °F | 62.24 °F | 46.22 °F | 32.72 °F | 55.40 °F | 38.67 °F | 23.00 °F | 2.76 in | 0.09 in | — | — |
Data Visualisations
Remove WatermarksCurrent Year Climate Trends vs Historical


Max Temperature this Year | 1 of 6
Climate 12-Month Moving Averages


Max Temperature 12-Month MA | 1 of 6
Daily Data Points and Averages Throughout the Year


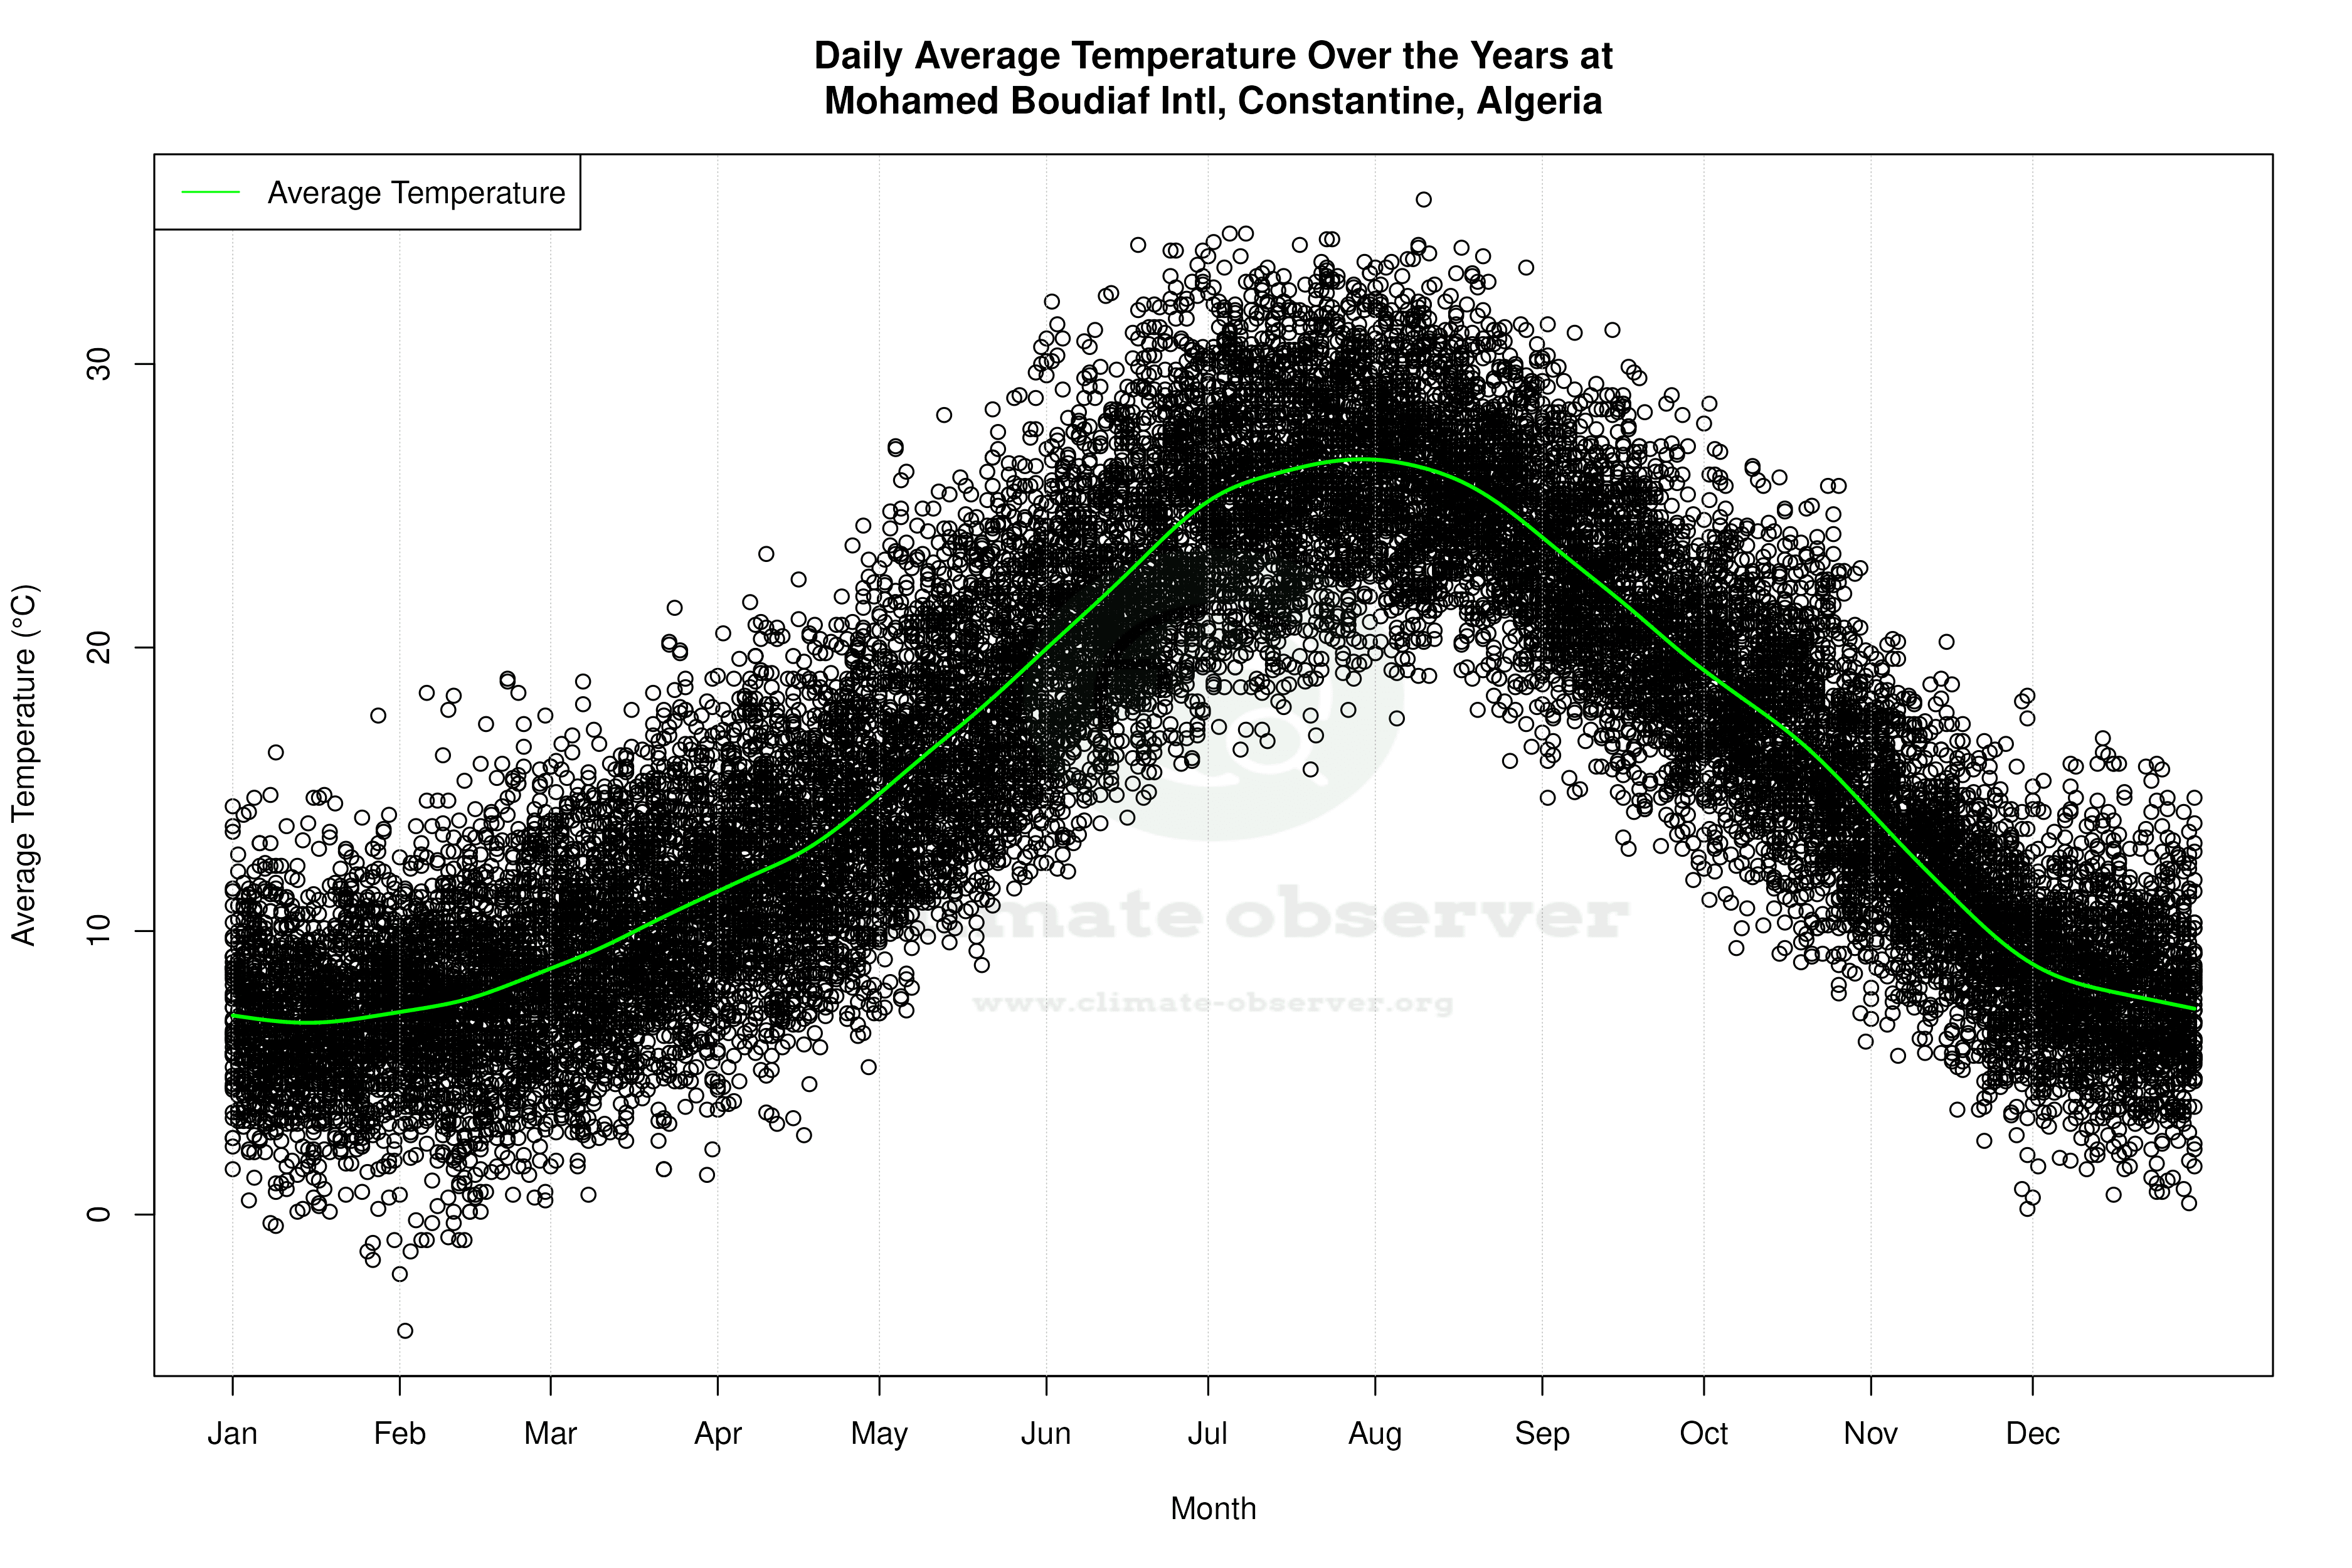


Average Max Temperature Throughout Year | 1 of 5
