Climate for Station: La Rioja Aero., La Rioja, Argentina
Loading live weather...
Climate Analysis & Overview
La Rioja Aero, located in Argentina's arid northwest, is experiencing a warming trend, with significant temperature increases in the past decade. The region's climate is marked by concentrated precipitation events, which could pose challenges for agriculture and water management.
Arid Climate Dynamics
La Rioja Aero is situated in the arid region of Argentina, classified under the Köppen climate system as BWh, indicating a hot desert climate. The surrounding geography, including the Andes Mountains to the west, significantly influences local weather patterns by creating a rain shadow effect, leading to low precipitation levels. This geographical setup contributes to the region's characteristic dry conditions and temperature extremes.
Temperature Trends: A Decadal Surge
Over the past decade, La Rioja Aero has witnessed a notable warming trend. High temperatures have increased by 1.74°C (3.13°F), while low temperatures have risen by 0.59°C (1.06°F). This recent warming is more pronounced than the all-time trends, which show a more modest rise of 0.19°C (0.34°F) for highs and 0.08°C (0.14°F) for lows. The decadal surge suggests a significant shift in thermal patterns, potentially impacting local ecosystems and human activities.
Extreme Temperature Records
The station has recorded extreme temperatures, with a maximum of 50.4°C (122.7°F) and a minimum of -7.5°C (18.5°F). These records highlight the region's susceptibility to temperature extremes, a common feature of desert climates. Such extremes can exacerbate heat stress on both human populations and the natural environment, necessitating adaptive measures.
Precipitation Patterns: Concentrated Events
The Precipitation Concentration Index (PCI) at La Rioja Aero has increased from a baseline of 20.5 to a current value of 22.3. This indicates a more concentrated distribution of rainfall, meaning precipitation occurs in fewer, more intense events. A PCI value above 20 is considered highly concentrated, which can lead to challenges such as flash flooding and soil erosion, impacting agricultural productivity and water resource management.
Regional Climate Goals and Challenges
Argentina has been actively working towards regional climate goals, focusing on sustainable agriculture and water management. The increasing temperature trends and concentrated precipitation patterns in La Rioja Aero present challenges to these objectives. The region must adapt to these changes to ensure resilience against climate variability and to support its agricultural economy.
Station Statistics
10-Year Trend
High: +1.63 °F/decade
Low: -0.20 °F/decade
Rain: -0.029 in/decade
25-Year Trend
High: +0.70 °F/decade
Low: -0.32 °F/decade
Rain: -0.001 in/decade
50-Year Trend
High: +0.51 °F/decade
Low: -0.04 °F/decade
Rain: +0.003 in/decade
All-Time Trend
High: +0.17 °F/decade
Low: -0.00 °F/decade
Rain: +0.003 in/decade
Percentage Above-Average Days
Last 12 Months: 45.2%
This Year: 24.7%
Precipitation Concentration Index (PCI) ℹ️
Last 12 Months: 18.1
Historical Average: 22.4
Percentile Rank of Last 12 Months ℹ️
High: 59th percentile
Low: 42nd percentile
Rain: 45th percentile
Change in Variance ℹ️
High: +1.1%
Low: +14.6%
Intraday: -2.7%
Data Coverage
85.9%
First Year of Data
1956
Station Location
Historical Weather Records
| Max High | Avg High | Min High | Max Avg | Avg Avg | Min Avg | Max Low | Avg Low | Min Low | Max Precipitation | Avg Precipitation | Max Snow | Avg Snow | |
|---|---|---|---|---|---|---|---|---|---|---|---|---|---|
| Record | 122.72 °F | — | 35.35 °F | 102.38 °F | — | 34.34 °F | 87.08 °F | — | 18.50 °F | 14.96 in | — | — | — |
| January | 113.90 °F | 95.33 °F | 64.04 °F | 100.94 °F | 82.37 °F | 60.98 °F | 87.08 °F | 69.89 °F | 47.12 °F | 5.04 in | 0.14 in | — | — |
| February | 113.00 °F | 92.24 °F | 64.76 °F | 98.06 °F | 79.44 °F | 57.92 °F | 85.10 °F | 68.05 °F | 42.98 °F | 14.96 in | 0.13 in | — | — |
| March | 107.60 °F | 87.52 °F | 59.00 °F | 95.54 °F | 75.57 °F | 53.60 °F | 83.84 °F | 64.70 °F | 39.02 °F | 3.15 in | 0.09 in | — | — |
| April | 104.00 °F | 80.82 °F | 50.94 °F | 86.90 °F | 68.42 °F | 45.68 °F | 79.70 °F | 57.51 °F | 33.62 °F | 1.81 in | 0.04 in | — | — |
| May | 99.14 °F | 73.44 °F | 45.93 °F | 77.18 °F | 60.55 °F | 39.02 °F | 70.52 °F | 49.06 °F | 26.60 °F | 2.58 in | 0.01 in | — | — |
| June | 85.82 °F | 67.35 °F | 41.36 °F | 69.98 °F | 53.97 °F | 37.04 °F | 60.80 °F | 41.27 °F | 21.92 °F | 0.84 in | 0.00 in | — | — |
| July | 99.14 °F | 67.78 °F | 35.35 °F | 74.66 °F | 53.37 °F | 35.06 °F | 59.72 °F | 39.42 °F | 20.30 °F | 1.97 in | 0.01 in | — | — |
| August | 106.52 °F | 73.90 °F | 38.12 °F | 82.04 °F | 59.04 °F | 34.34 °F | 65.84 °F | 43.78 °F | 18.50 °F | 1.97 in | 0.00 in | — | — |
| September | 122.72 °F | 80.07 °F | 38.30 °F | 92.66 °F | 65.58 °F | 34.70 °F | 75.20 °F | 51.21 °F | 27.50 °F | 2.43 in | 0.01 in | — | — |
| October | 113.36 °F | 87.50 °F | 54.32 °F | 99.32 °F | 73.64 °F | 49.64 °F | 83.12 °F | 59.71 °F | 32.00 °F | 2.13 in | 0.02 in | — | — |
| November | 112.28 °F | 92.32 °F | 60.80 °F | 98.42 °F | 78.51 °F | 56.12 °F | 83.48 °F | 65.16 °F | 38.12 °F | 4.06 in | 0.04 in | — | — |
| December | 115.52 °F | 95.35 °F | 59.72 °F | 102.38 °F | 81.78 °F | 55.58 °F | 86.18 °F | 68.94 °F | 45.86 °F | 3.54 in | 0.10 in | — | — |
Data Visualisations
Remove WatermarksCurrent Year Climate Trends vs Historical
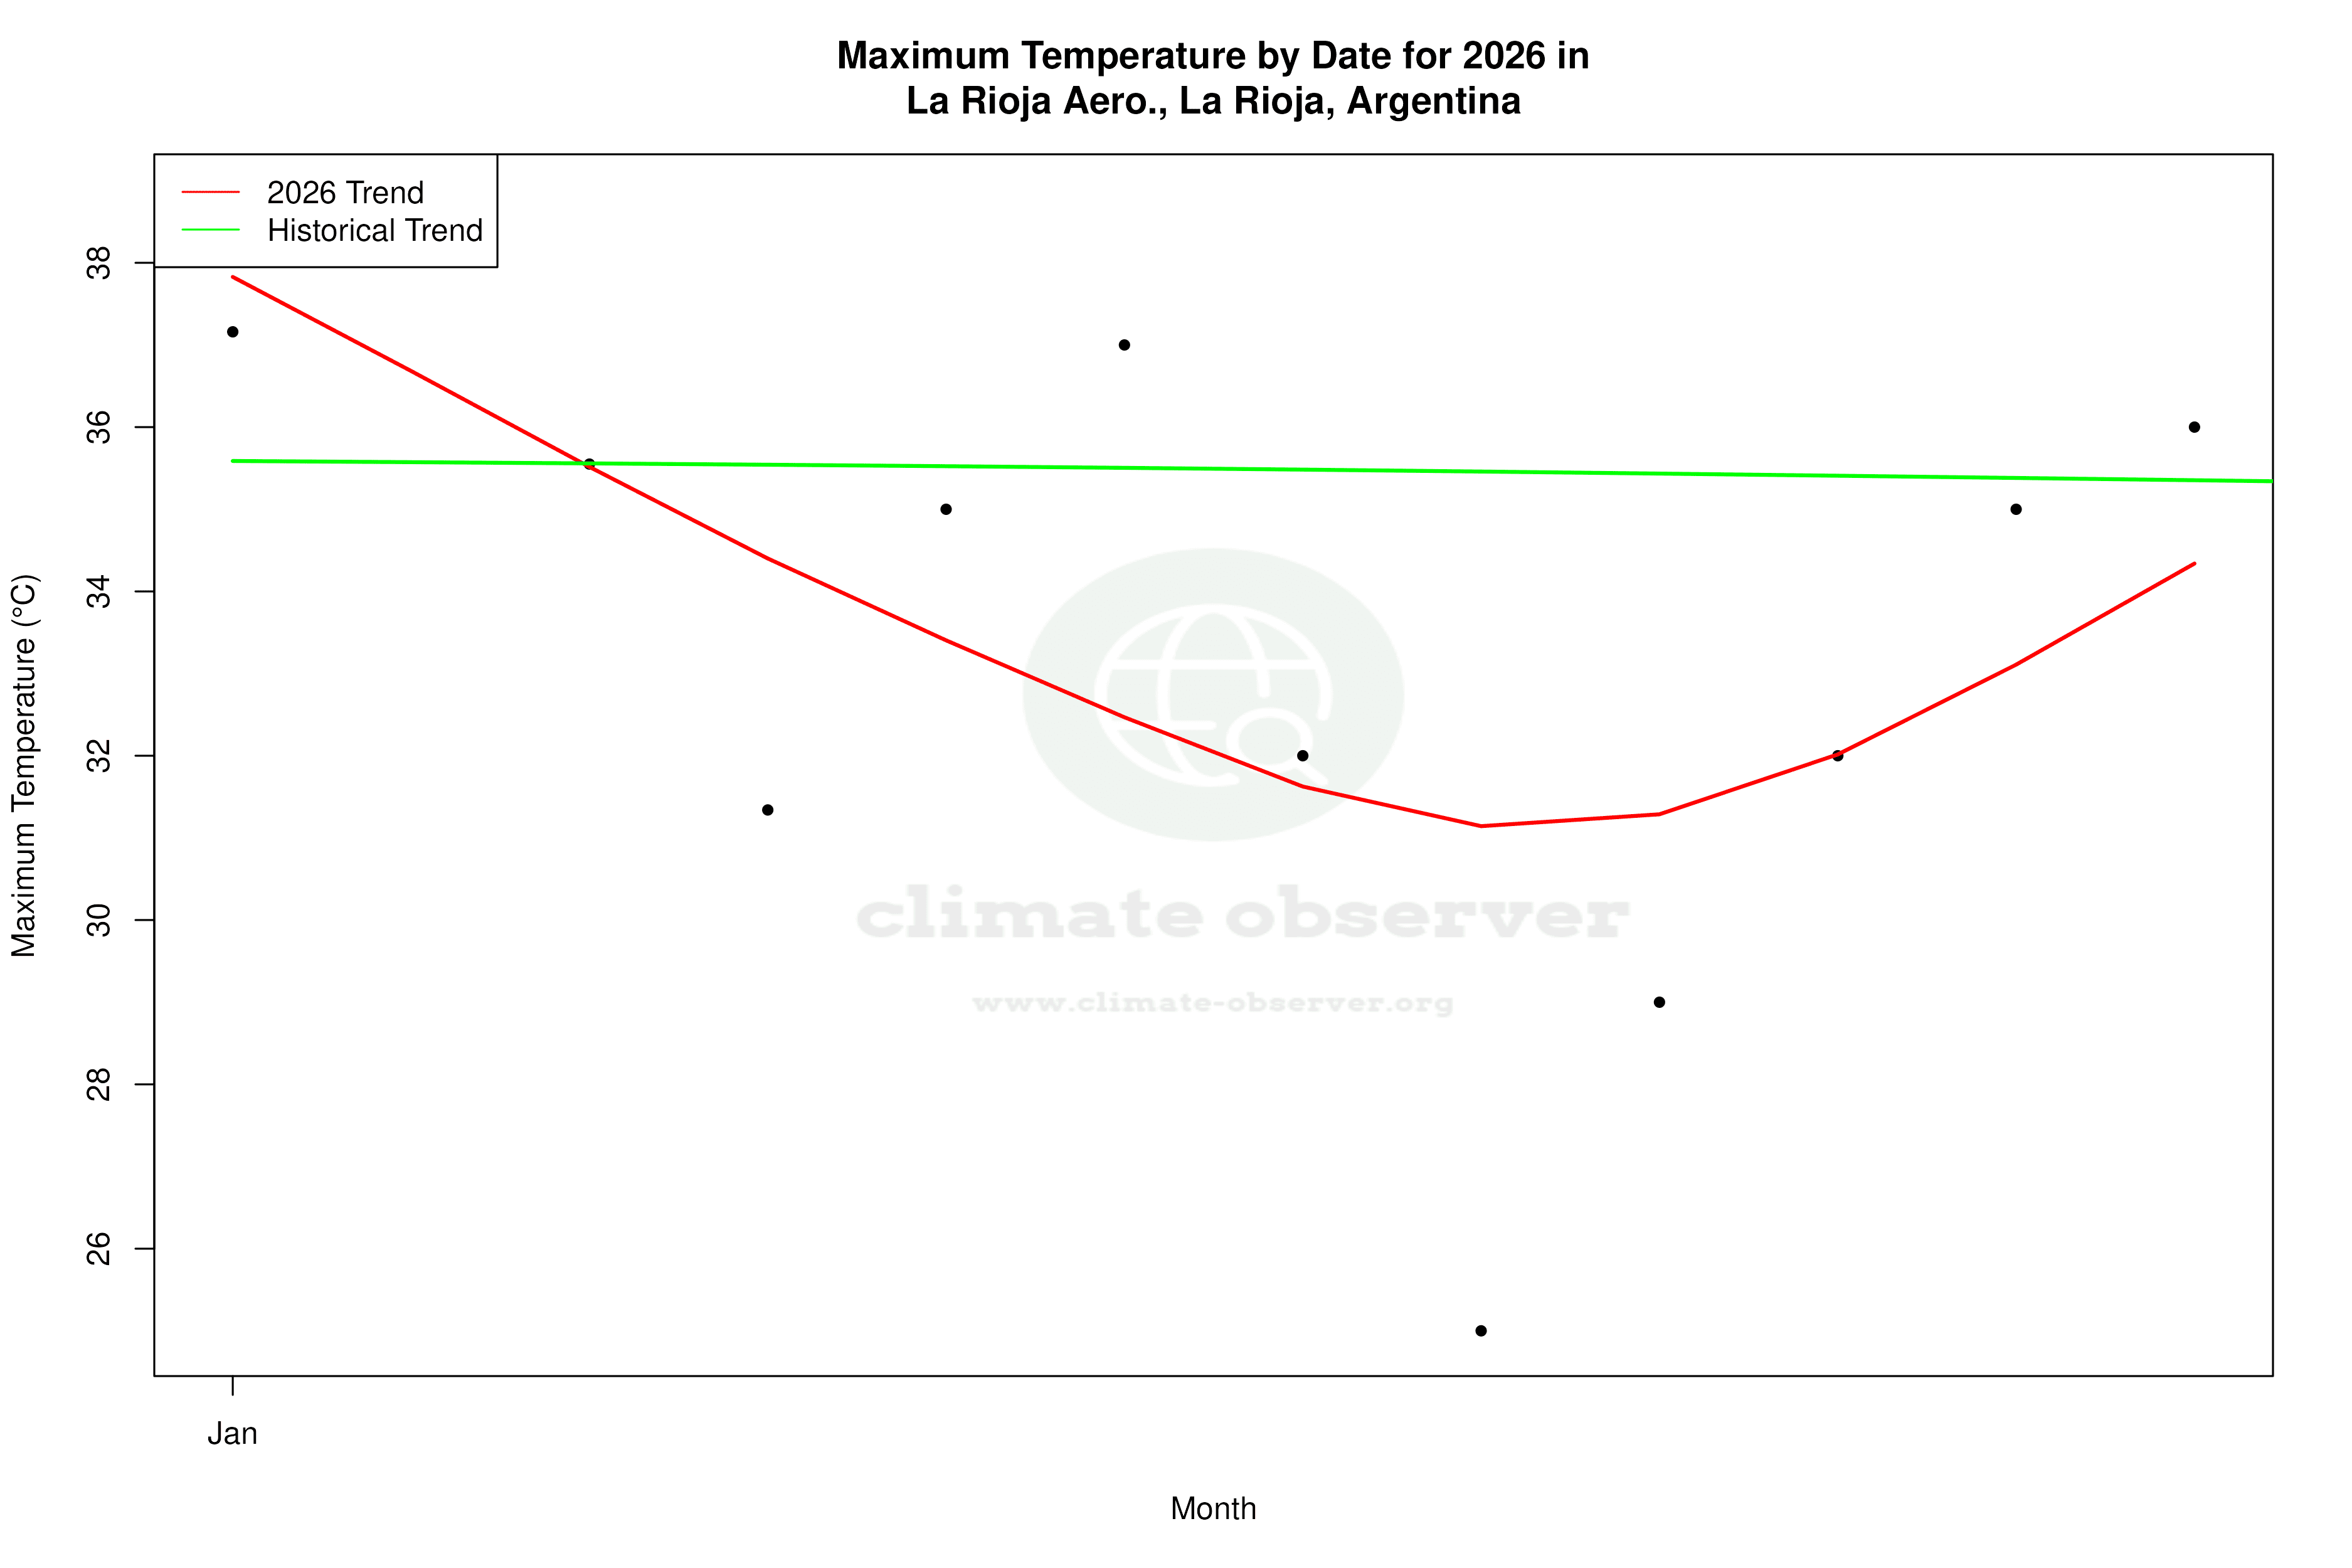


Max Temperature this Year | 1 of 6
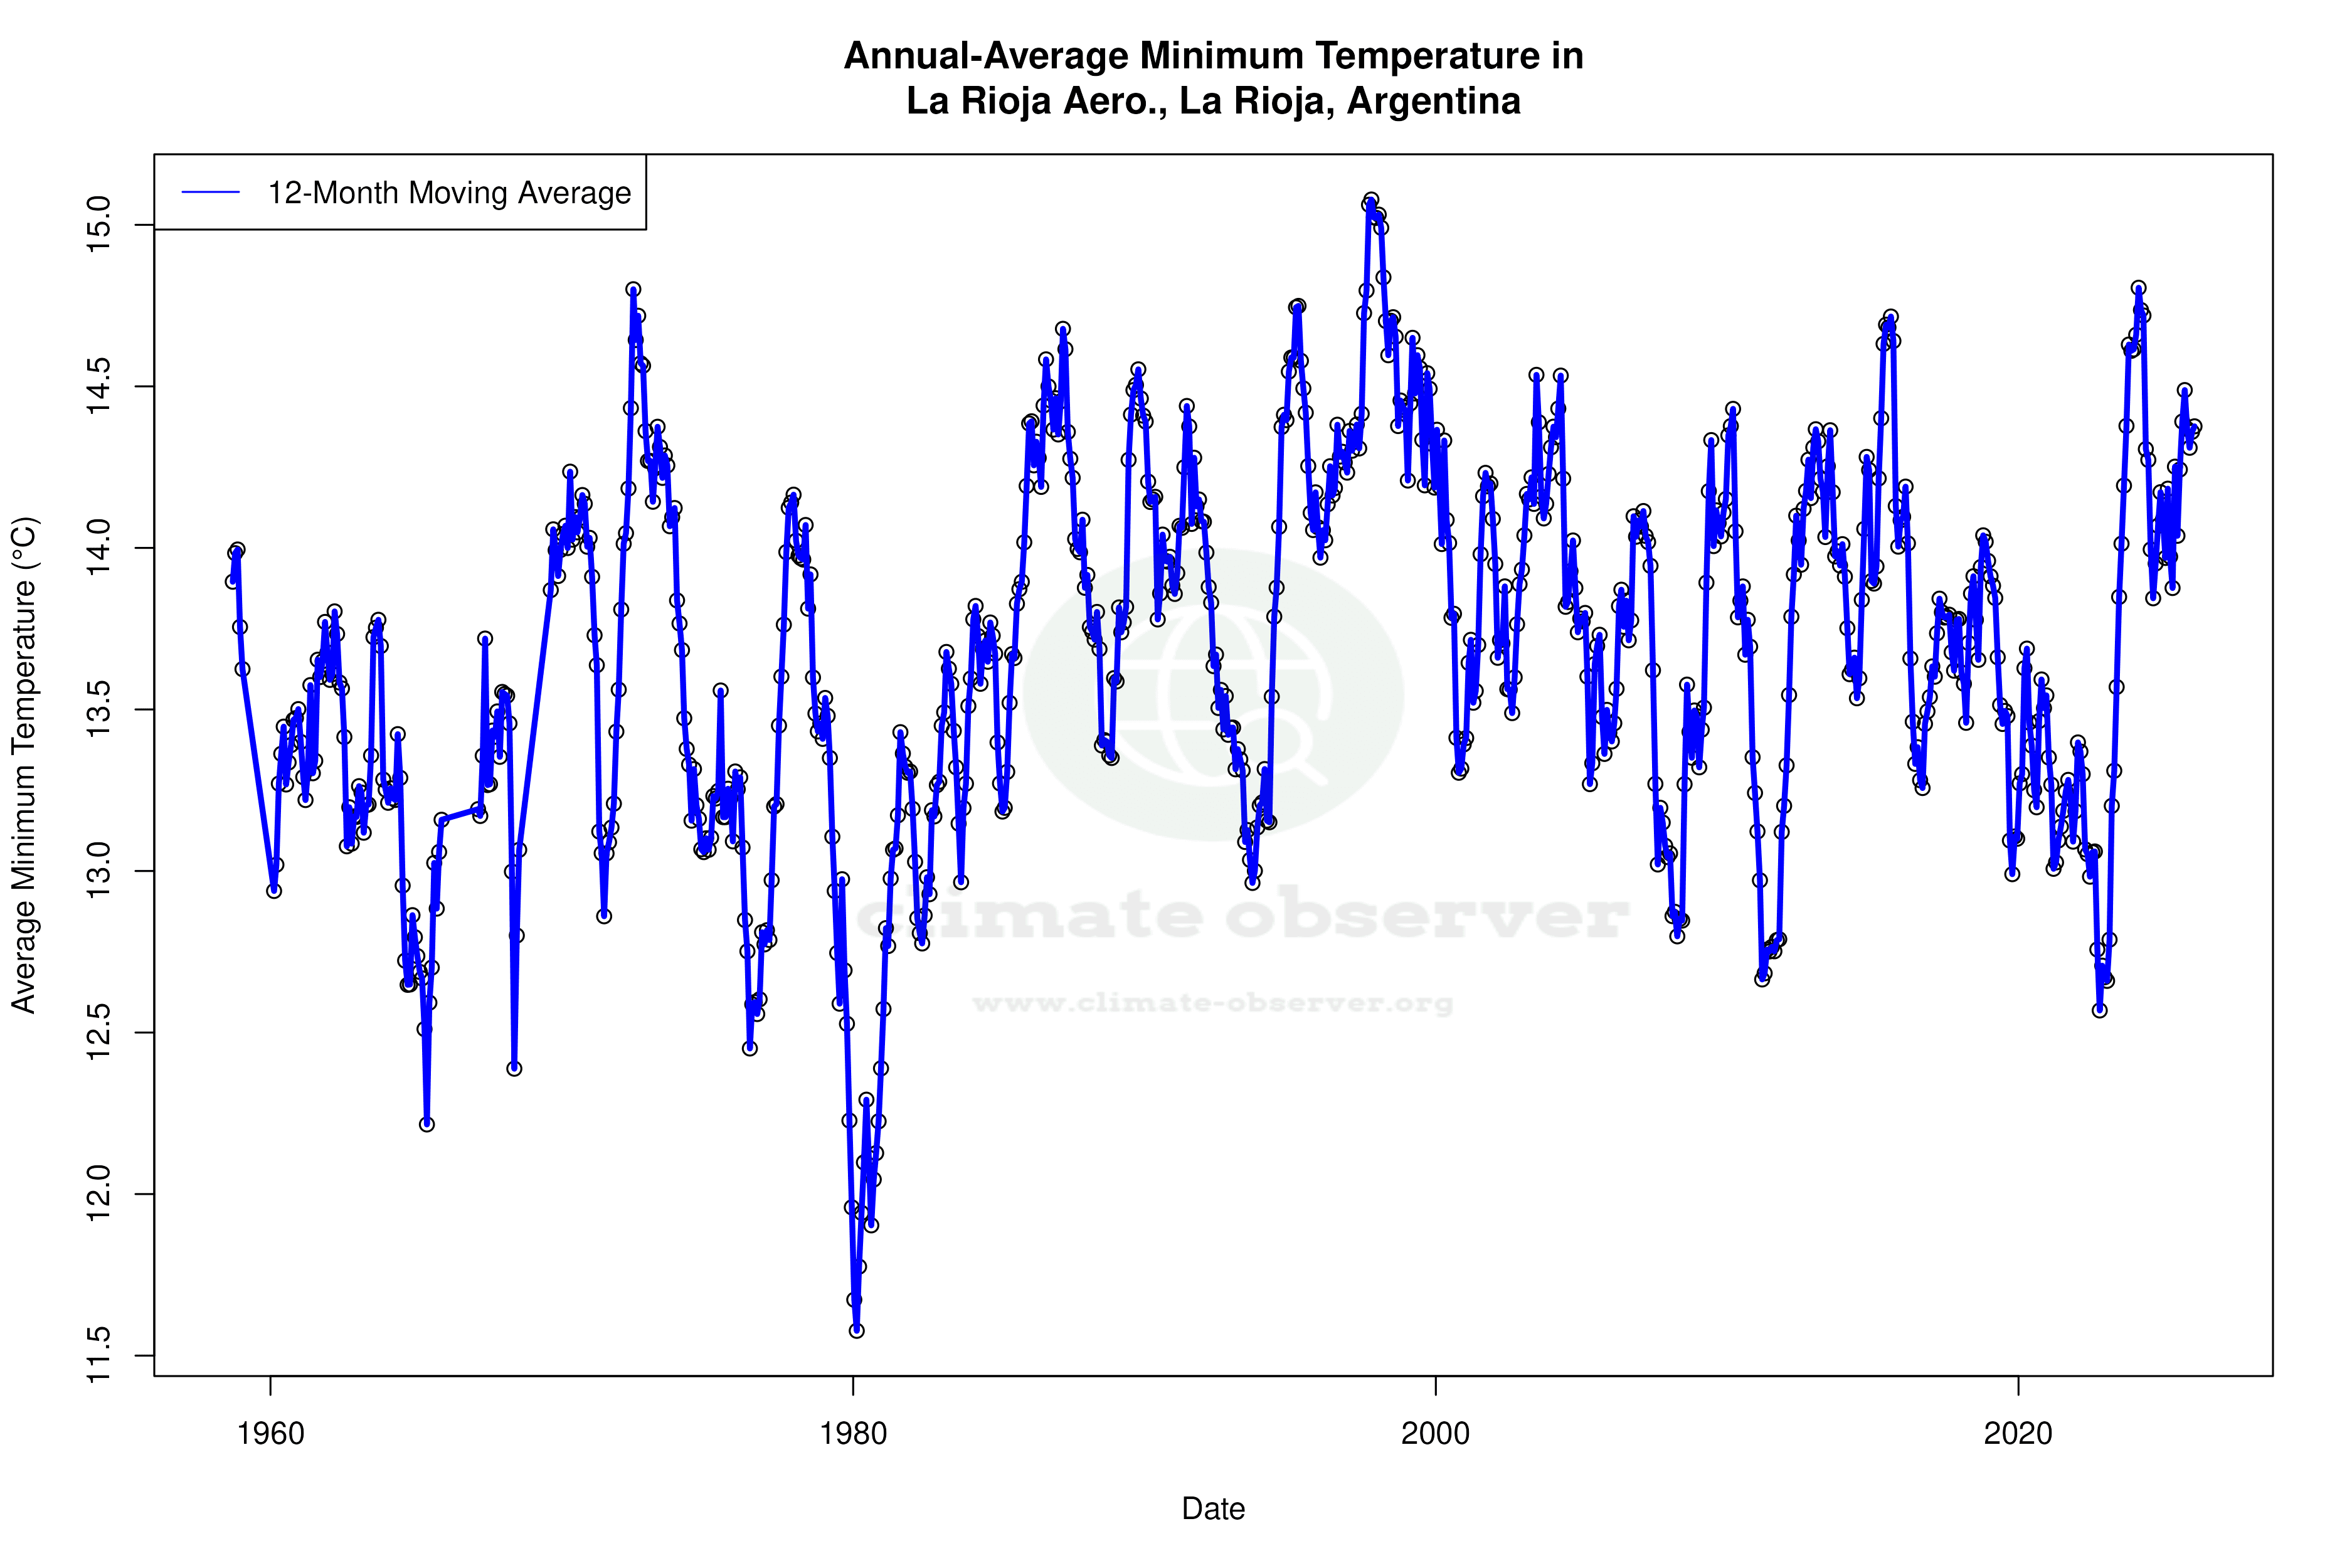
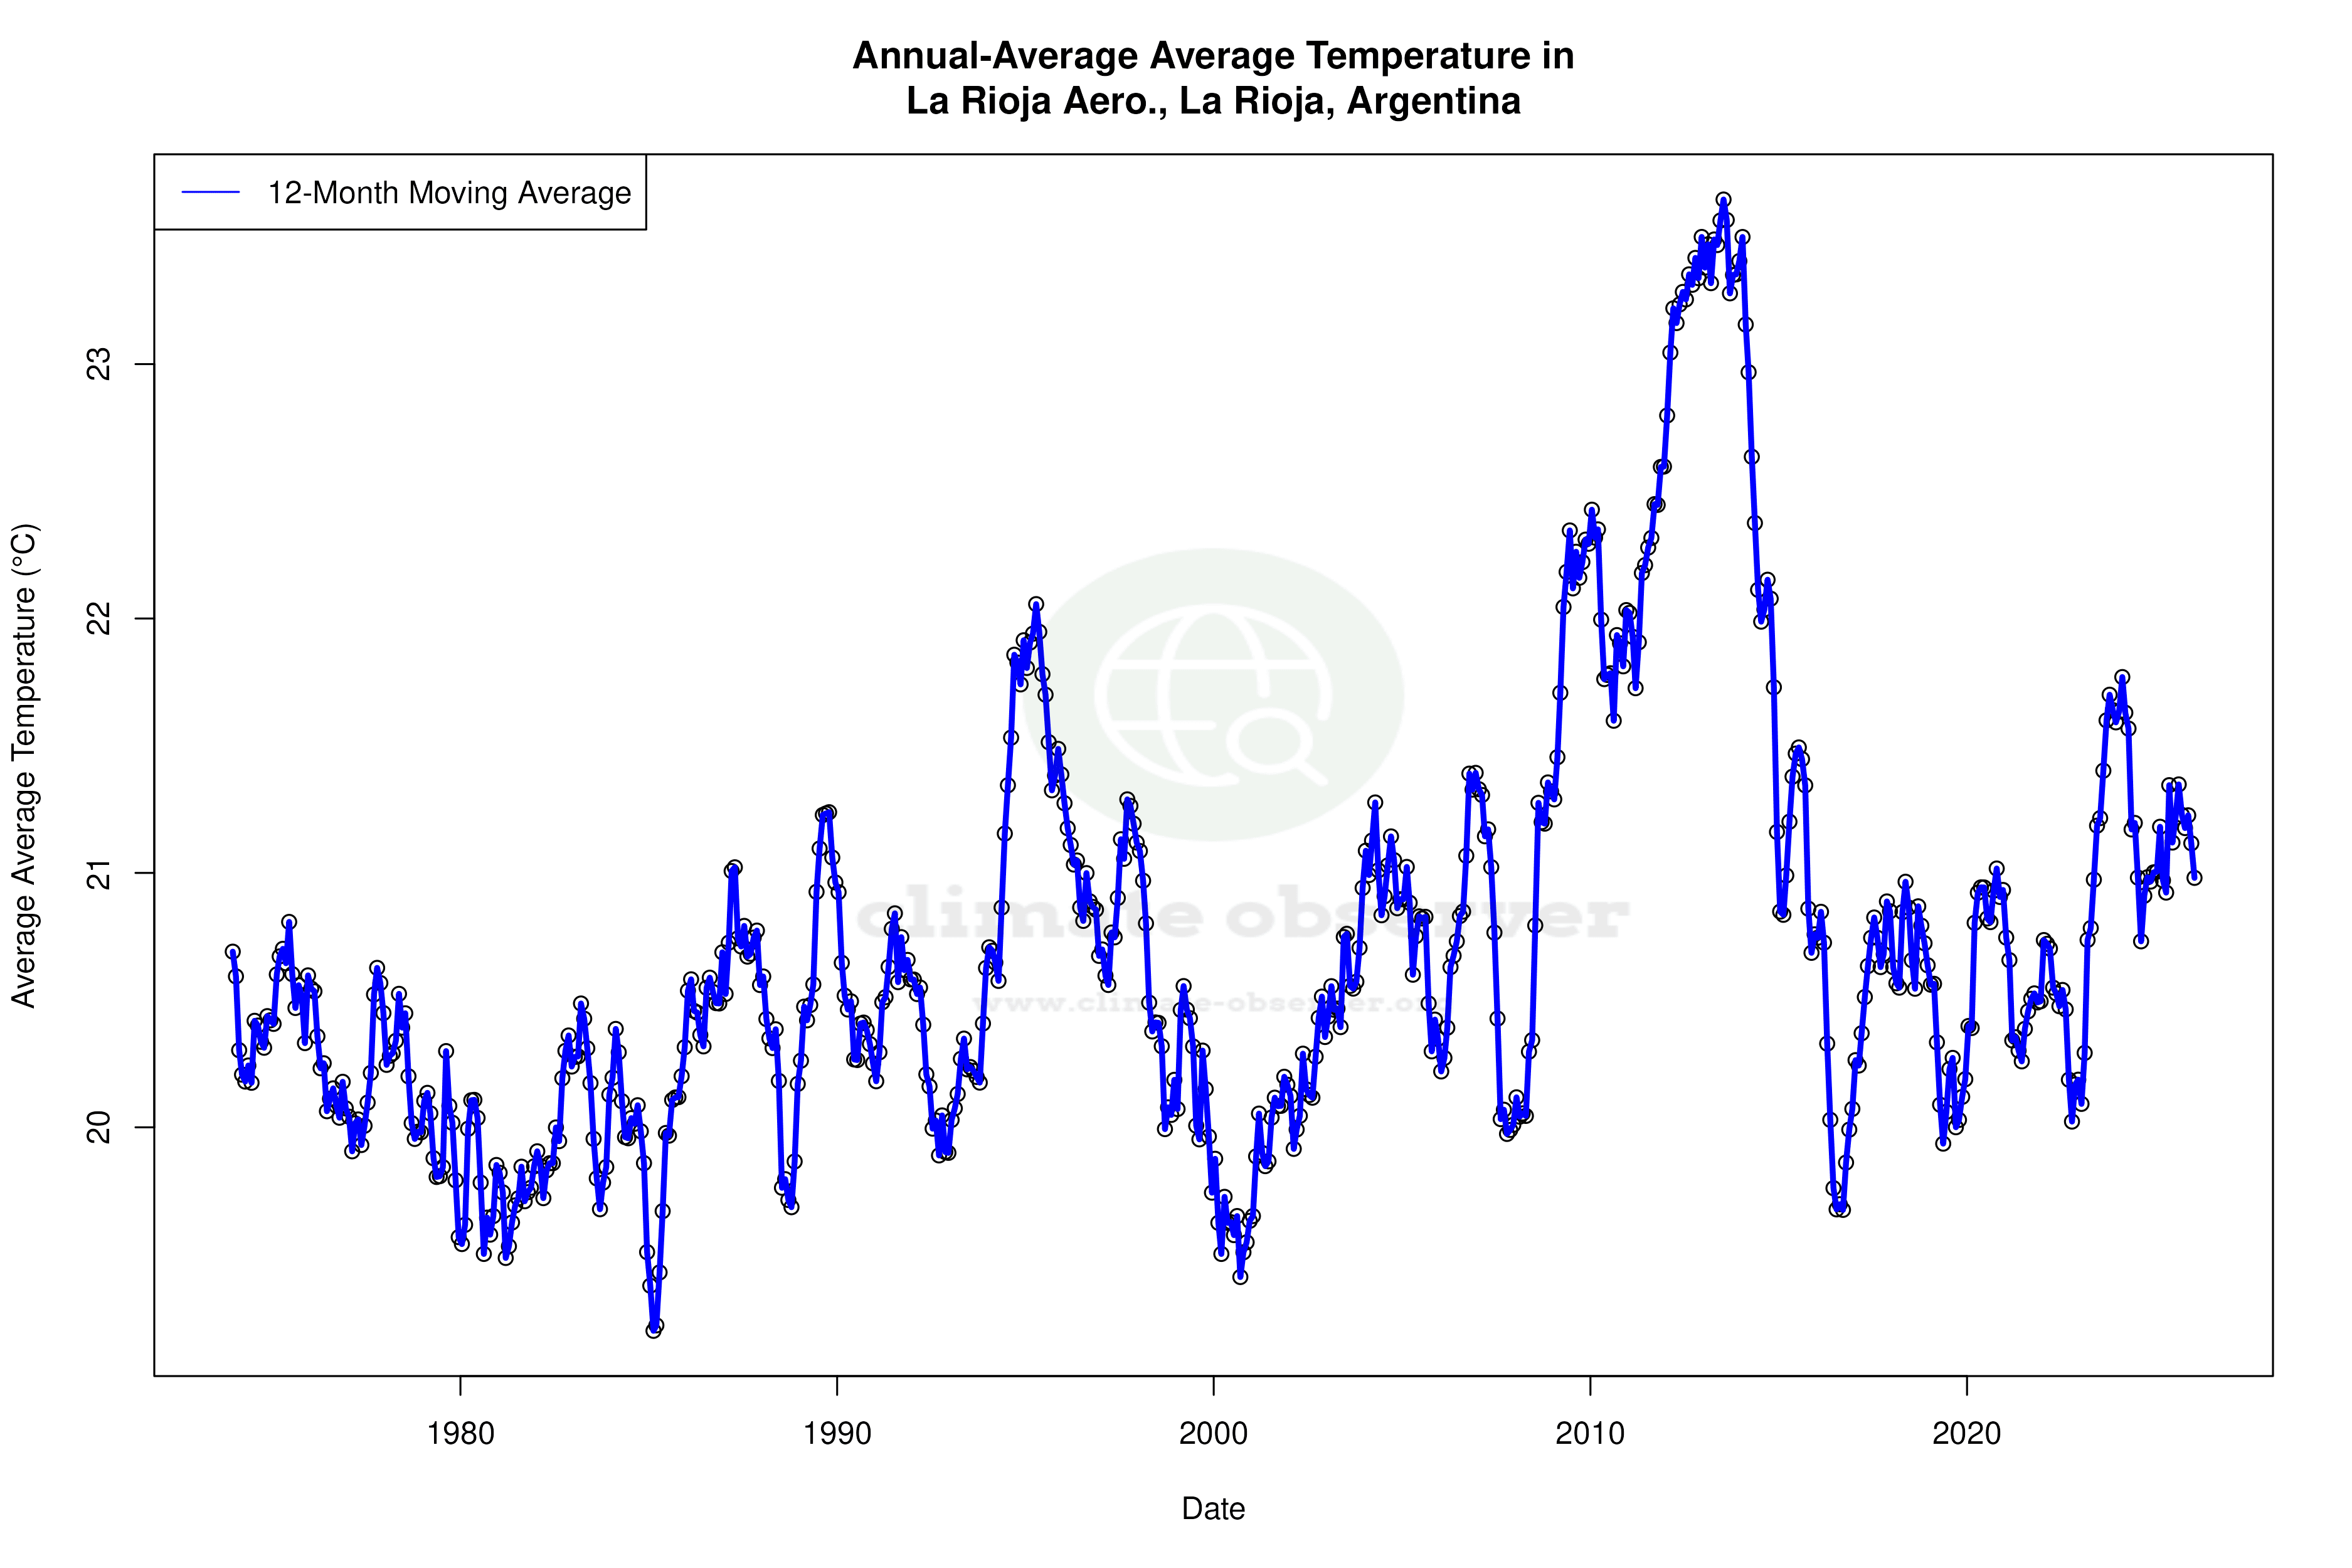
Climate 12-Month Moving Averages
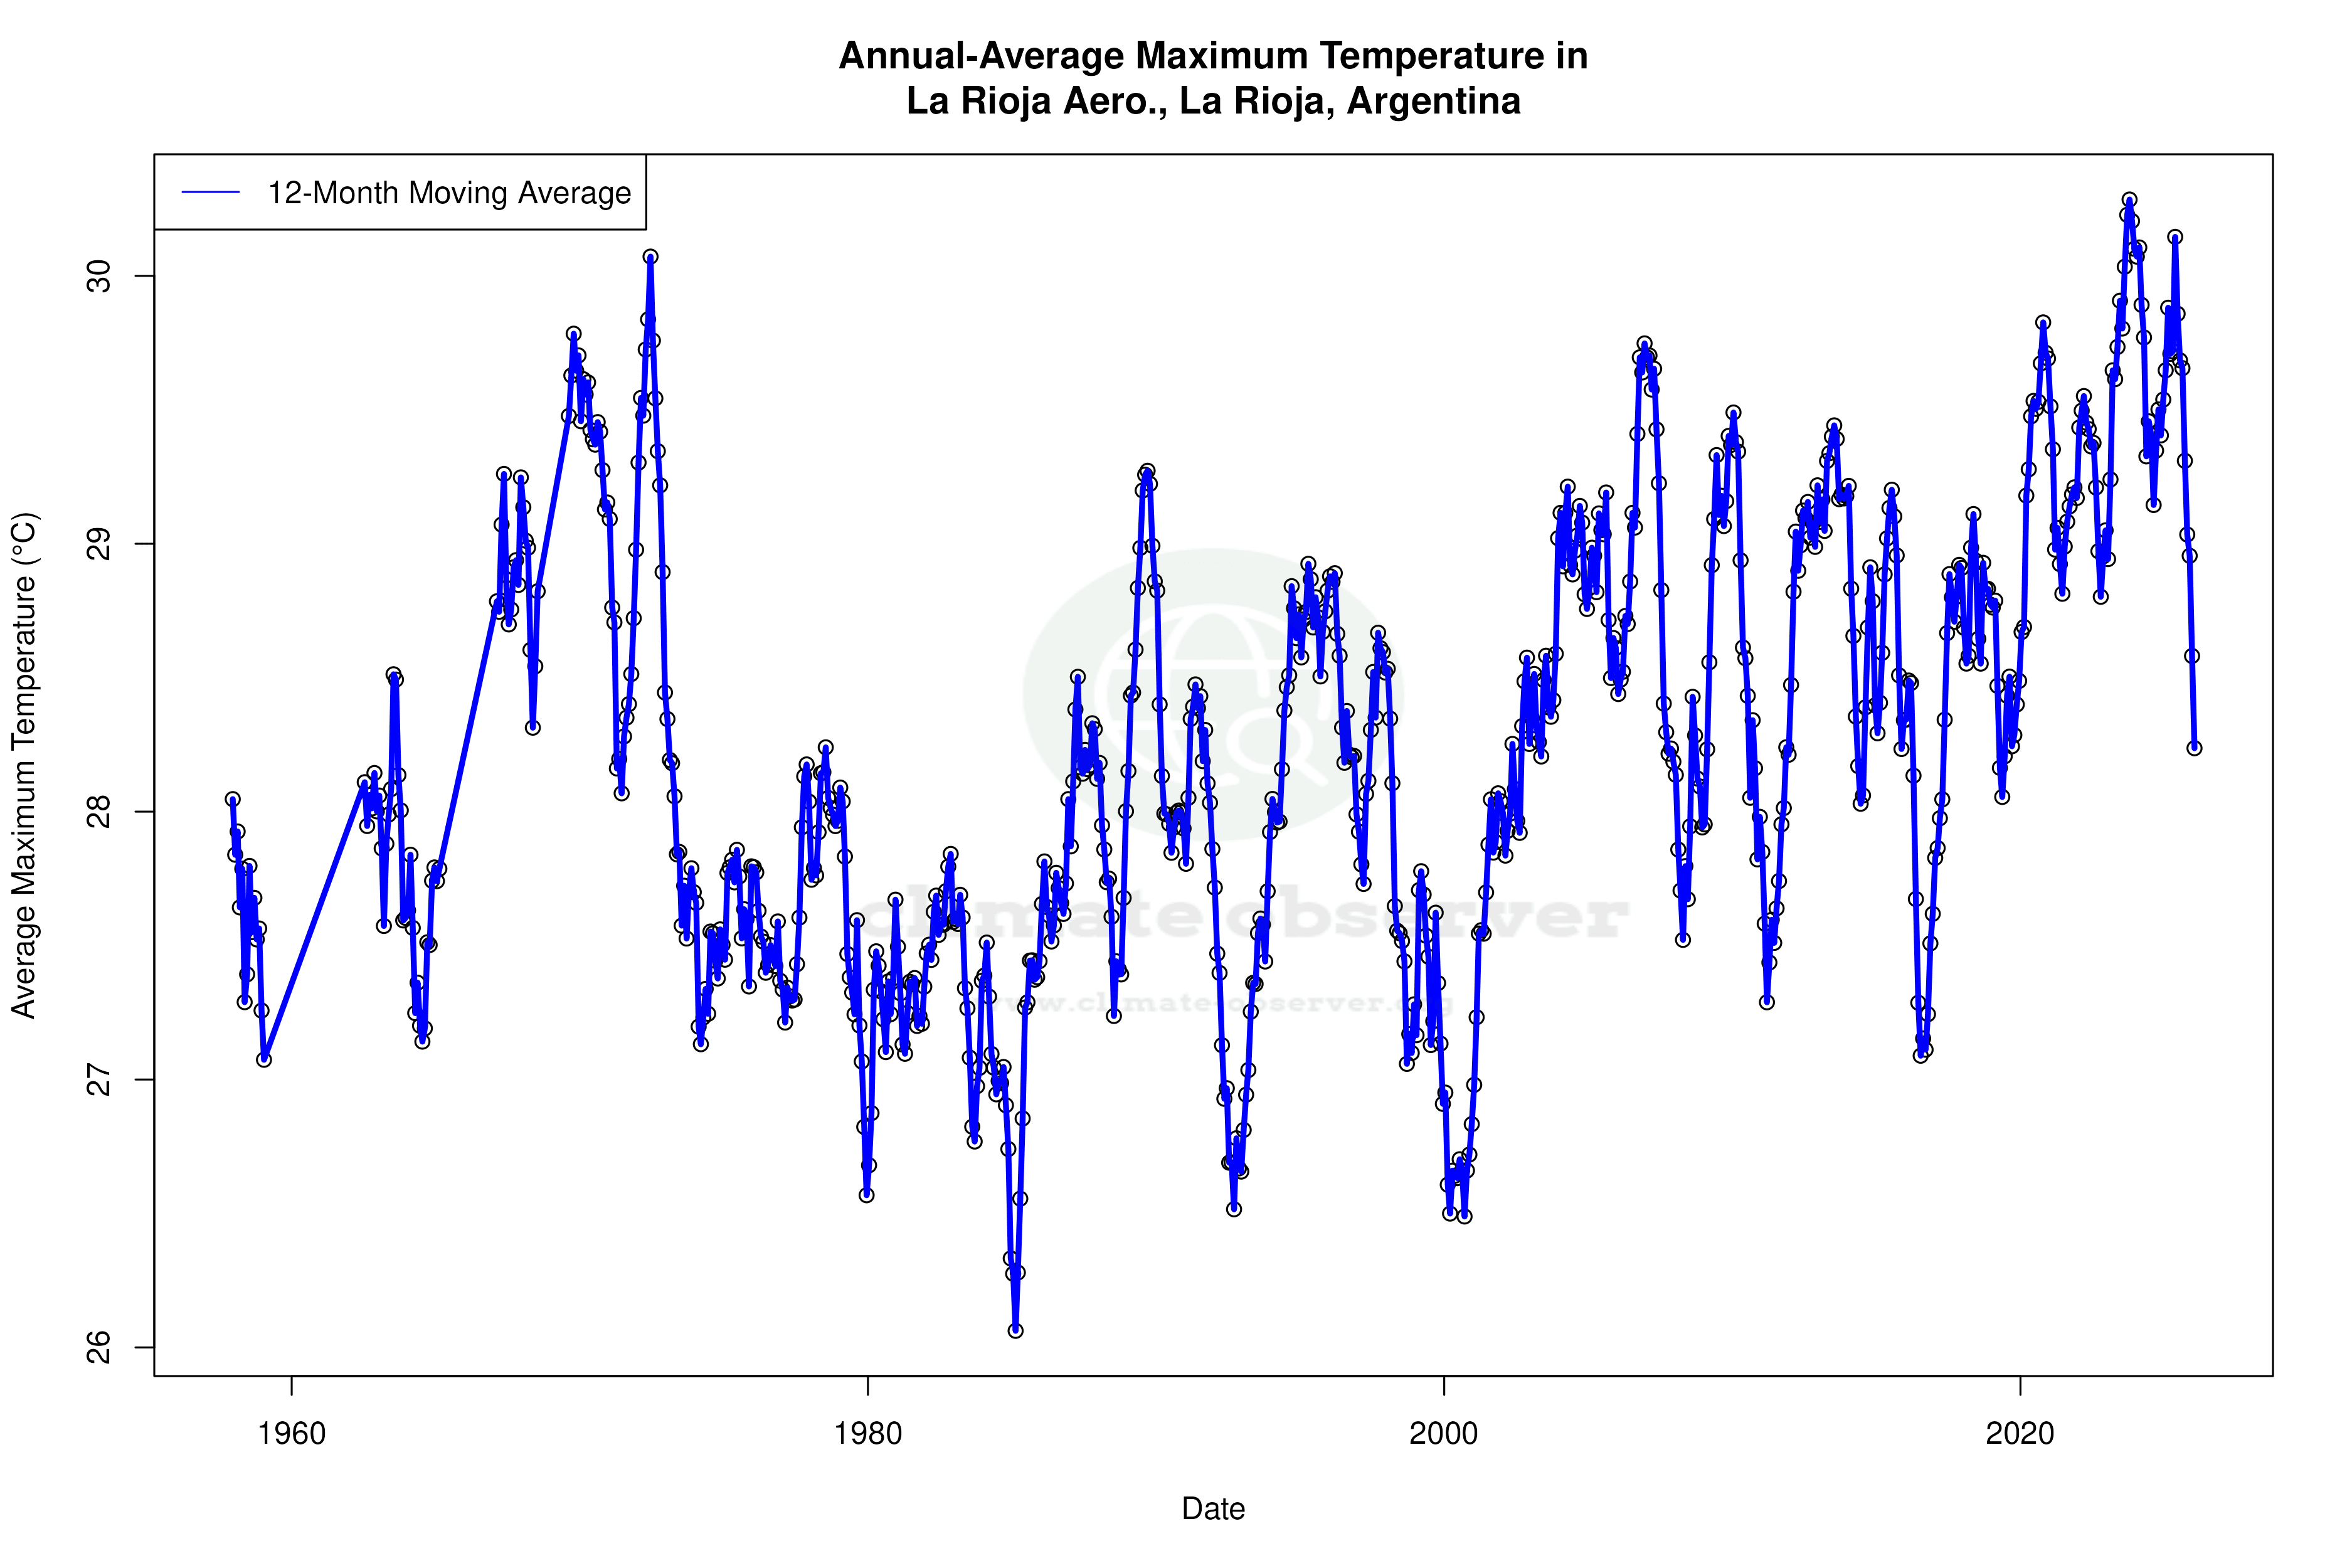


Max Temperature 12-Month MA | 1 of 6
Daily Data Points and Averages Throughout the Year


Average Max Temperature Throughout Year | 1 of 5
