Climate for Station: Cordoba Aero, Cordoba, Argentina
Loading live weather...
Climate Analysis & Overview
Córdoba Aero's climate is characterised by a warming trend in recent years, with notable increases in both high and low temperatures. While the all-time data shows a slight warming in highs and a cooling in lows, the last decade has seen more pronounced warming. Precipitation has become more evenly distributed, reflecting changes in the regional climate dynamics.
Córdoba's Climatic Context
Córdoba Aero is situated in the heart of Argentina, with coordinates -31.317, -64.217. The region falls under the Köppen climate classification of Cwa, which denotes a humid subtropical climate with dry winters. The local geography, including the Sierras de Córdoba, influences weather patterns by creating a rain shadow effect, leading to drier conditions in certain areas. This geographical setup plays a crucial role in the observed climatic trends.
Temperature Trends: A Decade of Change
Over the past decade, Córdoba Aero has experienced a significant warming trend. High temperatures have increased by 0.92°C (1.66°F), while low temperatures have risen by 0.77°C (1.38°F). This recent warming is more pronounced than the all-time trends, which show a more modest increase in high temperatures of 0.36°C (0.65°F) and a slight cooling in lows by 0.05°C (0.09°F). These trends suggest a shift towards warmer conditions, particularly in the last ten years.
Precipitation Patterns: A Shift Towards Even Distribution
The Precipitation Concentration Index (PCI) has decreased from a baseline of 15.88 to a current value of 12.23. This change indicates that precipitation events have become more evenly distributed throughout the year, as a lower PCI suggests less concentration of rainfall in fewer events. This shift could be attributed to broader regional climate changes, aligning with Argentina's goals to better understand and adapt to climate variability.
Temperature Extremes: Record Highs and Lows
Córdoba Aero has recorded an absolute maximum temperature of 42.4°C (108.3°F) and a minimum of -8.3°C (17.1°F). These extremes highlight the variability inherent in the region's climate. While the warming trends are evident, such records underscore the potential for significant temperature fluctuations that can impact both natural ecosystems and human activities.
Regional Implications and Future Considerations
The observed climatic changes at Córdoba Aero are reflective of broader patterns seen across Argentina. With the country's focus on addressing climate change impacts, understanding these localised trends is crucial for developing effective adaptation strategies. The recent even distribution of precipitation and the warming trends in temperatures provide valuable insights for regional planning and policy-making.
Station Statistics
10-Year Trend
High: +0.59 °F/decade
Low: +0.51 °F/decade
Rain: -0.039 in/decade
25-Year Trend
High: +1.18 °F/decade
Low: -1.46 °F/decade
Rain: -0.011 in/decade
50-Year Trend
High: +0.98 °F/decade
Low: -0.28 °F/decade
Rain: -0.000 in/decade
All-Time Trend
High: +0.65 °F/decade
Low: -0.08 °F/decade
Rain: +0.000 in/decade
Percentage Above-Average Days
Last 12 Months: 46.6%
This Year: 31.6%
Precipitation Concentration Index (PCI) ℹ️
Last 12 Months: 11.4
Historical Average: 16.2
Percentile Rank of Last 12 Months ℹ️
High: 60th percentile
Low: 19th percentile
Rain: 22nd percentile
Change in Variance ℹ️
High: -2.2%
Low: +17.7%
Intraday: +5.7%
Data Coverage
87.0%
First Year of Data
1956
Station Location
Historical Weather Records
| Max High | Avg High | Min High | Max Avg | Avg Avg | Min Avg | Max Low | Avg Low | Min Low | Max Precipitation | Avg Precipitation | Max Snow | Avg Snow | |
|---|---|---|---|---|---|---|---|---|---|---|---|---|---|
| Record | 108.32 °F | — | 39.56 °F | 94.64 °F | — | 32.00 °F | 79.16 °F | — | 17.06 °F | 5.71 in | — | — | — |
| January | 105.44 °F | 86.49 °F | 56.12 °F | 94.64 °F | 74.30 °F | 57.92 °F | 79.16 °F | 62.94 °F | 42.26 °F | 5.51 in | 0.18 in | — | — |
| February | 104.90 °F | 84.10 °F | 63.14 °F | 86.00 °F | 71.96 °F | 52.88 °F | 76.46 °F | 61.55 °F | 34.88 °F | 5.71 in | 0.20 in | — | — |
| March | 101.84 °F | 81.02 °F | 53.96 °F | 87.26 °F | 69.09 °F | 47.84 °F | 75.20 °F | 58.90 °F | 33.80 °F | 4.41 in | 0.15 in | — | — |
| April | 98.60 °F | 75.79 °F | 44.42 °F | 81.86 °F | 63.30 °F | 42.26 °F | 73.22 °F | 52.68 °F | 28.76 °F | 2.92 in | 0.09 in | — | — |
| May | 98.60 °F | 70.18 °F | 43.88 °F | 80.42 °F | 57.15 °F | 38.12 °F | 68.00 °F | 46.60 °F | 21.56 °F | 1.15 in | 0.03 in | — | — |
| June | 92.84 °F | 65.28 °F | 40.10 °F | 73.94 °F | 51.70 °F | 33.62 °F | 64.04 °F | 40.18 °F | 17.60 °F | 2.09 in | 0.01 in | — | — |
| July | 92.30 °F | 65.16 °F | 39.56 °F | 75.74 °F | 50.85 °F | 32.00 °F | 64.04 °F | 38.92 °F | 17.06 °F | 2.45 in | 0.01 in | — | — |
| August | 99.32 °F | 69.82 °F | 40.46 °F | 82.22 °F | 54.75 °F | 35.06 °F | 66.20 °F | 41.54 °F | 19.22 °F | 1.97 in | 0.01 in | — | — |
| September | 103.64 °F | 73.61 °F | 40.10 °F | 88.16 °F | 59.10 °F | 35.42 °F | 73.58 °F | 46.24 °F | 23.00 °F | 1.97 in | 0.04 in | — | — |
| October | 105.80 °F | 78.51 °F | 49.82 °F | 87.08 °F | 64.99 °F | 44.96 °F | 72.32 °F | 52.60 °F | 32.54 °F | 3.38 in | 0.09 in | — | — |
| November | 107.06 °F | 82.45 °F | 53.96 °F | 89.96 °F | 69.46 °F | 48.38 °F | 74.30 °F | 57.38 °F | 32.18 °F | 5.08 in | 0.16 in | — | — |
| December | 108.32 °F | 85.63 °F | 57.56 °F | 90.68 °F | 73.04 °F | 53.78 °F | 77.72 °F | 61.41 °F | 35.06 °F | 5.12 in | 0.19 in | — | — |
Data Visualisations
Remove WatermarksCurrent Year Climate Trends vs Historical


Max Temperature this Year | 1 of 6
Climate 12-Month Moving Averages


Max Temperature 12-Month MA | 1 of 6
Daily Data Points and Averages Throughout the Year

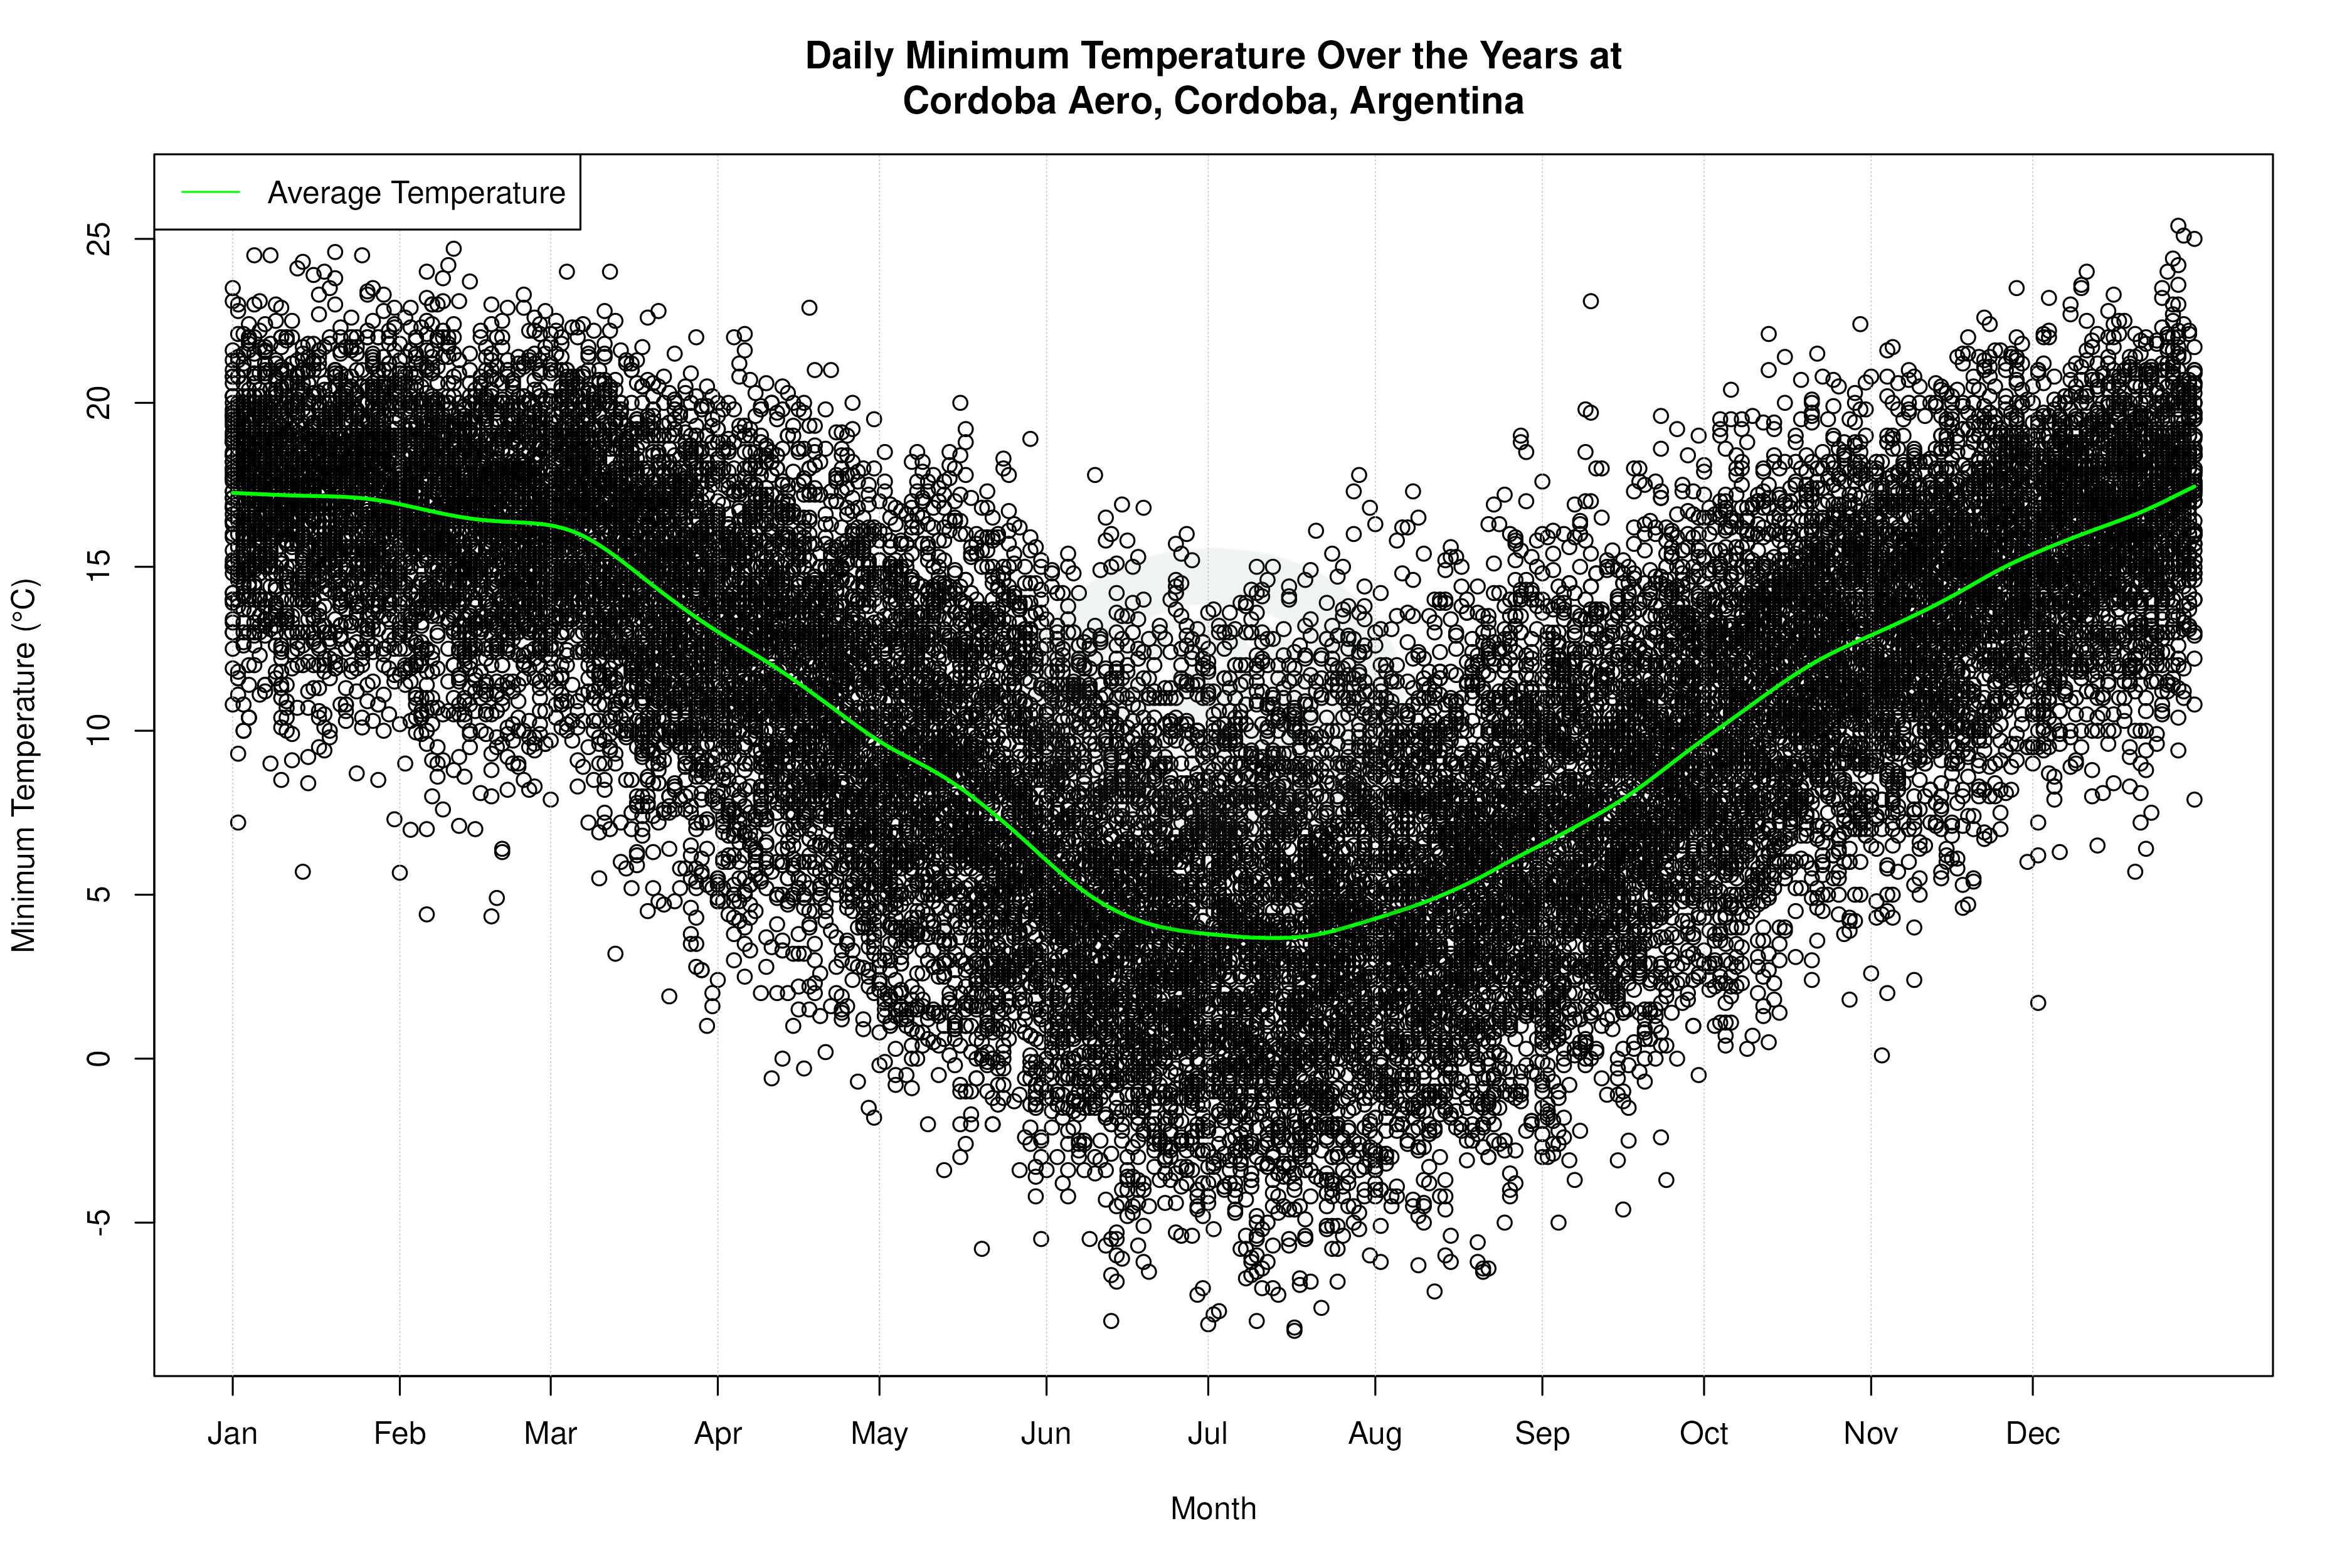


Average Max Temperature Throughout Year | 1 of 5
