Climate for Station: Rio Gallegos Aero, Santa Cruz, Argentina
Loading live weather...
Climate Analysis & Overview
Rio Gallegos Aero is experiencing a complex climate narrative with a long-term warming trend in high temperatures of 0.37°C (0.67°F), juxtaposed against a recent decade of slight cooling. The precipitation pattern has become more evenly distributed, suggesting a shift in local weather dynamics.
A Glimpse into the Climate of Rio Gallegos
Rio Gallegos, located in the southernmost reaches of Argentina, finds itself under the Köppen climate classification of a cold semi-arid climate (BSk). This region is characterised by its proximity to the southern Andes and the influence of the cold Antarctic currents. These geographical features contribute to its generally cool and dry conditions.
Temperature Trends: A Tale of Two Timelines
The climate data from Rio Gallegos Aero reveals a nuanced story. Over the long term, high temperatures have shown a warming trend of 0.37°C (0.67°F), while lows have experienced a slight cooling of 0.07°C (0.13°F). This warming in highs suggests a gradual rise in daytime temperatures, potentially linked to broader regional climate changes. However, the past decade tells a different tale, with both highs and lows experiencing a slight cooling trend of 0.13°C (0.23°F) and 0.14°C (0.25°F), respectively. This divergence could indicate short-term variability or localised climatic influences.
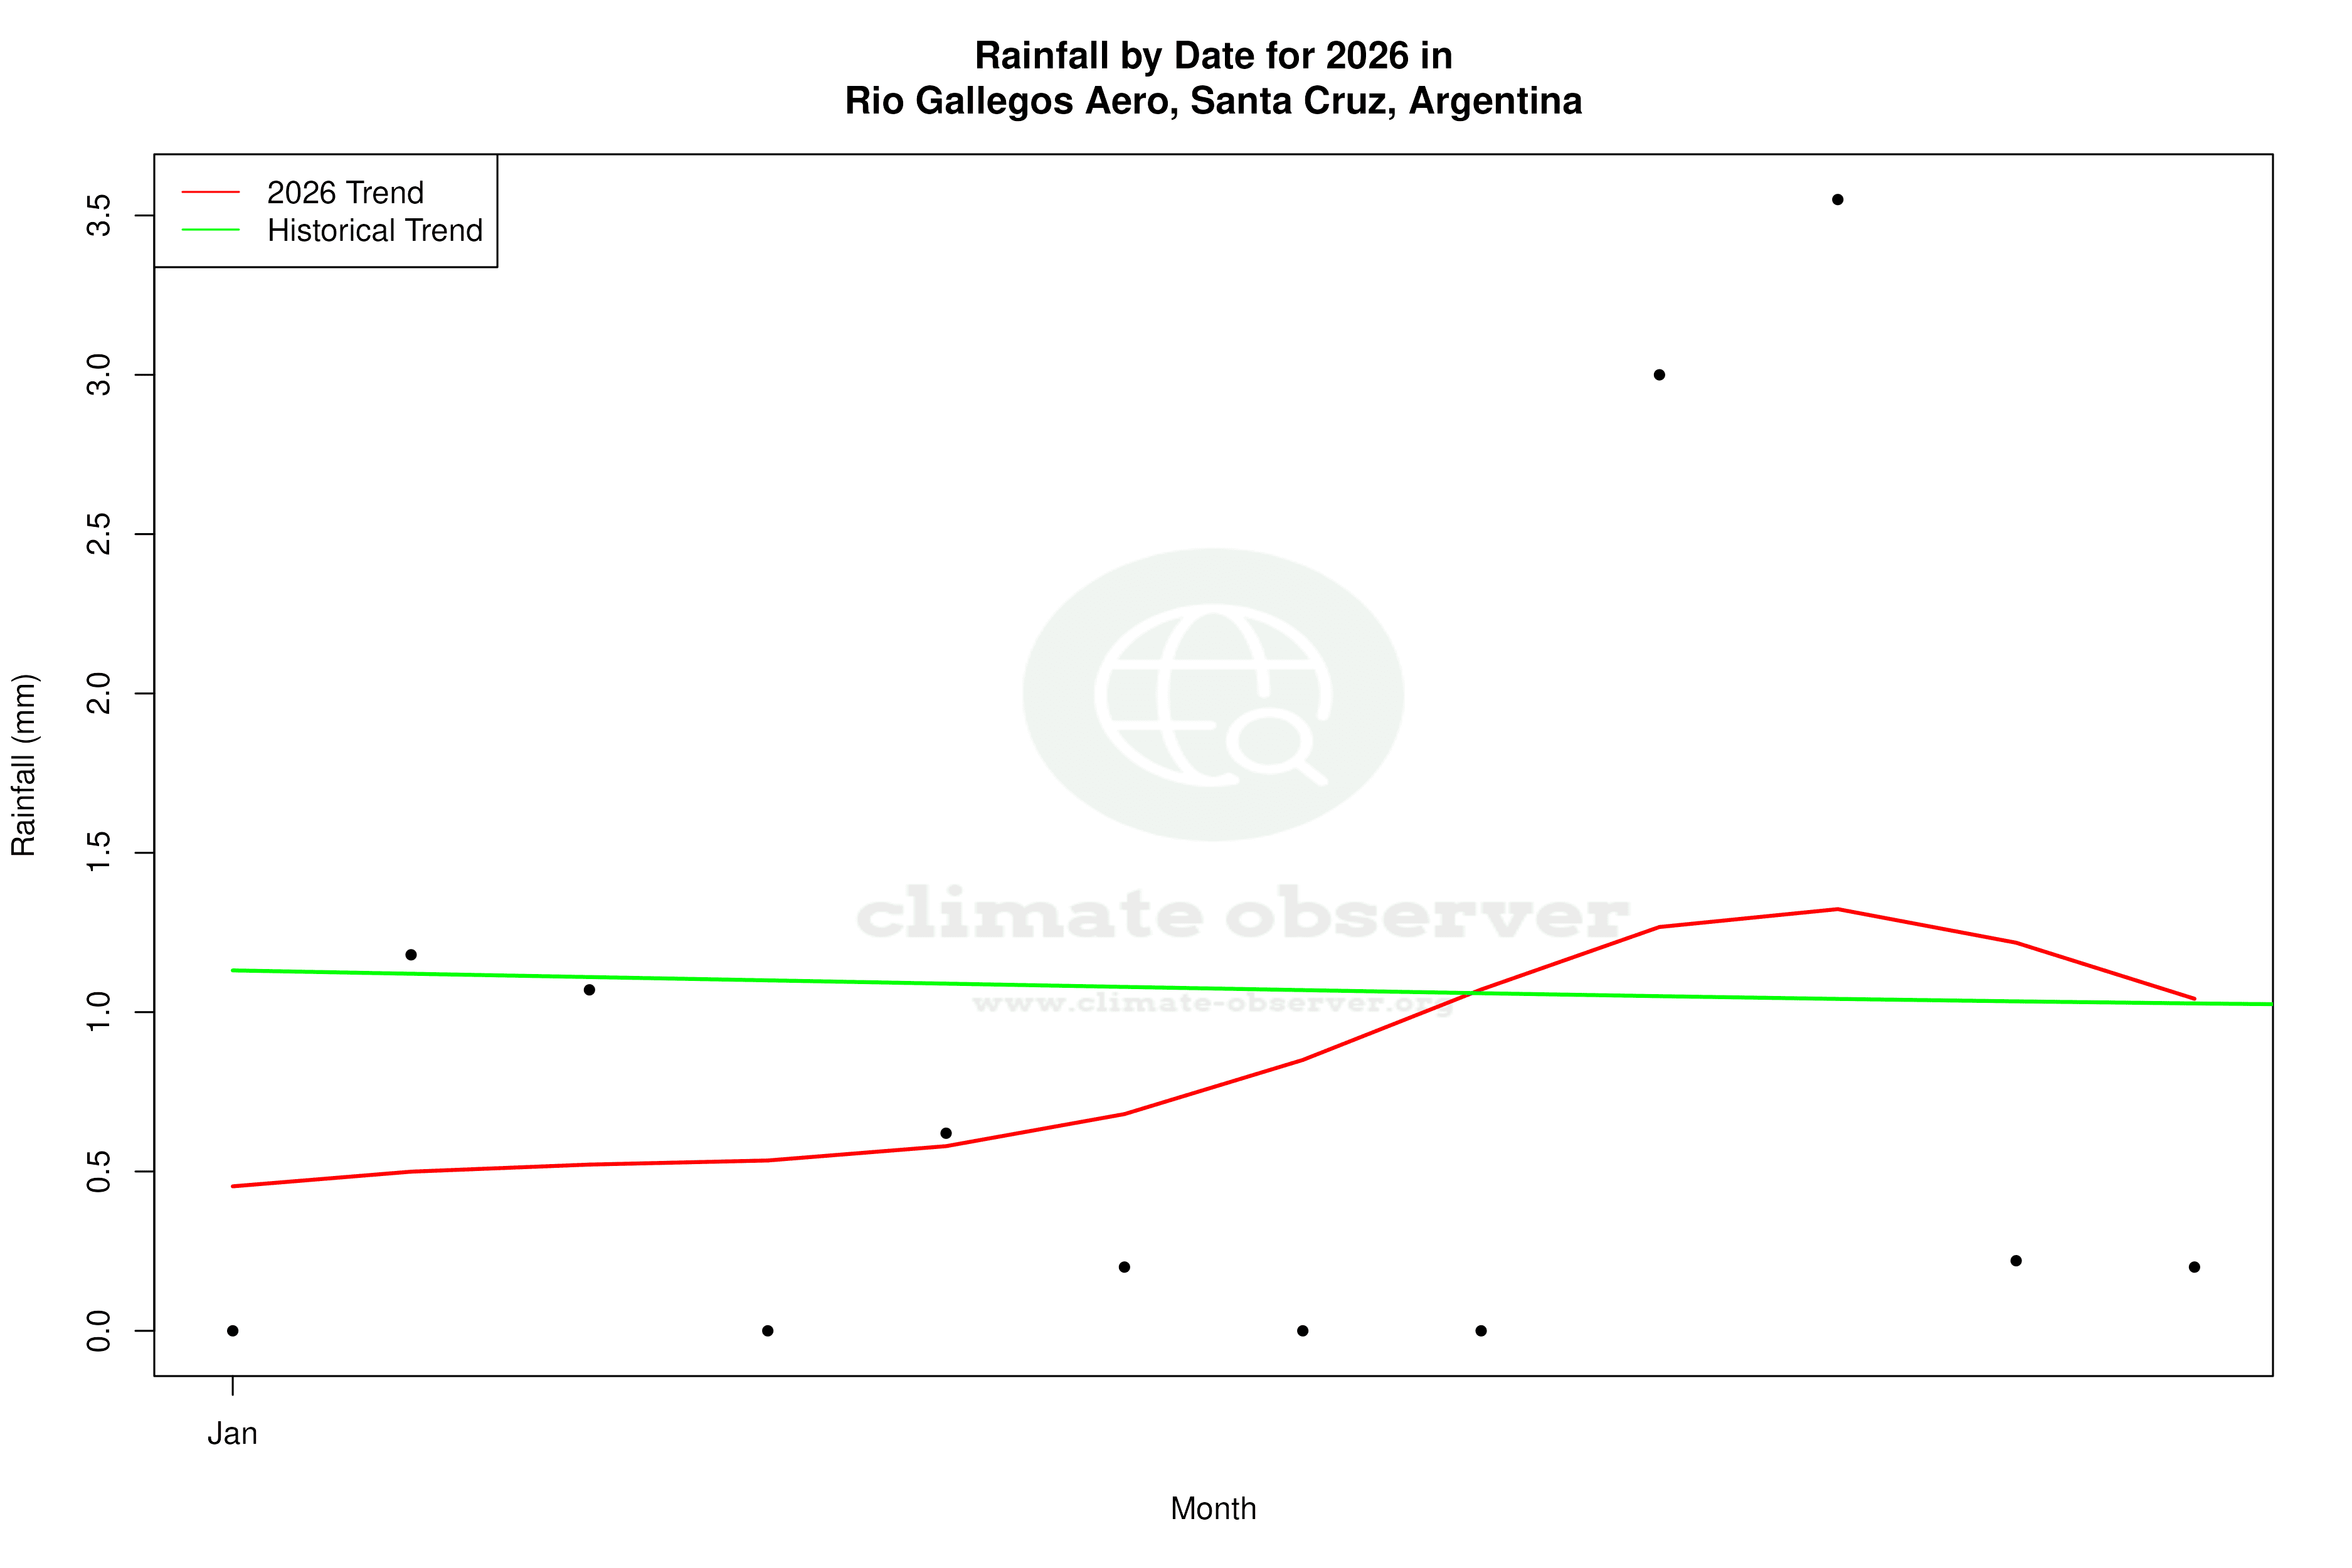
Precipitation Patterns: A Shift Towards Evenness
The Precipitation Concentration Index (PCI) provides insights into how rainfall is distributed over time. For Rio Gallegos, the PCI has decreased from a baseline of 11.26 to a current value of 9.33. This suggests that precipitation events have become more evenly distributed throughout the year, moving away from concentrated, intense rainfall. Such a shift may have implications for local water resources and agricultural practices.
Record Extremes: The Boundaries of Local Climate
The station's record temperatures highlight the extremes of Rio Gallegos' climate. The highest recorded temperature is 35.0°C (95.0°F), while the lowest plummets to -20.2°C (-4.4°F). These extremes underscore the region's capacity for significant thermal oscillations, influenced by both its latitude and local geographical features.
Regional Climate Goals and Implications
Argentina's commitment to addressing climate change through national policies provides a backdrop to these local observations. As the country strives to balance economic growth with environmental sustainability, understanding the nuanced climate dynamics of regions like Rio Gallegos is crucial. Recent weather events, such as unusual cold snaps or heatwaves, may serve as catalysts for further research and adaptation strategies in this part of the world.
Station Statistics
10-Year Trend
High: +0.60 °F/decade
Low: +0.21 °F/decade
Rain: -0.007 in/decade
25-Year Trend
High: +0.90 °F/decade
Low: +0.20 °F/decade
Rain: -0.000 in/decade
50-Year Trend
High: +0.66 °F/decade
Low: -0.31 °F/decade
Rain: +0.001 in/decade
All-Time Trend
High: +0.65 °F/decade
Low: -0.11 °F/decade
Rain: +0.002 in/decade
Percentage Above-Average Days
Last 12 Months: 47.7%
This Year: 38.0%
Precipitation Concentration Index (PCI) ℹ️
Last 12 Months: 9.7
Historical Average: 11.1
Percentile Rank of Last 12 Months ℹ️
High: 78th percentile
Low: 69th percentile
Rain: 61st percentile
Change in Variance ℹ️
High: +4.9%
Low: +11.5%
Intraday: +3.3%
Data Coverage
85.6%
First Year of Data
1956
Station Location
Historical Weather Records
| Max High | Avg High | Min High | Max Avg | Avg Avg | Min Avg | Max Low | Avg Low | Min Low | Max Precipitation | Avg Precipitation | Max Snow | Avg Snow | |
|---|---|---|---|---|---|---|---|---|---|---|---|---|---|
| Record | 95.00 °F | — | 14.00 °F | 79.88 °F | — | 7.88 °F | 66.20 °F | — | -4.36 °F | 5.04 in | — | — | — |
| January | 95.00 °F | 68.01 °F | 49.46 °F | 79.88 °F | 56.77 °F | 43.16 °F | 66.20 °F | 45.51 °F | 30.38 °F | 0.91 in | 0.04 in | — | — |
| February | 94.28 °F | 67.48 °F | 50.29 °F | 71.96 °F | 55.88 °F | 41.00 °F | 65.48 °F | 44.66 °F | 25.70 °F | 1.28 in | 0.04 in | — | — |
| March | 91.40 °F | 63.08 °F | 40.10 °F | 68.54 °F | 51.96 °F | 33.26 °F | 62.24 °F | 41.33 °F | 17.96 °F | 1.35 in | 0.04 in | — | — |
| April | 82.76 °F | 56.23 °F | 39.56 °F | 66.56 °F | 46.10 °F | 27.68 °F | 56.84 °F | 36.50 °F | 12.20 °F | 3.15 in | 0.04 in | — | — |
| May | 72.68 °F | 47.53 °F | 27.32 °F | 57.56 °F | 39.95 °F | 20.48 °F | 48.92 °F | 32.06 °F | 5.90 °F | 3.35 in | 0.04 in | — | — |
| June | 62.60 °F | 41.50 °F | 19.76 °F | 53.96 °F | 34.91 °F | 8.42 °F | 47.84 °F | 28.09 °F | -0.76 °F | 1.14 in | 0.04 in | — | — |
| July | 60.98 °F | 40.94 °F | 14.00 °F | 50.00 °F | 34.37 °F | 7.88 °F | 44.24 °F | 27.60 °F | -4.36 °F | 0.98 in | 0.03 in | — | — |
| August | 64.58 °F | 45.57 °F | 26.06 °F | 53.06 °F | 37.95 °F | 21.56 °F | 45.32 °F | 30.69 °F | 9.14 °F | 0.87 in | 0.03 in | — | — |
| September | 76.82 °F | 52.66 °F | 32.72 °F | 59.36 °F | 42.52 °F | 26.96 °F | 47.84 °F | 33.36 °F | 15.80 °F | 1.68 in | 0.02 in | — | — |
| October | 80.96 °F | 58.97 °F | 37.76 °F | 62.06 °F | 47.40 °F | 33.26 °F | 51.44 °F | 36.45 °F | 19.76 °F | 2.50 in | 0.03 in | — | — |
| November | 86.72 °F | 63.40 °F | 39.92 °F | 67.64 °F | 51.77 °F | 36.14 °F | 56.48 °F | 40.64 °F | 20.48 °F | 5.04 in | 0.04 in | — | — |
| December | 87.44 °F | 66.11 °F | 47.48 °F | 72.68 °F | 54.82 °F | 40.64 °F | 59.72 °F | 43.83 °F | 27.50 °F | 3.19 in | 0.04 in | — | — |
Data Visualisations
Remove WatermarksCurrent Year Climate Trends vs Historical
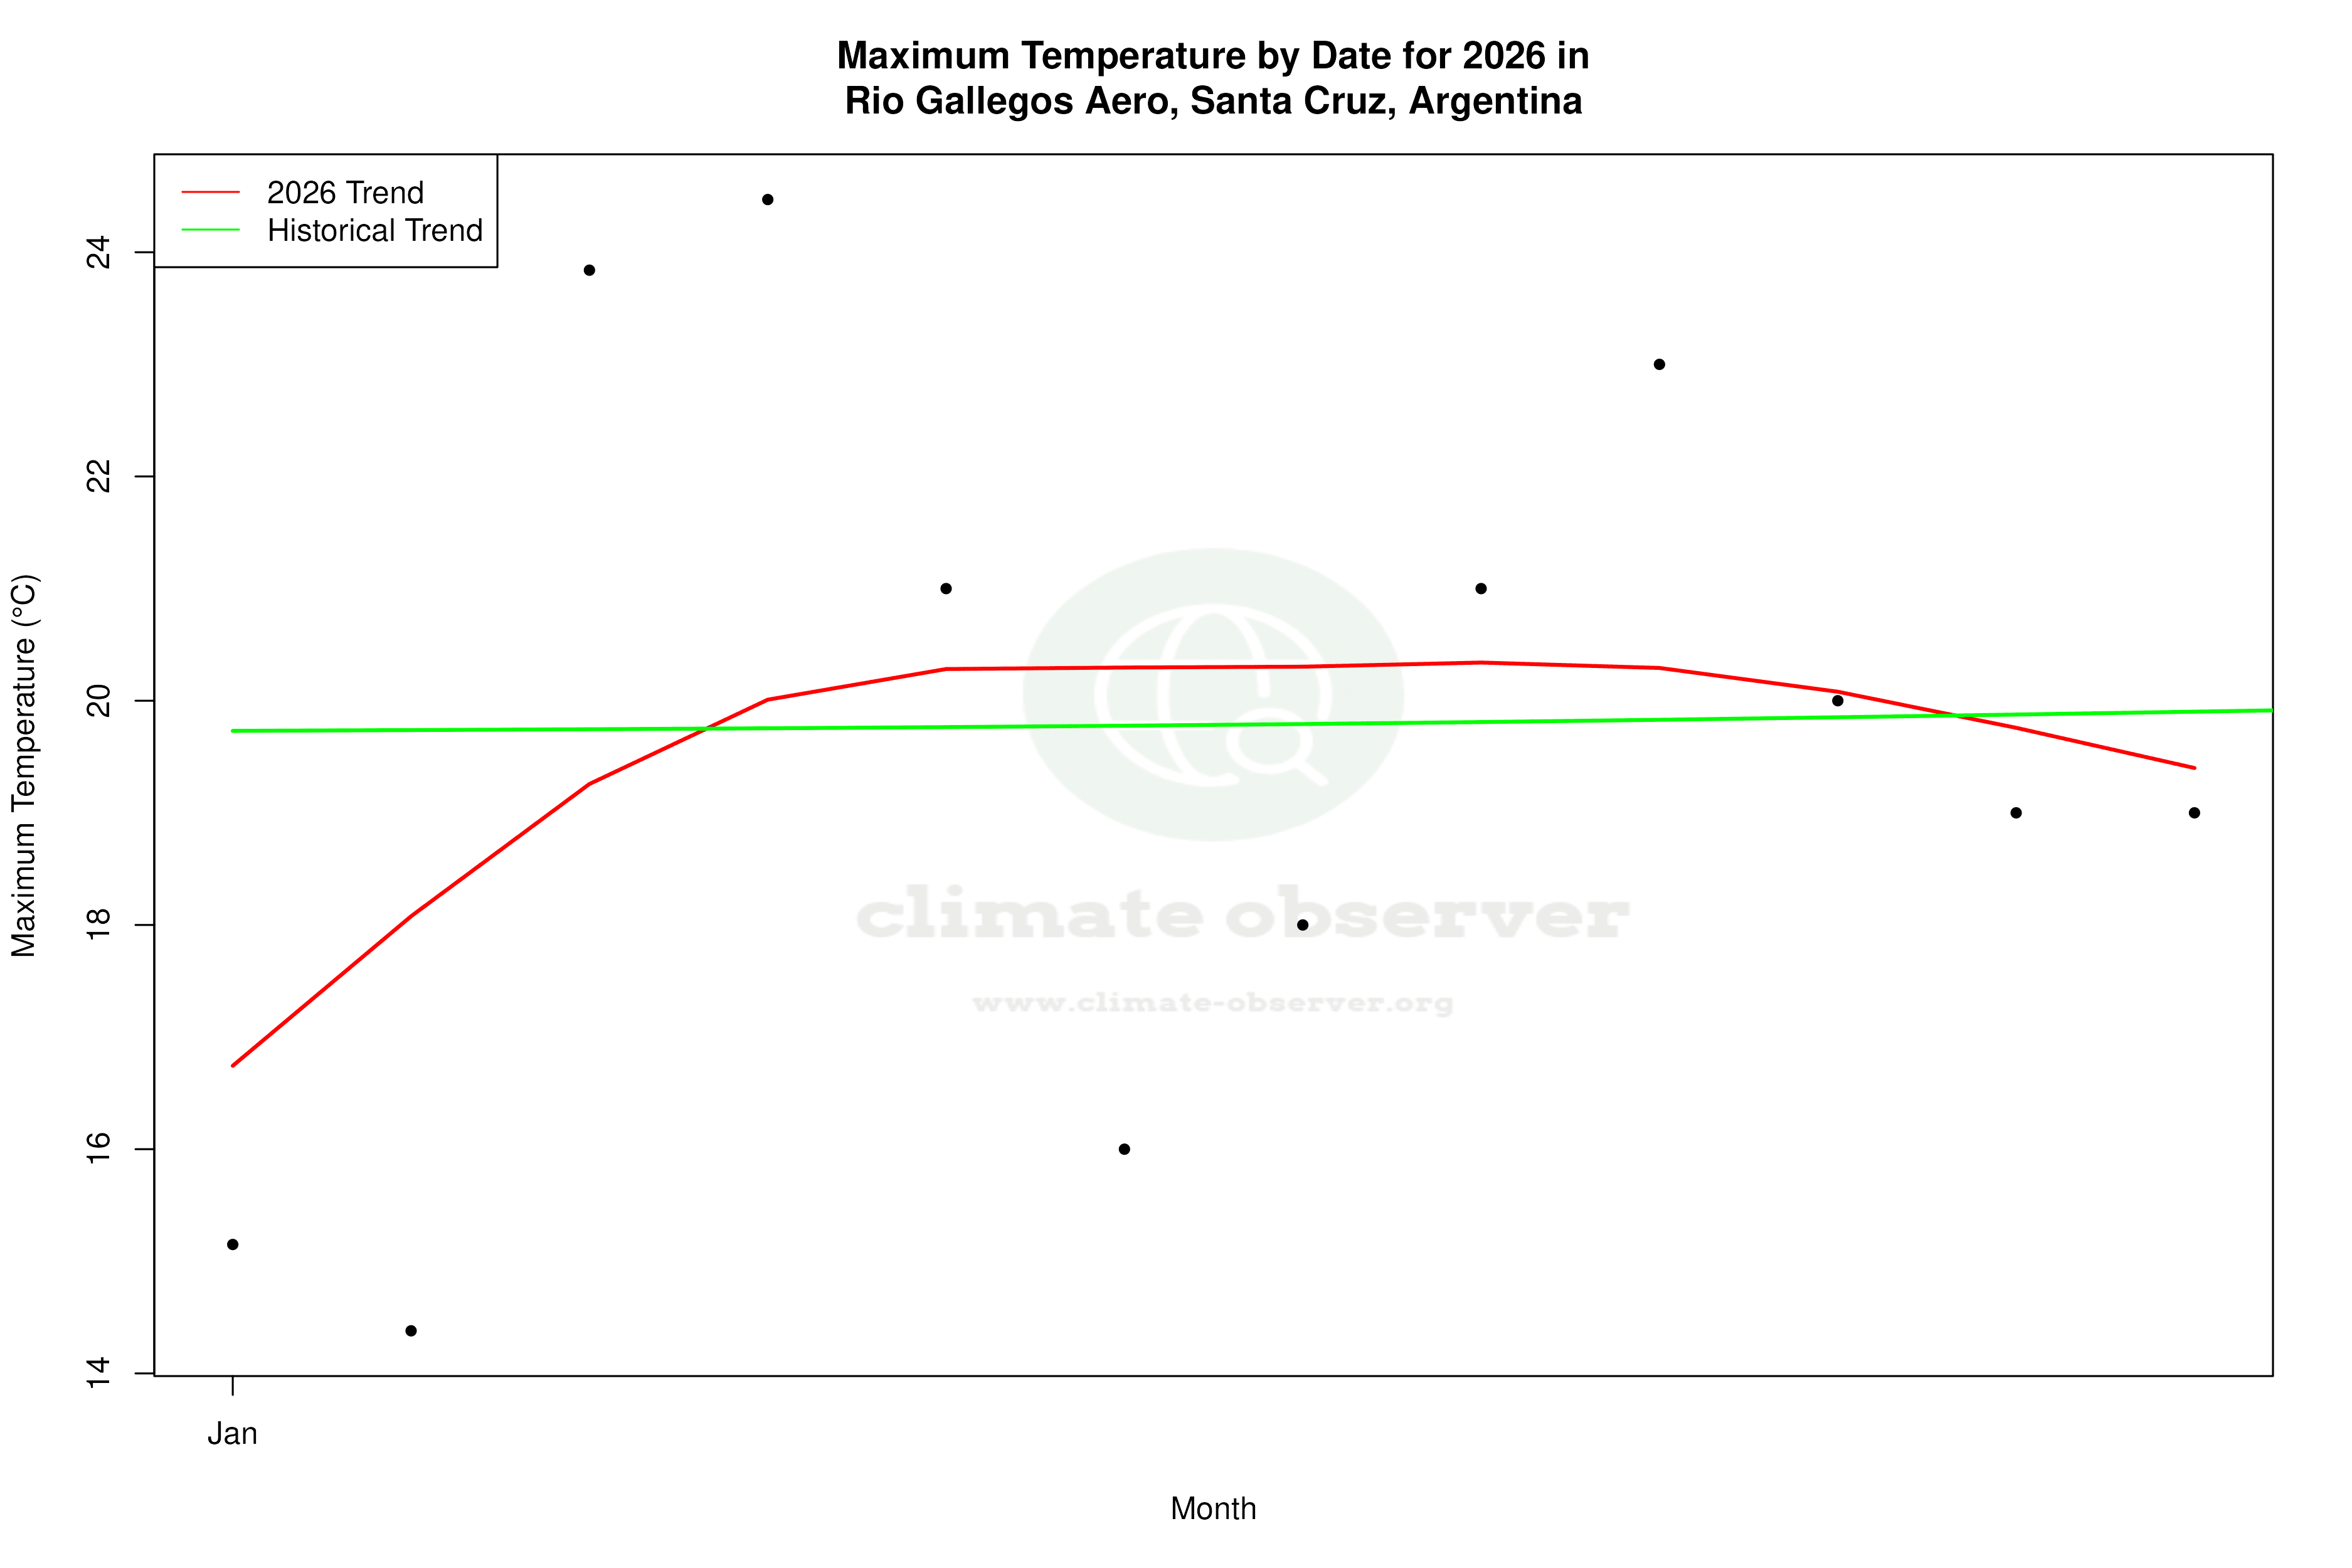


Max Temperature this Year | 1 of 6
Climate 12-Month Moving Averages


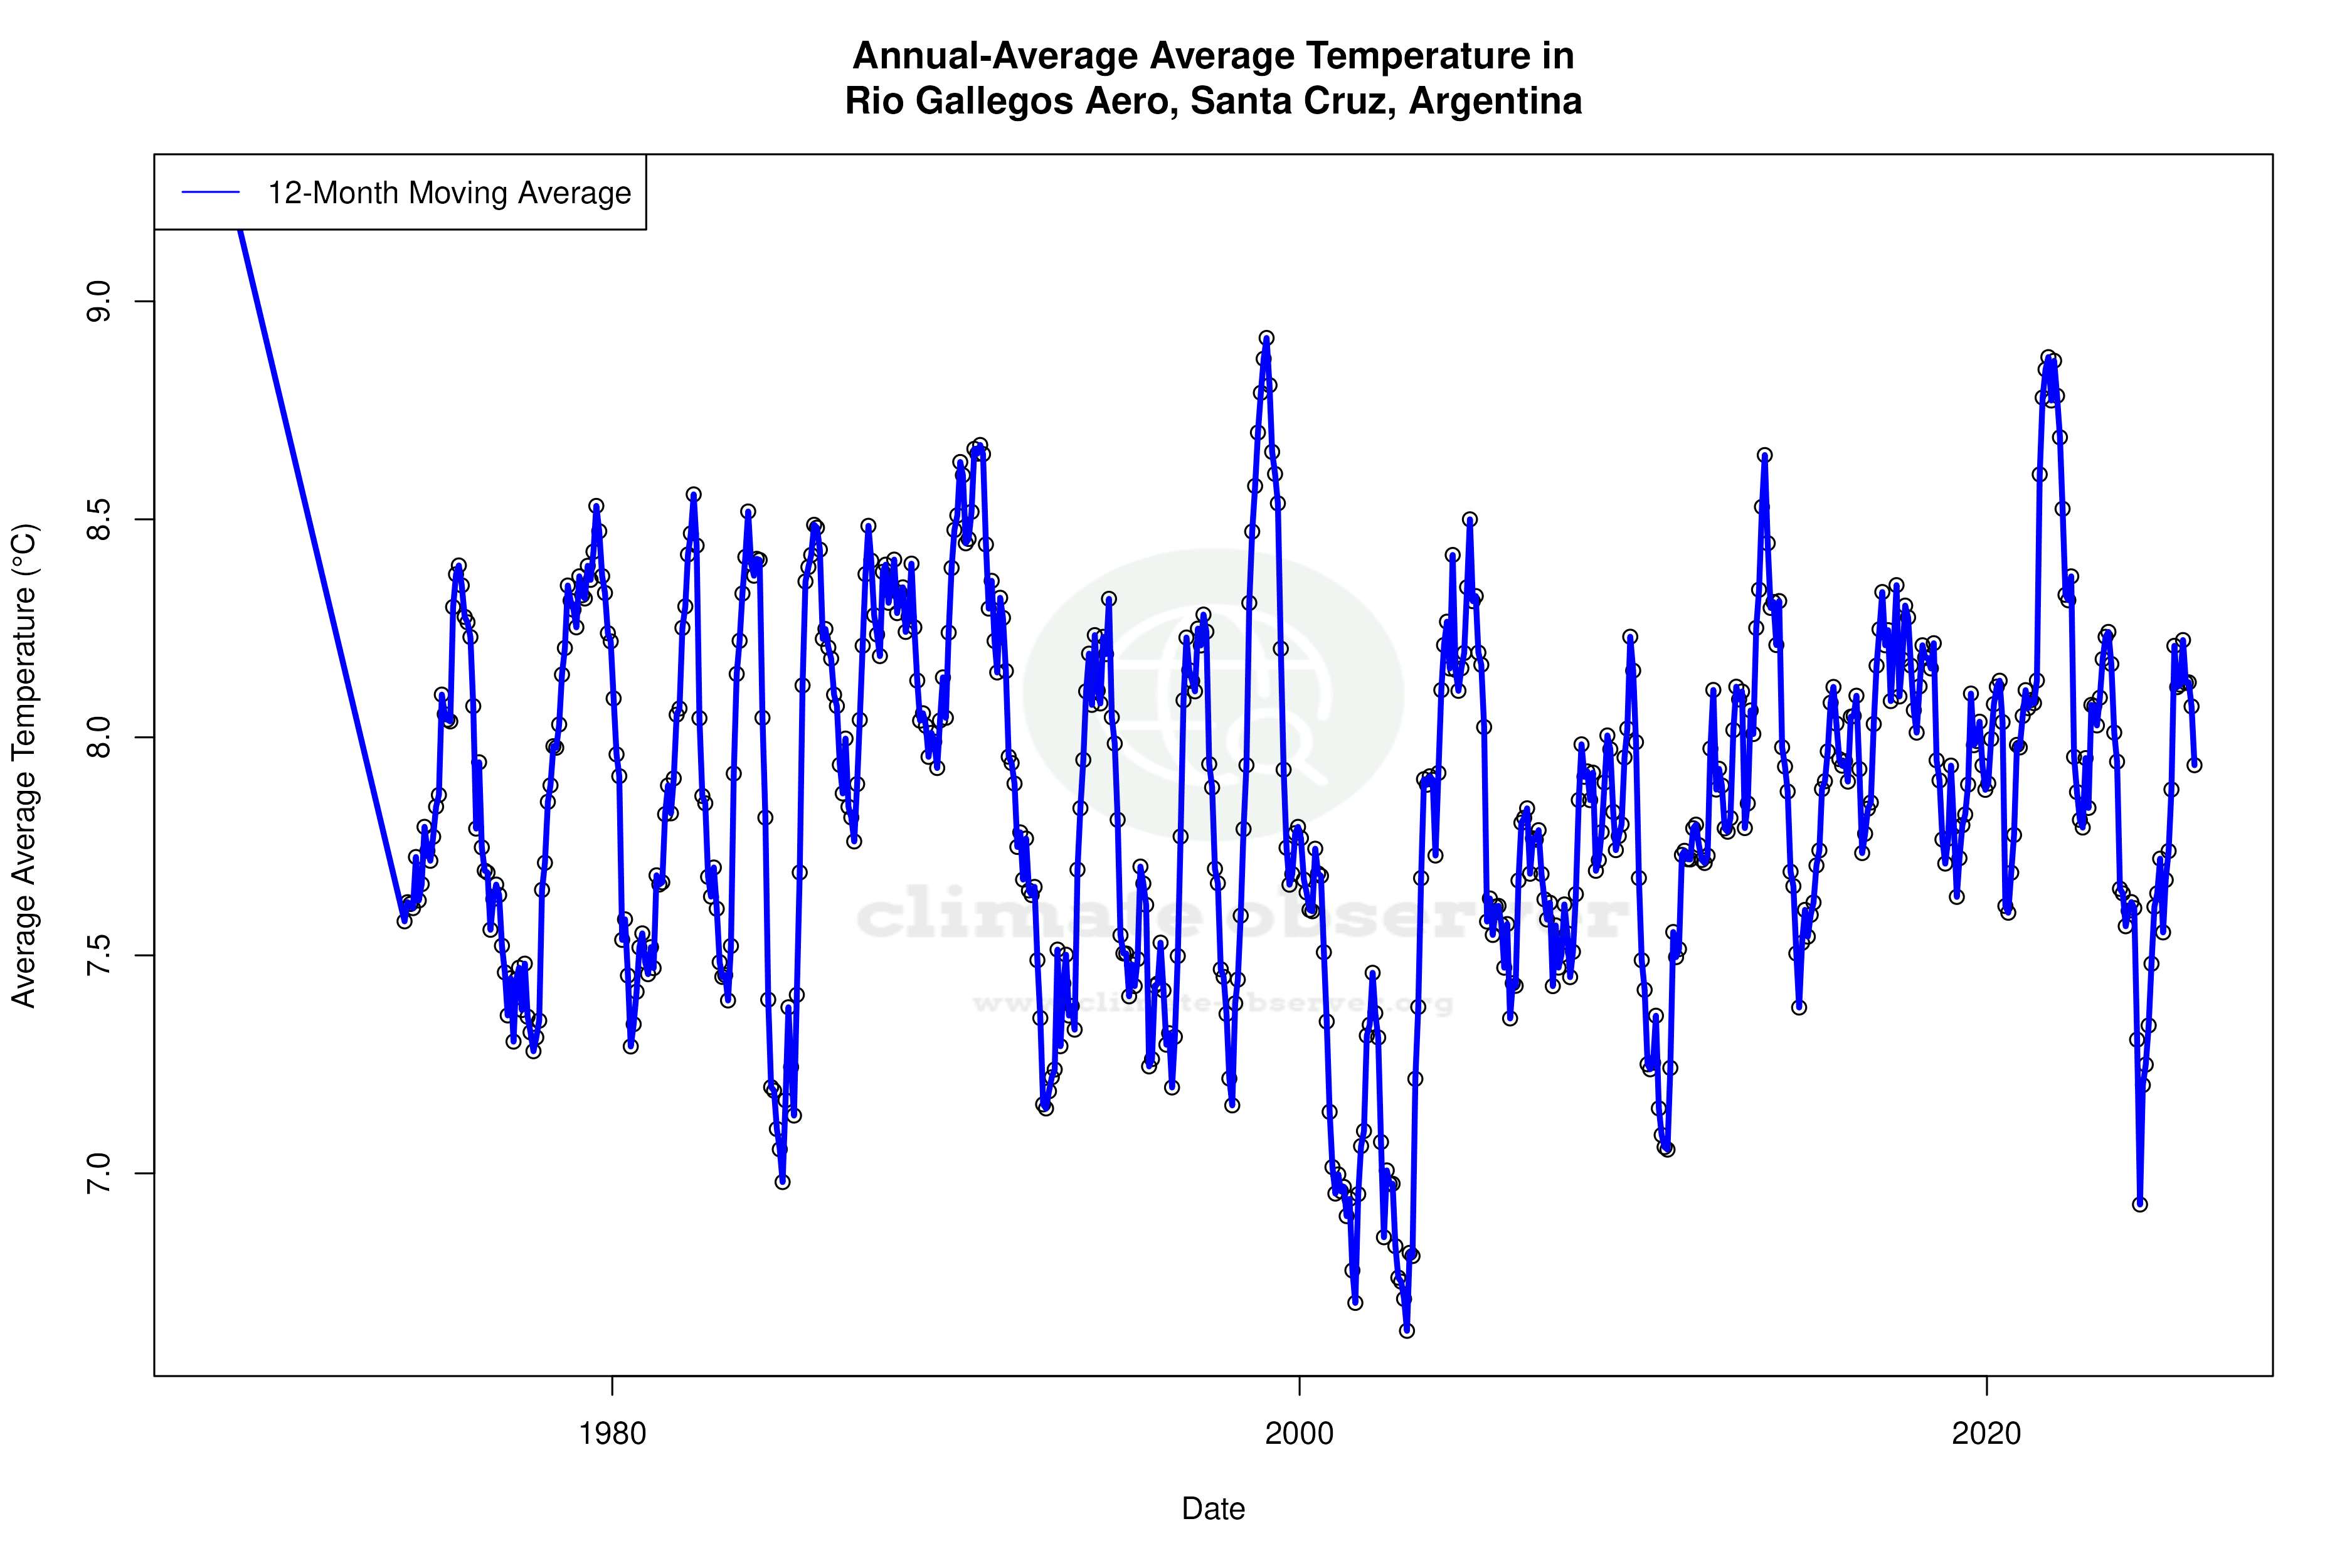


Max Temperature 12-Month MA | 1 of 6
Daily Data Points and Averages Throughout the Year


Average Max Temperature Throughout Year | 1 of 5
