Climate for Station: Willis Island, Australia
Loading live weather...
Climate Analysis & Overview
Willis Island is experiencing a warming trend, with both high and low temperatures rising over the past decade. The Precipitation Concentration Index indicates a significant increase in concentrated rainfall events, suggesting a shift in precipitation patterns. This aligns with broader regional climate goals aimed at understanding and adapting to changing weather dynamics.
Tropical Maritime Climate Dynamics
Willis Island, located in the Coral Sea Islands of Australia, is characterised by a tropical maritime climate. This classification is defined by warm temperatures year-round and significant rainfall, influenced by its proximity to the ocean. The island's geographical setting, surrounded by the vast expanse of the Coral Sea, plays a crucial role in moderating temperature extremes and contributing to its humid conditions. The all-time temperature trends reveal a warming pattern, with highs increasing by 0.11°C (0.20°F) and lows by 0.12°C (0.22°F). This warming trend is consistent with global climate patterns, where oceanic regions are experiencing gradual temperature increases.
Decadal Temperature Shifts
Over the past decade, Willis Island has witnessed a more pronounced rise in temperatures, particularly in the lows, which have increased by 0.14°C (0.26°F). The highs have also risen, albeit at a slower rate of 0.05°C (0.09°F). These trends suggest that nighttime temperatures are increasing at a faster pace than daytime highs, which could impact local ecosystems and weather patterns. The record high temperature on the island stands at 35.2°C (95.4°F), while the record low is 16.8°C (62.2°F), indicating a relatively narrow range of temperature extremes due to the maritime influence.
Precipitation Patterns and Concentration
The Precipitation Concentration Index (PCI) provides insight into the distribution of rainfall over time. Willis Island's PCI has increased from a baseline of 19.3 to a current value of 23.9, indicating a significant shift towards more concentrated rainfall events. A PCI value over 20 suggests that rainfall is becoming more intense and less evenly distributed throughout the year. This change is critical for understanding potential impacts on water resources and flood risks, as concentrated rainfall can lead to more severe weather events.
Climate Goals and Regional Implications
Australia's regional climate goals focus on enhancing resilience to climate change and understanding the implications of shifting weather patterns. The data from Willis Island aligns with these objectives, providing valuable insights into the local manifestations of global climate trends. The observed warming and increased precipitation concentration underscore the need for adaptive strategies to mitigate potential impacts on both natural and human systems. As the island continues to monitor these changes, the data will be instrumental in guiding future climate policies and initiatives.
Station Statistics
10-Year Trend
High: -0.63 °F/decade
Low: +0.49 °F/decade
Rain: +0.061 in/decade
25-Year Trend
High: +0.85 °F/decade
Low: +0.16 °F/decade
Rain: +0.001 in/decade
50-Year Trend
High: +1.43 °F/decade
Low: -0.04 °F/decade
Rain: -0.004 in/decade
All-Time Trend
High: +0.19 °F/decade
Low: +0.23 °F/decade
Rain: -0.004 in/decade
Percentage Above-Average Days
Last 12 Months: 41.1%
This Year: 0.0%
Precipitation Concentration Index (PCI) ℹ️
Last 12 Months: 18.4
Historical Average: 20.4
Percentile Rank of Last 12 Months ℹ️
High: 50th percentile
Low: 90th percentile
Rain: 82nd percentile
Change in Variance ℹ️
High: -24.9%
Low: -11.7%
Intraday: -36.8%
Data Coverage
71.4%
First Year of Data
1948
Station Location
Historical Weather Records
| Max High | Avg High | Min High | Max Avg | Avg Avg | Min Avg | Max Low | Avg Low | Min Low | Max Precipitation | Avg Precipitation | Max Snow | Avg Snow | |
|---|---|---|---|---|---|---|---|---|---|---|---|---|---|
| Record | 95.36 °F | — | 69.66 °F | 89.24 °F | — | 68.54 °F | 85.30 °F | — | 62.24 °F | 15.98 in | — | — | — |
| January | 95.18 °F | 85.90 °F | 78.60 °F | 86.72 °F | 82.69 °F | 76.46 °F | 84.51 °F | 79.62 °F | 69.98 °F | 8.90 in | 0.28 in | — | — |
| February | 95.36 °F | 85.74 °F | 78.98 °F | 87.26 °F | 82.70 °F | 77.00 °F | 85.08 °F | 79.97 °F | 71.96 °F | 6.02 in | 0.26 in | — | — |
| March | 92.12 °F | 84.80 °F | 77.18 °F | 86.18 °F | 81.90 °F | 75.56 °F | 85.30 °F | 79.29 °F | 71.96 °F | 15.98 in | 0.28 in | — | — |
| April | 89.24 °F | 83.21 °F | 76.62 °F | 84.92 °F | 80.43 °F | 75.20 °F | 83.66 °F | 78.22 °F | 71.60 °F | 4.57 in | 0.16 in | — | — |
| May | 88.70 °F | 81.28 °F | 74.30 °F | 82.76 °F | 78.49 °F | 71.96 °F | 81.91 °F | 76.45 °F | 66.20 °F | 3.98 in | 0.08 in | — | — |
| June | 88.70 °F | 79.17 °F | 71.56 °F | 81.50 °F | 76.41 °F | 68.72 °F | 79.75 °F | 74.43 °F | 65.12 °F | 2.48 in | 0.05 in | — | — |
| July | 84.92 °F | 78.19 °F | 69.66 °F | 80.42 °F | 75.33 °F | 68.54 °F | 79.47 °F | 73.18 °F | 62.24 °F | 4.41 in | 0.04 in | — | — |
| August | 85.28 °F | 78.31 °F | 71.55 °F | 80.42 °F | 75.18 °F | 69.62 °F | 78.26 °F | 72.82 °F | 64.04 °F | 2.57 in | 0.03 in | — | — |
| September | 87.26 °F | 79.71 °F | 72.34 °F | 81.50 °F | 76.51 °F | 69.80 °F | 79.23 °F | 73.95 °F | 66.56 °F | 2.24 in | 0.02 in | — | — |
| October | 89.96 °F | 82.02 °F | 73.22 °F | 85.10 °F | 78.76 °F | 72.50 °F | 80.78 °F | 75.98 °F | 64.40 °F | 4.80 in | 0.03 in | — | — |
| November | 92.48 °F | 84.00 °F | 76.01 °F | 87.98 °F | 80.78 °F | 75.92 °F | 82.94 °F | 77.71 °F | 69.80 °F | 5.47 in | 0.05 in | — | — |
| December | 93.38 °F | 85.64 °F | 76.78 °F | 89.24 °F | 82.24 °F | 75.56 °F | 84.69 °F | 79.22 °F | 69.80 °F | 3.47 in | 0.13 in | — | — |
Data Visualisations
Remove WatermarksCurrent Year Climate Trends vs Historical
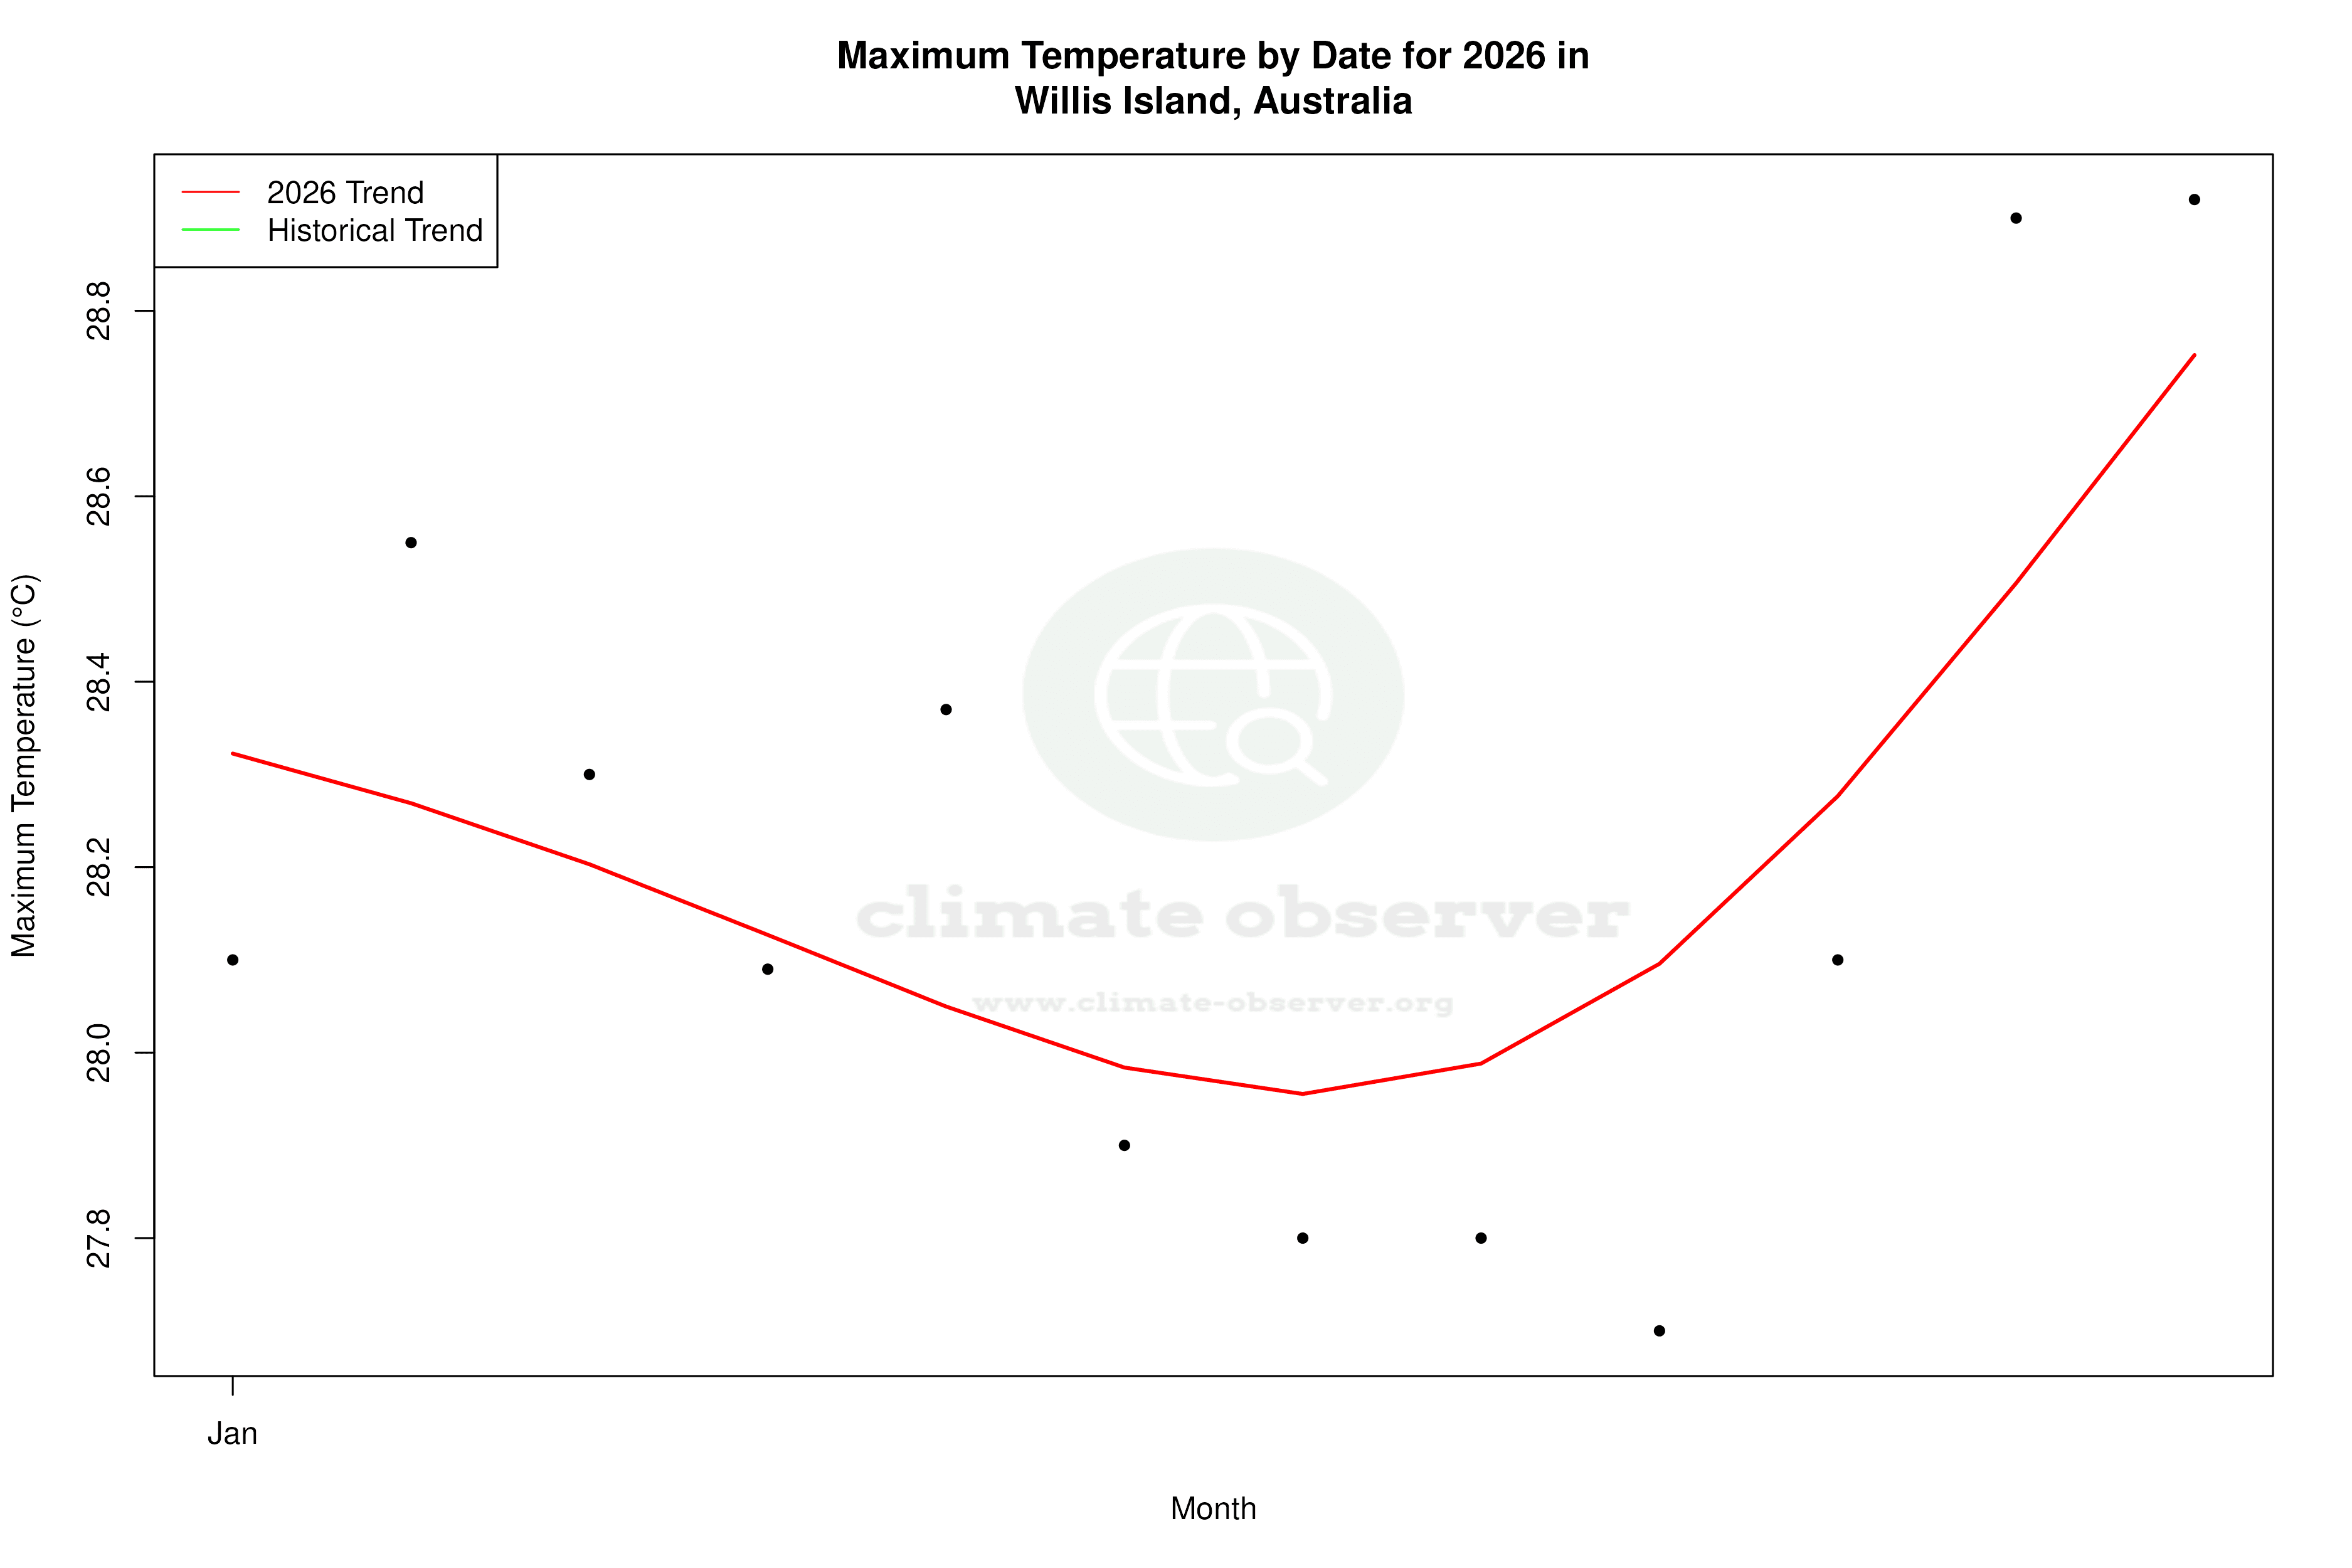


Max Temperature this Year | 1 of 6
Climate 12-Month Moving Averages


Max Temperature 12-Month MA | 1 of 6
Daily Data Points and Averages Throughout the Year


Average Max Temperature Throughout Year | 1 of 5