Climate for Station: Mardie, Western Australia, Australia
Loading live weather...
Climate Analysis & Overview
Mardie, located in Western Australia, is experiencing a warming trend with significant changes in temperature patterns over the last decade. The region's precipitation is becoming more evenly distributed, indicating a shift in climatic conditions.
Warming Trends in Mardie
Mardie, situated in the arid expanse of Western Australia, is experiencing a notable warming trend. Over the past decade, the average high temperatures have increased by 0.22°C (0.39°F), while the lows have risen by 0.40°C (0.72°F). This recent trend is more pronounced than the all-time warming, where highs have increased by 0.07°C (0.13°F) and lows by 0.33°C (0.59°F). The all-time trend indicates a consistent warming pattern, albeit at a slower rate than the recent decade's acceleration. Such changes are consistent with broader regional climate goals aimed at understanding and adapting to climate variability.
Temperature Extremes and Records
Mardie is no stranger to extreme temperatures, with a record high of 50.5°C (122.9°F) and a record low of 2.9°C (37.2°F). These extremes highlight the region's susceptibility to intense heat, a characteristic of its desert climate classification under the Köppen system. The high temperatures are influenced by the area's geographical setting, which lacks significant topographical features to moderate the heat.
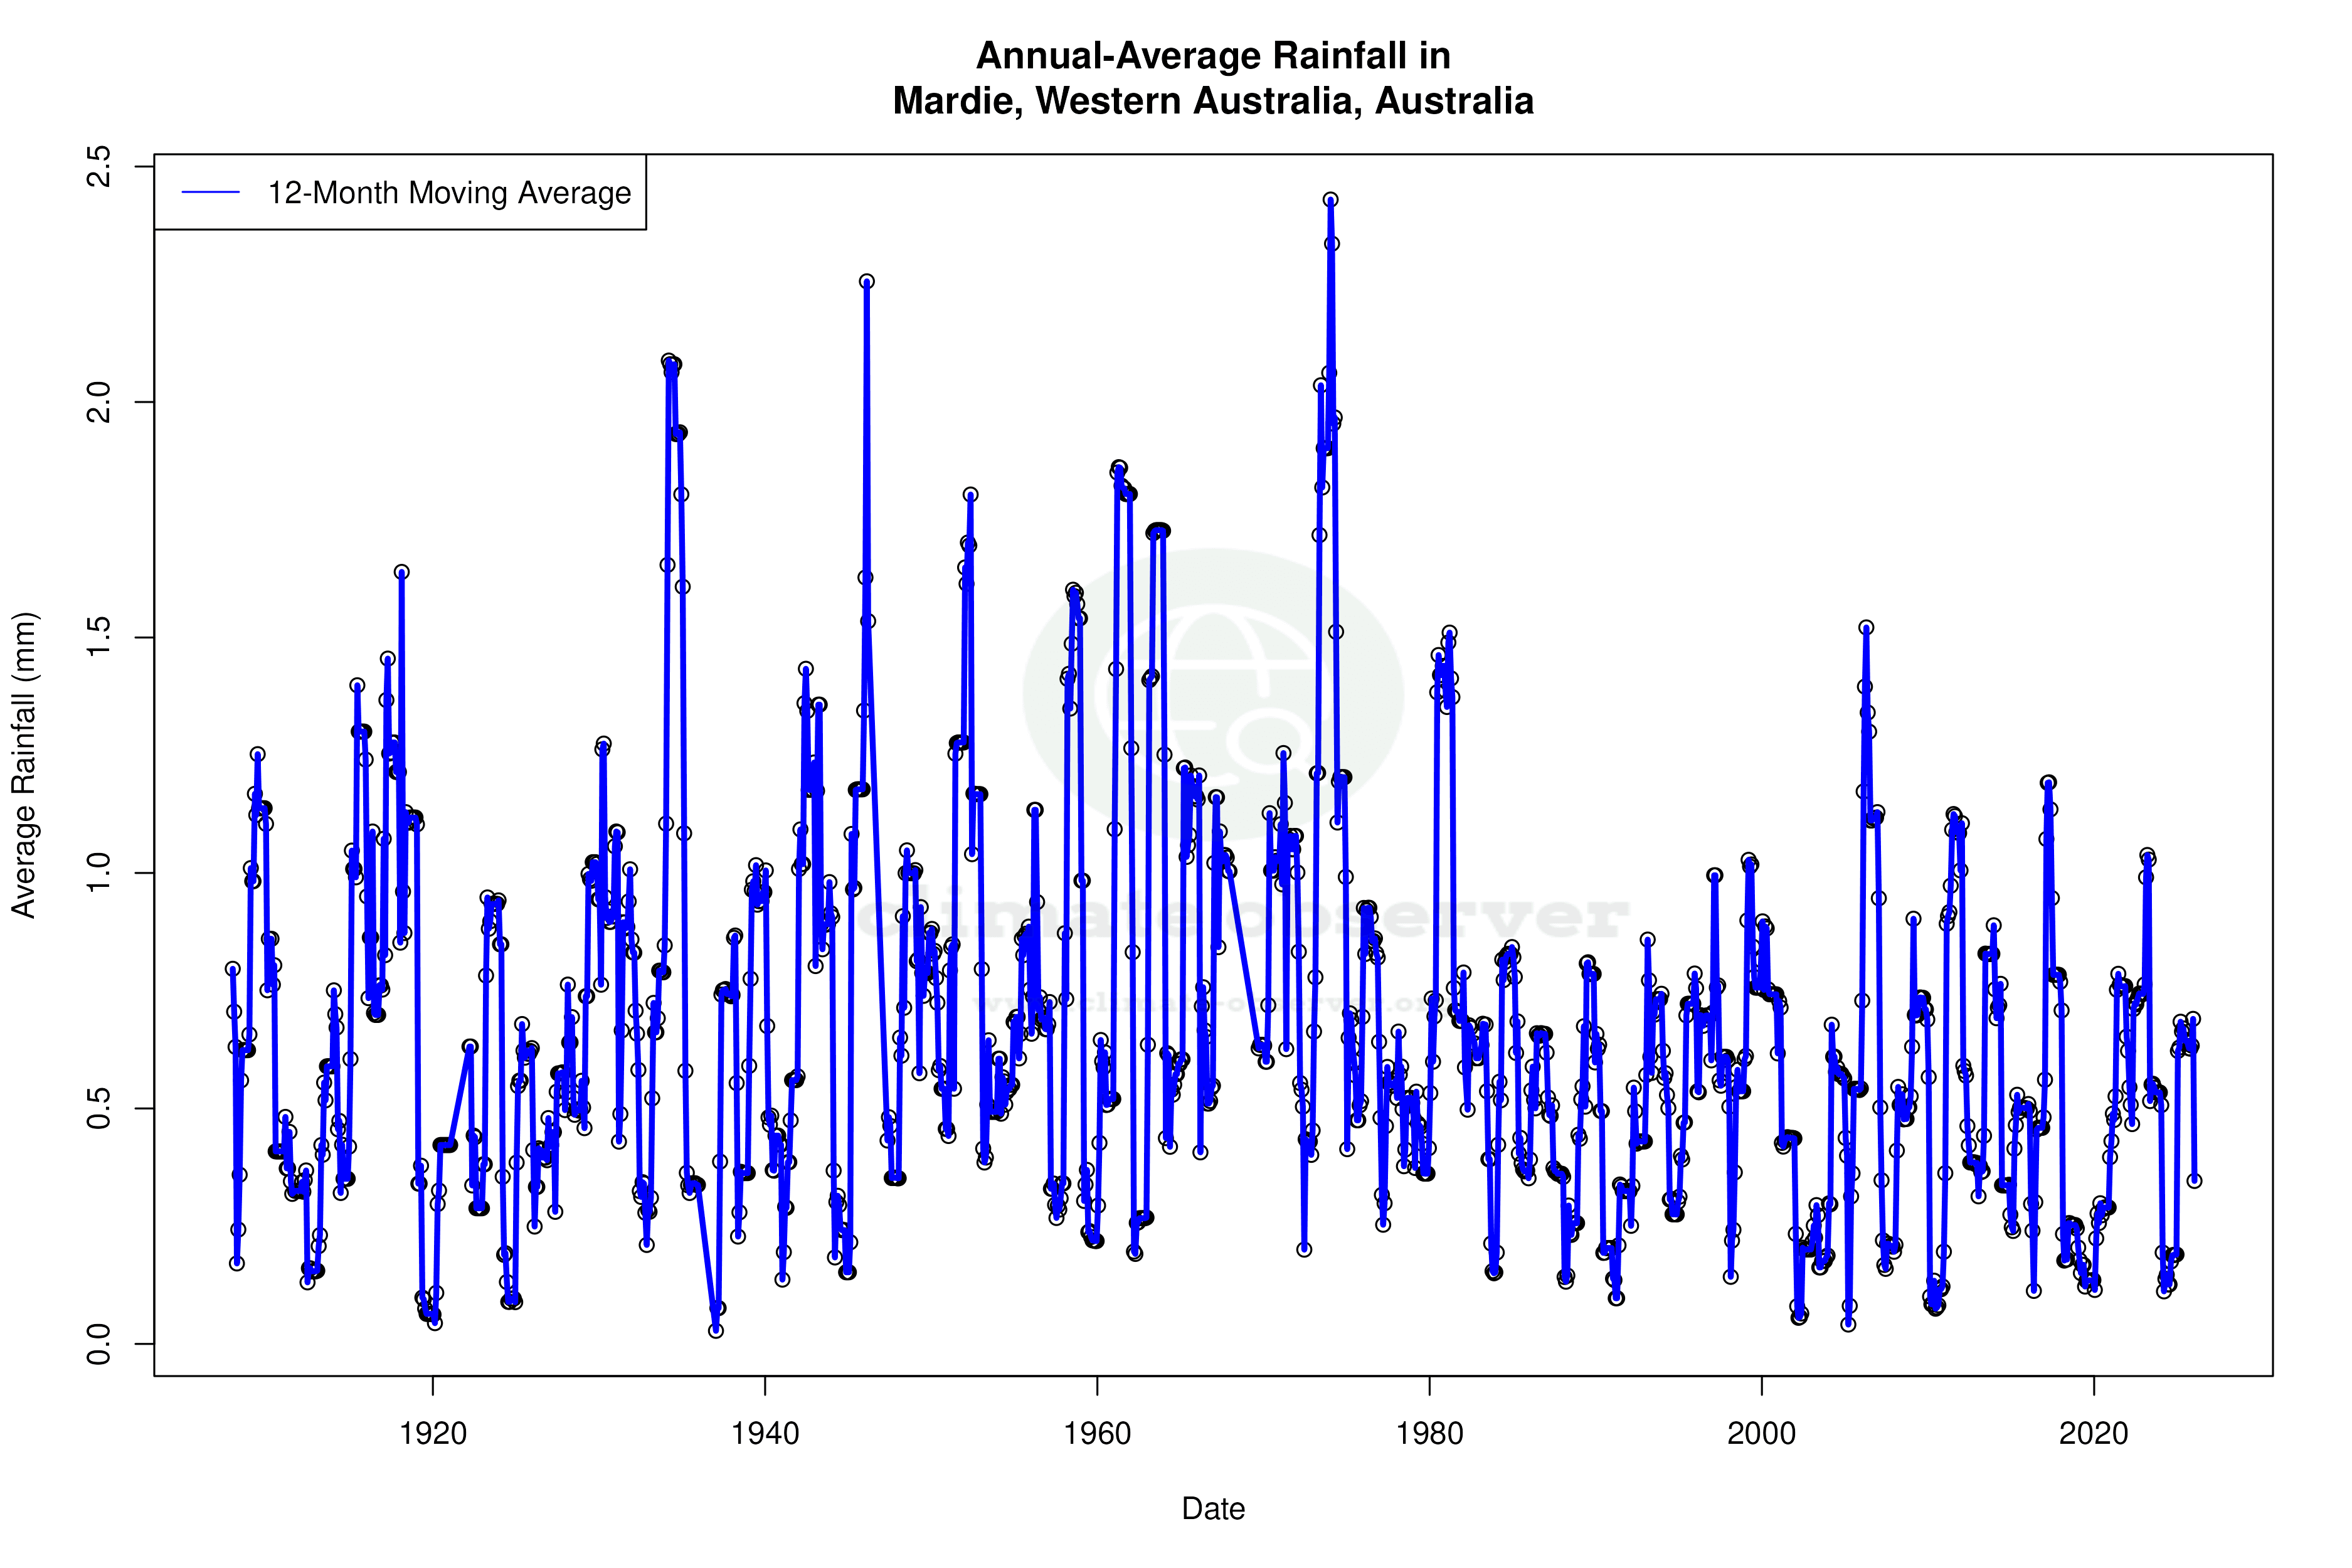
Precipitation Patterns: A Shift Towards Even Distribution
The Precipitation Concentration Index (PCI) in Mardie has shifted from a baseline of 30.5 to a current value of 24.4, indicating a more even distribution of rainfall events. This decrease suggests that precipitation is becoming less concentrated in intense, isolated events and more evenly spread throughout the year. A PCI over 20 still denotes a high concentration, but the reduction is a significant change, potentially affecting local water management and agricultural practices.
Geographical and Climatic Context
Mardie's location in the Pilbara region of Western Australia places it in a predominantly arid zone, characterised by hot temperatures and low rainfall. The absence of major rivers or mountain ranges means that the climate is primarily influenced by oceanic and atmospheric conditions. The warming trends observed in Mardie are reflective of larger patterns seen across Australia, where climate change adaptation strategies are increasingly focused on managing heatwaves and ensuring sustainable water resources.
Implications of Climate Variability
The observed climatic trends in Mardie have implications for both local ecosystems and human activities. As temperatures rise and precipitation becomes more evenly distributed, there may be shifts in vegetation patterns and water availability. These changes necessitate ongoing monitoring and adaptation to ensure resilience against the backdrop of a warming climate. The regional climate goals of Australia aim to address these challenges by promoting sustainable practices and enhancing climate resilience.
Station Statistics
10-Year Trend
High: +0.98 °F/decade
Low: +1.74 °F/decade
Rain: -0.006 in/decade
25-Year Trend
High: +0.59 °F/decade
Low: +0.69 °F/decade
Rain: -0.001 in/decade
50-Year Trend
High: -0.02 °F/decade
Low: +0.67 °F/decade
Rain: -0.001 in/decade
All-Time Trend
High: +0.13 °F/decade
Low: +0.62 °F/decade
Rain: -0.001 in/decade
Percentage Above-Average Days
Last 12 Months: 46.6%
This Year: 25.8%
Precipitation Concentration Index (PCI) ℹ️
Last 12 Months: 34.8
Historical Average: 34.7
Percentile Rank of Last 12 Months ℹ️
High: 69th percentile
Low: 88th percentile
Rain: 16th percentile
Change in Variance ℹ️
High: -7.0%
Low: +2.4%
Intraday: -3.6%
Data Coverage
55.5%
First Year of Data
1885
Station Location
Historical Weather Records
| Max High | Avg High | Min High | Max Avg | Avg Avg | Min Avg | Max Low | Avg Low | Min Low | Max Precipitation | Avg Precipitation | Max Snow | Avg Snow | |
|---|---|---|---|---|---|---|---|---|---|---|---|---|---|
| Record | 122.90 °F | — | 61.52 °F | 102.92 °F | — | 58.15 °F | 93.20 °F | — | 37.22 °F | 9.50 in | — | — | — |
| January | 122.90 °F | 100.09 °F | 78.98 °F | 102.92 °F | 87.91 °F | 78.03 °F | 90.68 °F | 77.41 °F | 60.98 °F | 8.18 in | 0.04 in | — | — |
| February | 122.90 °F | 99.44 °F | 76.46 °F | 99.14 °F | 87.48 °F | 78.01 °F | 91.04 °F | 77.89 °F | 63.14 °F | 5.32 in | 0.07 in | — | — |
| March | 116.96 °F | 99.70 °F | 78.08 °F | 101.30 °F | 86.97 °F | 75.96 °F | 93.20 °F | 76.06 °F | 55.94 °F | 9.50 in | 0.05 in | — | — |
| April | 110.66 °F | 96.60 °F | 73.40 °F | 94.55 °F | 83.79 °F | 68.41 °F | 86.90 °F | 70.56 °F | 50.00 °F | 4.11 in | 0.02 in | — | — |
| May | 104.90 °F | 88.85 °F | 64.04 °F | 87.21 °F | 76.18 °F | 61.88 °F | 78.80 °F | 62.68 °F | 46.04 °F | 5.14 in | 0.04 in | — | — |
| June | 95.72 °F | 82.68 °F | 61.52 °F | 81.37 °F | 69.83 °F | 58.28 °F | 75.20 °F | 57.25 °F | 39.02 °F | 5.17 in | 0.04 in | — | — |
| July | 94.10 °F | 82.13 °F | 62.06 °F | 77.40 °F | 68.35 °F | 58.15 °F | 72.14 °F | 53.62 °F | 37.22 °F | 2.62 in | 0.01 in | — | — |
| August | 102.20 °F | 85.38 °F | 62.96 °F | 81.66 °F | 71.11 °F | 59.49 °F | 74.95 °F | 54.77 °F | 39.92 °F | 1.57 in | 0.01 in | — | — |
| September | 107.06 °F | 90.16 °F | 69.08 °F | 92.66 °F | 75.47 °F | 65.32 °F | 78.62 °F | 58.43 °F | 42.80 °F | 0.37 in | 0.00 in | — | — |
| October | 114.80 °F | 95.17 °F | 74.30 °F | 94.44 °F | 81.07 °F | 68.52 °F | 81.55 °F | 63.97 °F | 45.68 °F | 0.64 in | 0.00 in | — | — |
| November | 116.60 °F | 97.36 °F | 76.82 °F | 97.88 °F | 83.56 °F | 72.82 °F | 85.28 °F | 68.54 °F | 55.04 °F | 0.95 in | 0.00 in | — | — |
| December | 119.84 °F | 99.68 °F | 80.06 °F | 100.94 °F | 86.69 °F | 75.72 °F | 89.96 °F | 73.84 °F | 58.64 °F | 2.45 in | 0.01 in | — | — |
Data Visualisations
Remove WatermarksCurrent Year Climate Trends vs Historical


Max Temperature this Year | 1 of 6
Climate 12-Month Moving Averages


Max Temperature 12-Month MA | 1 of 6
Daily Data Points and Averages Throughout the Year


Average Max Temperature Throughout Year | 1 of 5