Climate for Station: Carnarvon Airport, Western Australia, Australia
Loading live weather...
Climate Analysis & Overview
Carnarvon Airport is experiencing a notable warming trend, with a significant increase in both high and low temperatures over the past decade. Precipitation patterns have shifted towards a more even distribution, reflecting broader regional climate adjustments in Western Australia.
Thermal Trends in Carnarvon
Carnarvon Airport, located in Western Australia, is characterised by a hot semi-arid climate under the Köppen classification. The region's proximity to the Indian Ocean influences its climate, moderating extreme temperatures but still allowing for significant thermal variations. Over the past decade, the area has seen a pronounced warming, with high temperatures rising by 1.30°C (2.34°F) and low temperatures increasing by 0.41°C (0.74°F). When considering the all-time trends, there is a consistent warming pattern with highs rising by 0.28°C (0.50°F) and lows by 0.07°C (0.13°F). This warming trend aligns with broader climatic shifts observed across Australia, where regional climate goals focus on mitigating the impacts of rising temperatures.
Record Extremes and Local Impacts
The climatic records at Carnarvon Airport reveal some of the extreme conditions the area can experience. The highest recorded temperature is a scorching 49.9°C (121.8°F), while the lowest dips to a chilly 2.4°C (36.3°F). These extremes are indicative of the region's vulnerability to temperature fluctuations, which can impact local agriculture and water resources. The warming trend observed in both high and low temperatures could exacerbate these challenges, necessitating adaptive measures to safeguard local communities and industries.
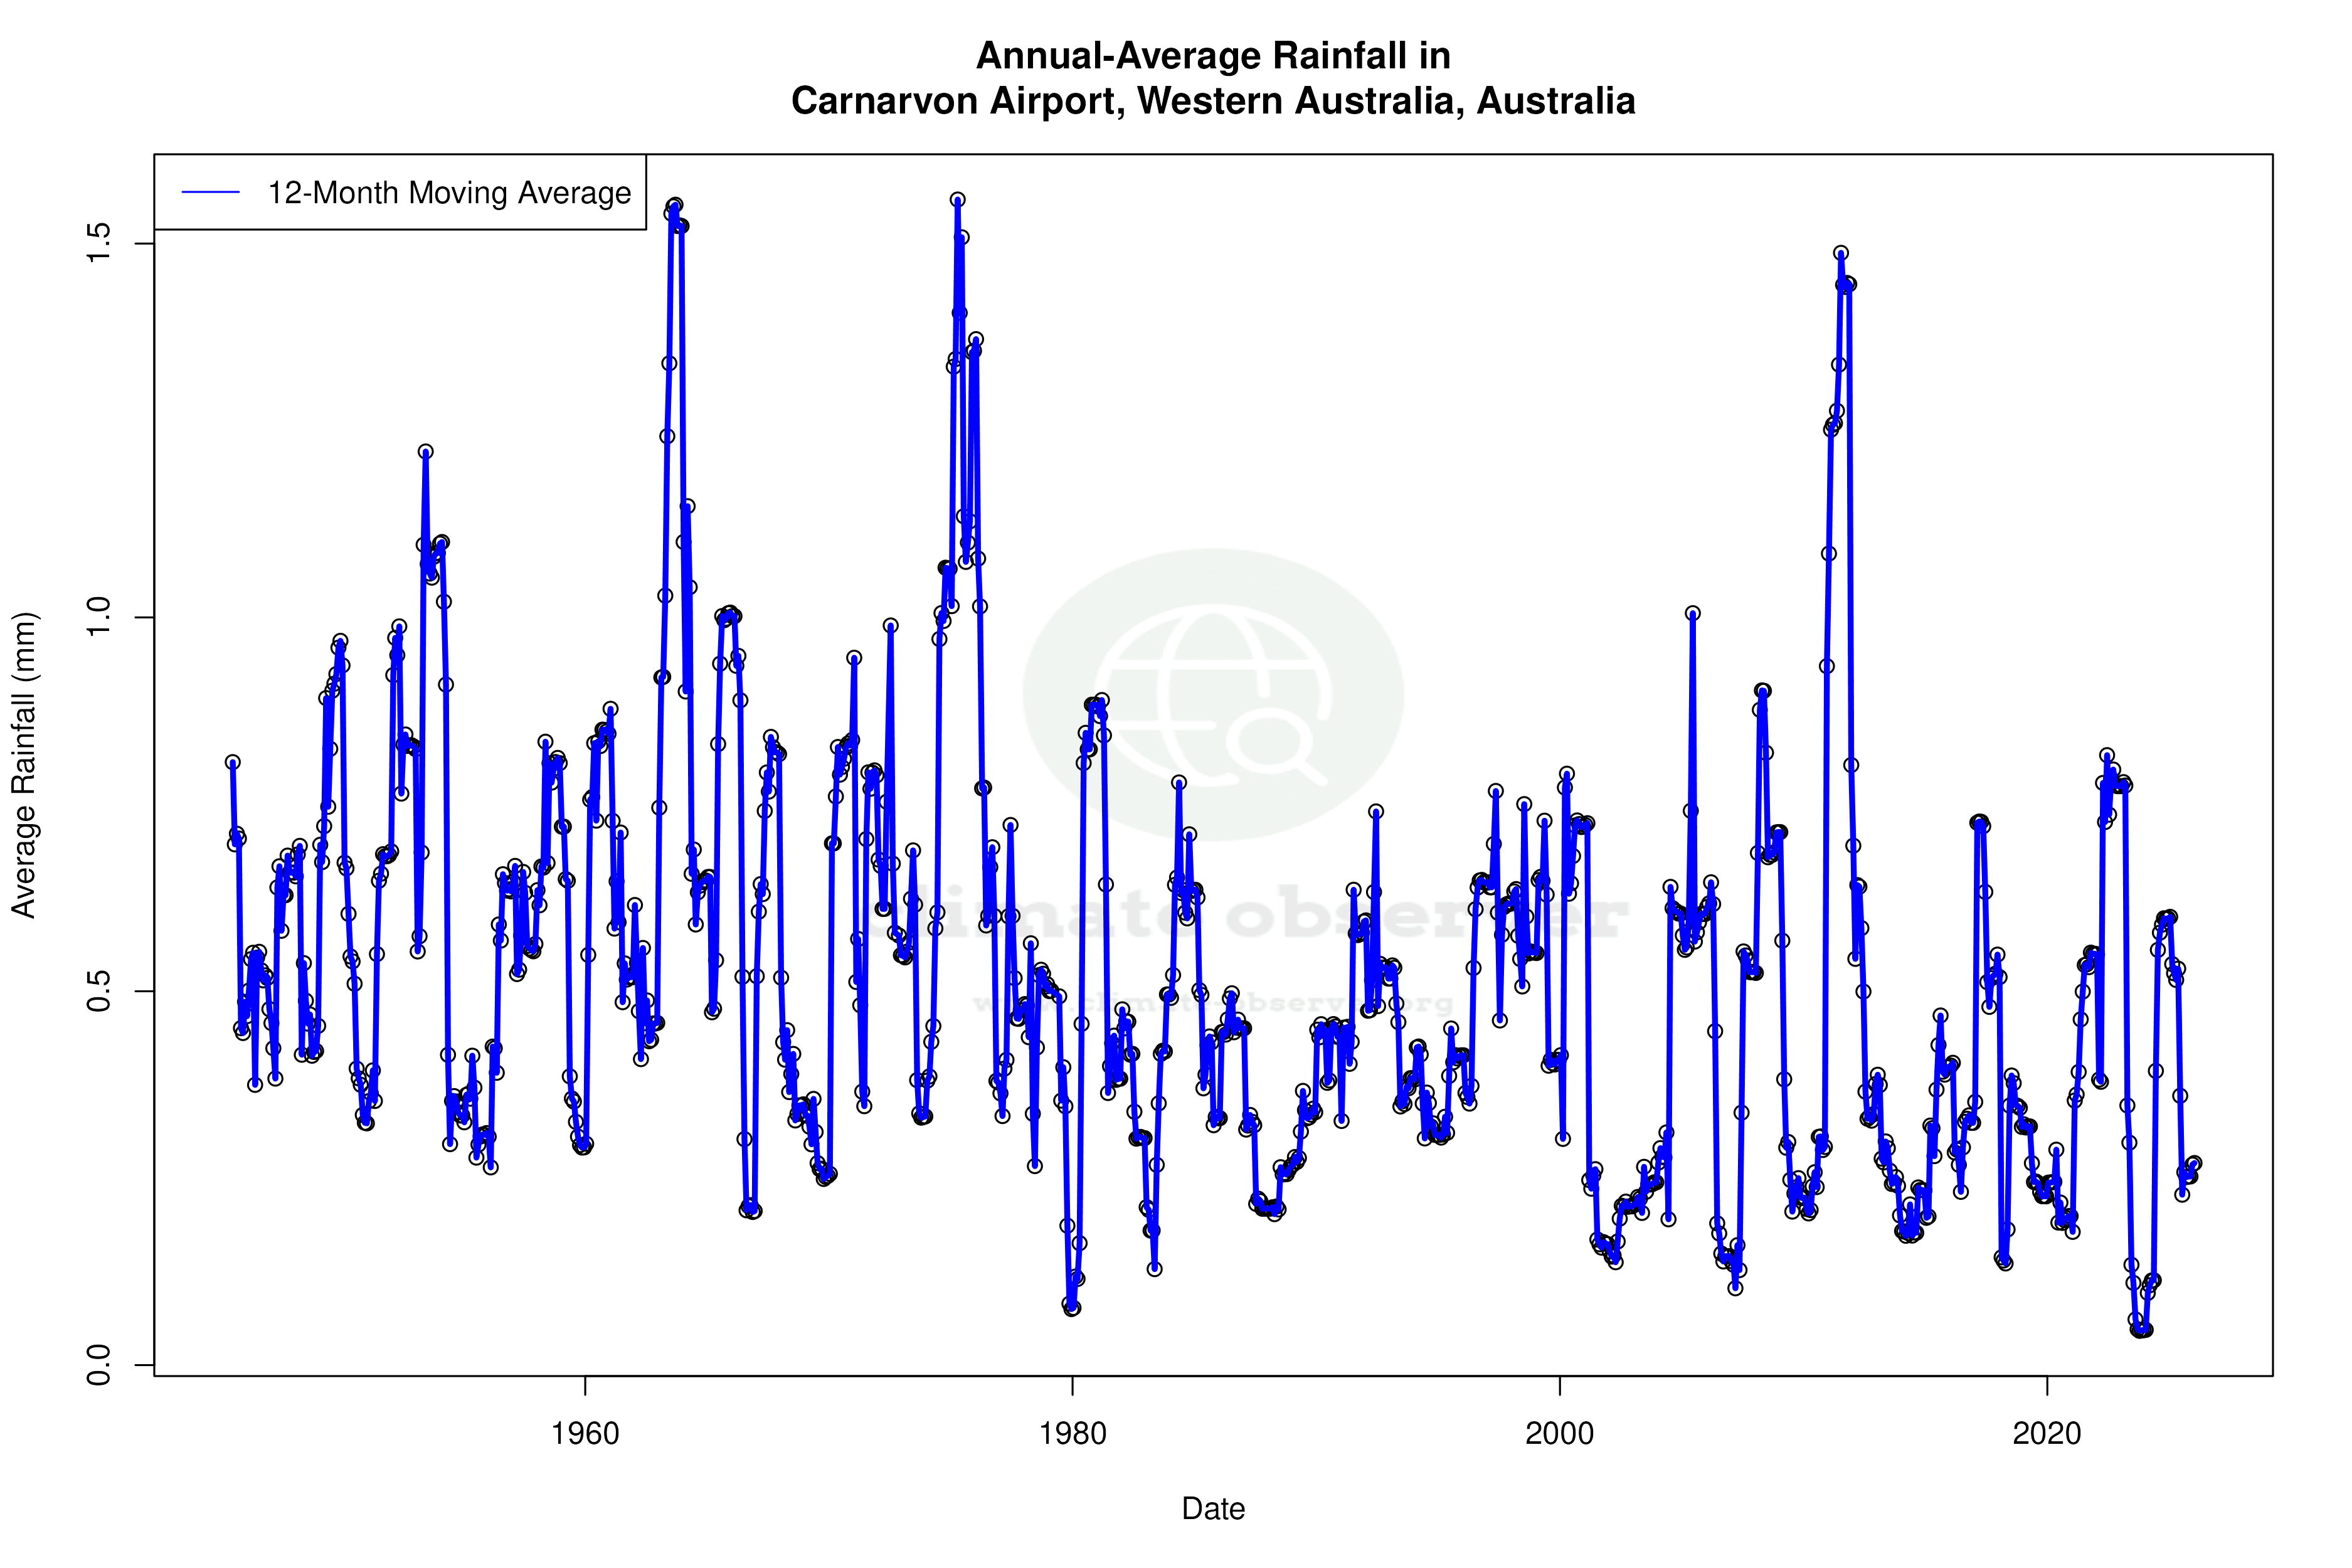
Precipitation Patterns and Distribution
Carnarvon's precipitation dynamics have undergone a notable transformation, as evidenced by the Precipitation Concentration Index (PCI). The baseline PCI was 25.0, indicating highly concentrated rainfall events. However, the current PCI has decreased to 18.7, suggesting a significant shift towards more evenly distributed rainfall throughout the year. This change could mitigate the risk of extreme flooding events, although it may also affect water availability during traditionally dry periods. Understanding these shifts is crucial for effective water management strategies in the region.
Regional Climate Context
The climate profile of Carnarvon Airport must be viewed within the broader context of Western Australia's climate policies and recent weather phenomena. The state has been actively pursuing strategies to address climate change impacts, focusing on reducing carbon emissions and enhancing resilience to extreme weather events. Recent heatwaves and shifting precipitation patterns underscore the urgency of these efforts. The data from Carnarvon provides valuable insights into the local manifestations of these broader trends, informing both policy and practice in climate adaptation and mitigation.
Implications for Future Climate Strategies
As Carnarvon Airport continues to experience warming temperatures and evolving precipitation patterns, the need for targeted climate strategies becomes increasingly apparent. The data highlights the importance of integrating scientific insights into regional planning efforts, ensuring that the community can adapt to changing conditions while contributing to national and global climate goals.
Station Statistics
10-Year Trend
High: +1.92 °F/decade
Low: +0.55 °F/decade
Rain: -0.002 in/decade
25-Year Trend
High: +1.16 °F/decade
Low: +0.61 °F/decade
Rain: -0.000 in/decade
50-Year Trend
High: +0.42 °F/decade
Low: +0.14 °F/decade
Rain: -0.001 in/decade
All-Time Trend
High: +0.46 °F/decade
Low: +0.10 °F/decade
Rain: -0.001 in/decade
Percentage Above-Average Days
Last 12 Months: 55.1%
This Year: 44.0%
Precipitation Concentration Index (PCI) ℹ️
Last 12 Months: 14.7
Historical Average: 28.6
Percentile Rank of Last 12 Months ℹ️
High: 93rd percentile
Low: 61st percentile
Rain: 32nd percentile
Change in Variance ℹ️
High: -0.6%
Low: +15.0%
Intraday: +23.8%
Data Coverage
98.0%
First Year of Data
1945
Station Location
Historical Weather Records
| Max High | Avg High | Min High | Max Avg | Avg Avg | Min Avg | Max Low | Avg Low | Min Low | Max Precipitation | Avg Precipitation | Max Snow | Avg Snow | |
|---|---|---|---|---|---|---|---|---|---|---|---|---|---|
| Record | 121.82 °F | — | 58.28 °F | 97.16 °F | — | 50.54 °F | 87.26 °F | — | 36.32 °F | 5.56 in | — | — | — |
| January | 118.22 °F | 88.69 °F | 76.64 °F | 97.16 °F | 79.40 °F | 68.54 °F | 87.26 °F | 72.74 °F | 60.62 °F | 2.03 in | 0.01 in | — | — |
| February | 121.82 °F | 90.64 °F | 75.02 °F | 95.54 °F | 81.17 °F | 70.52 °F | 86.00 °F | 74.21 °F | 60.08 °F | 4.58 in | 0.02 in | — | — |
| March | 118.04 °F | 89.21 °F | 72.14 °F | 96.08 °F | 79.63 °F | 67.10 °F | 86.54 °F | 72.03 °F | 55.76 °F | 3.01 in | 0.02 in | — | — |
| April | 105.98 °F | 84.75 °F | 69.98 °F | 89.78 °F | 75.12 °F | 61.88 °F | 78.44 °F | 66.53 °F | 48.02 °F | 5.56 in | 0.01 in | — | — |
| May | 100.76 °F | 79.73 °F | 62.78 °F | 82.94 °F | 68.77 °F | 54.50 °F | 73.58 °F | 58.66 °F | 42.98 °F | 3.74 in | 0.04 in | — | — |
| June | 89.96 °F | 74.44 °F | 58.28 °F | 76.28 °F | 63.72 °F | 51.62 °F | 68.72 °F | 53.95 °F | 38.48 °F | 3.79 in | 0.06 in | — | — |
| July | 90.50 °F | 72.56 °F | 59.54 °F | 73.58 °F | 61.75 °F | 50.54 °F | 67.28 °F | 51.50 °F | 36.32 °F | 3.22 in | 0.05 in | — | — |
| August | 92.48 °F | 73.89 °F | 59.54 °F | 75.92 °F | 63.52 °F | 52.34 °F | 67.46 °F | 52.86 °F | 38.12 °F | 1.39 in | 0.02 in | — | — |
| September | 99.14 °F | 76.40 °F | 64.94 °F | 82.04 °F | 66.93 °F | 56.48 °F | 69.44 °F | 56.98 °F | 42.62 °F | 0.74 in | 0.01 in | — | — |
| October | 105.26 °F | 79.01 °F | 66.02 °F | 85.64 °F | 69.93 °F | 57.74 °F | 75.92 °F | 61.68 °F | 46.58 °F | 1.64 in | 0.01 in | — | — |
| November | 106.27 °F | 81.99 °F | 69.80 °F | 88.88 °F | 72.96 °F | 62.78 °F | 79.52 °F | 65.71 °F | 51.26 °F | 3.20 in | 0.00 in | — | — |
| December | 111.56 °F | 85.17 °F | 71.96 °F | 92.66 °F | 76.16 °F | 66.92 °F | 81.14 °F | 69.42 °F | 57.20 °F | 4.51 in | 0.00 in | — | — |
Data Visualisations
Remove WatermarksCurrent Year Climate Trends vs Historical


Max Temperature this Year | 1 of 6
Climate 12-Month Moving Averages


Max Temperature 12-Month MA | 1 of 6
Daily Data Points and Averages Throughout the Year


Average Max Temperature Throughout Year | 1 of 5
