Climate for Station: Meekatharra Airport, Western Australia, Australia
Loading live weather...
Climate Analysis & Overview
Meekatharra Airport has experienced a noticeable warming trend over the past decade, with highs increasing by 0.74°C (1.33°F) and lows by 1.07°C (1.93°F). The all-time data indicates a more modest warming, suggesting a complex interplay between short-term variability and long-term climate shifts. Precipitation patterns have become more evenly distributed, reflecting regional efforts towards sustainable water management.
Desert Climate Dynamics
Meekatharra Airport, located in the arid heart of Western Australia, falls under the Köppen climate classification of BWh, denoting a hot desert climate. This classification is characterised by high temperatures and low precipitation, influenced by the region's flat topography and distance from the coast. The all-time temperature trends reveal a warming of 0.28°C (0.50°F) for highs and 0.18°C (0.32°F) for lows, suggesting a gradual rise in temperatures over the years. This warming trend aligns with broader patterns observed across Australia, where climate change mitigation is a national priority.
Short-term Thermal Variability
The past decade has seen a more pronounced warming trend at Meekatharra Airport, with highs increasing by 0.74°C (1.33°F) and lows by 1.07°C (1.93°F). These figures indicate a more rapid change in recent years compared to the all-time trends. This could be attributed to a combination of natural variability and anthropogenic influences, such as increased greenhouse gas emissions. The record high of 47.1°C (116.8°F) and a low of -0.2°C (31.6°F) highlight the extreme temperature fluctuations that can occur in desert environments.
Precipitation Patterns and Distribution
The Precipitation Concentration Index (PCI) at Meekatharra Airport has decreased from a baseline of 21.1 to the current value of 15.8. This significant change indicates that rainfall events are now more evenly distributed throughout the year, rather than being concentrated in fewer, intense events. Such a shift can be beneficial for water management and agriculture, reducing the risk of flooding and enhancing water availability during dry periods. This trend is consistent with regional climate adaptation strategies aimed at improving resilience to climate variability.
Regional Climate Goals and Adaptation
Australia's commitment to addressing climate change is reflected in the observed climate trends at Meekatharra Airport. The focus on reducing emissions and enhancing water management has likely contributed to the more even distribution of precipitation. As part of the broader effort to meet international climate targets, these local changes underscore the importance of integrating scientific insights into policy and planning.
Station Statistics
10-Year Trend
High: +3.78 °F/decade
Low: +4.12 °F/decade
Rain: -0.002 in/decade
25-Year Trend
High: +1.12 °F/decade
Low: +1.24 °F/decade
Rain: +0.001 in/decade
50-Year Trend
High: +0.53 °F/decade
Low: +0.36 °F/decade
Rain: +0.000 in/decade
All-Time Trend
High: +0.49 °F/decade
Low: +0.30 °F/decade
Rain: -0.000 in/decade
Percentage Above-Average Days
Last 12 Months: 56.4%
This Year: 79.2%
Precipitation Concentration Index (PCI) ℹ️
Last 12 Months: 12.2
Historical Average: 21.4
Percentile Rank of Last 12 Months ℹ️
High: 86th percentile
Low: 87th percentile
Rain: 30th percentile
Change in Variance ℹ️
High: +2.0%
Low: +8.0%
Intraday: +3.6%
Data Coverage
94.5%
First Year of Data
1944
Station Location
Historical Weather Records
| Max High | Avg High | Min High | Max Avg | Avg Avg | Min Avg | Max Low | Avg Low | Min Low | Max Precipitation | Avg Precipitation | Max Snow | Avg Snow | |
|---|---|---|---|---|---|---|---|---|---|---|---|---|---|
| Record | 116.78 °F | — | 48.92 °F | 102.45 °F | — | 41.18 °F | 91.76 °F | — | 31.64 °F | 4.06 in | — | — | — |
| January | 116.78 °F | 101.34 °F | 69.08 °F | 102.45 °F | 88.59 °F | 59.72 °F | 91.76 °F | 76.13 °F | 53.96 °F | 4.06 in | 0.03 in | — | — |
| February | 116.42 °F | 98.59 °F | 68.72 °F | 101.48 °F | 86.34 °F | 65.66 °F | 90.32 °F | 74.95 °F | 54.14 °F | 2.35 in | 0.04 in | — | — |
| March | 112.10 °F | 94.02 °F | 65.30 °F | 99.50 °F | 81.98 °F | 59.72 °F | 87.44 °F | 70.70 °F | 50.54 °F | 2.28 in | 0.03 in | — | — |
| April | 105.08 °F | 85.02 °F | 62.06 °F | 88.57 °F | 73.46 °F | 53.78 °F | 82.22 °F | 62.84 °F | 42.26 °F | 1.46 in | 0.02 in | — | — |
| May | 96.80 °F | 75.20 °F | 54.50 °F | 84.74 °F | 64.00 °F | 47.66 °F | 71.78 °F | 53.76 °F | 35.06 °F | 1.44 in | 0.02 in | — | — |
| June | 84.20 °F | 67.78 °F | 49.46 °F | 73.04 °F | 57.33 °F | 41.54 °F | 64.76 °F | 47.75 °F | 32.72 °F | 2.38 in | 0.03 in | — | — |
| July | 84.56 °F | 66.76 °F | 48.92 °F | 70.88 °F | 55.71 °F | 41.18 °F | 63.86 °F | 45.29 °F | 31.64 °F | 2.44 in | 0.02 in | — | — |
| August | 92.12 °F | 71.25 °F | 52.34 °F | 78.62 °F | 59.28 °F | 43.88 °F | 70.88 °F | 47.68 °F | 32.00 °F | 0.92 in | 0.01 in | — | — |
| September | 101.30 °F | 78.64 °F | 55.94 °F | 87.80 °F | 65.66 °F | 47.84 °F | 75.20 °F | 52.97 °F | 37.40 °F | 0.66 in | 0.00 in | — | — |
| October | 105.80 °F | 86.13 °F | 61.34 °F | 93.38 °F | 73.01 °F | 51.08 °F | 81.32 °F | 59.69 °F | 39.74 °F | 1.14 in | 0.01 in | — | — |
| November | 111.20 °F | 92.30 °F | 60.08 °F | 96.73 °F | 79.29 °F | 56.30 °F | 84.38 °F | 65.98 °F | 46.40 °F | 3.22 in | 0.01 in | — | — |
| December | 114.80 °F | 98.18 °F | 69.62 °F | 100.22 °F | 85.30 °F | 63.14 °F | 89.42 °F | 72.18 °F | 51.98 °F | 1.75 in | 0.01 in | — | — |
Data Visualisations
Remove WatermarksCurrent Year Climate Trends vs Historical


Max Temperature this Year | 1 of 6
Climate 12-Month Moving Averages


Max Temperature 12-Month MA | 1 of 6
Daily Data Points and Averages Throughout the Year


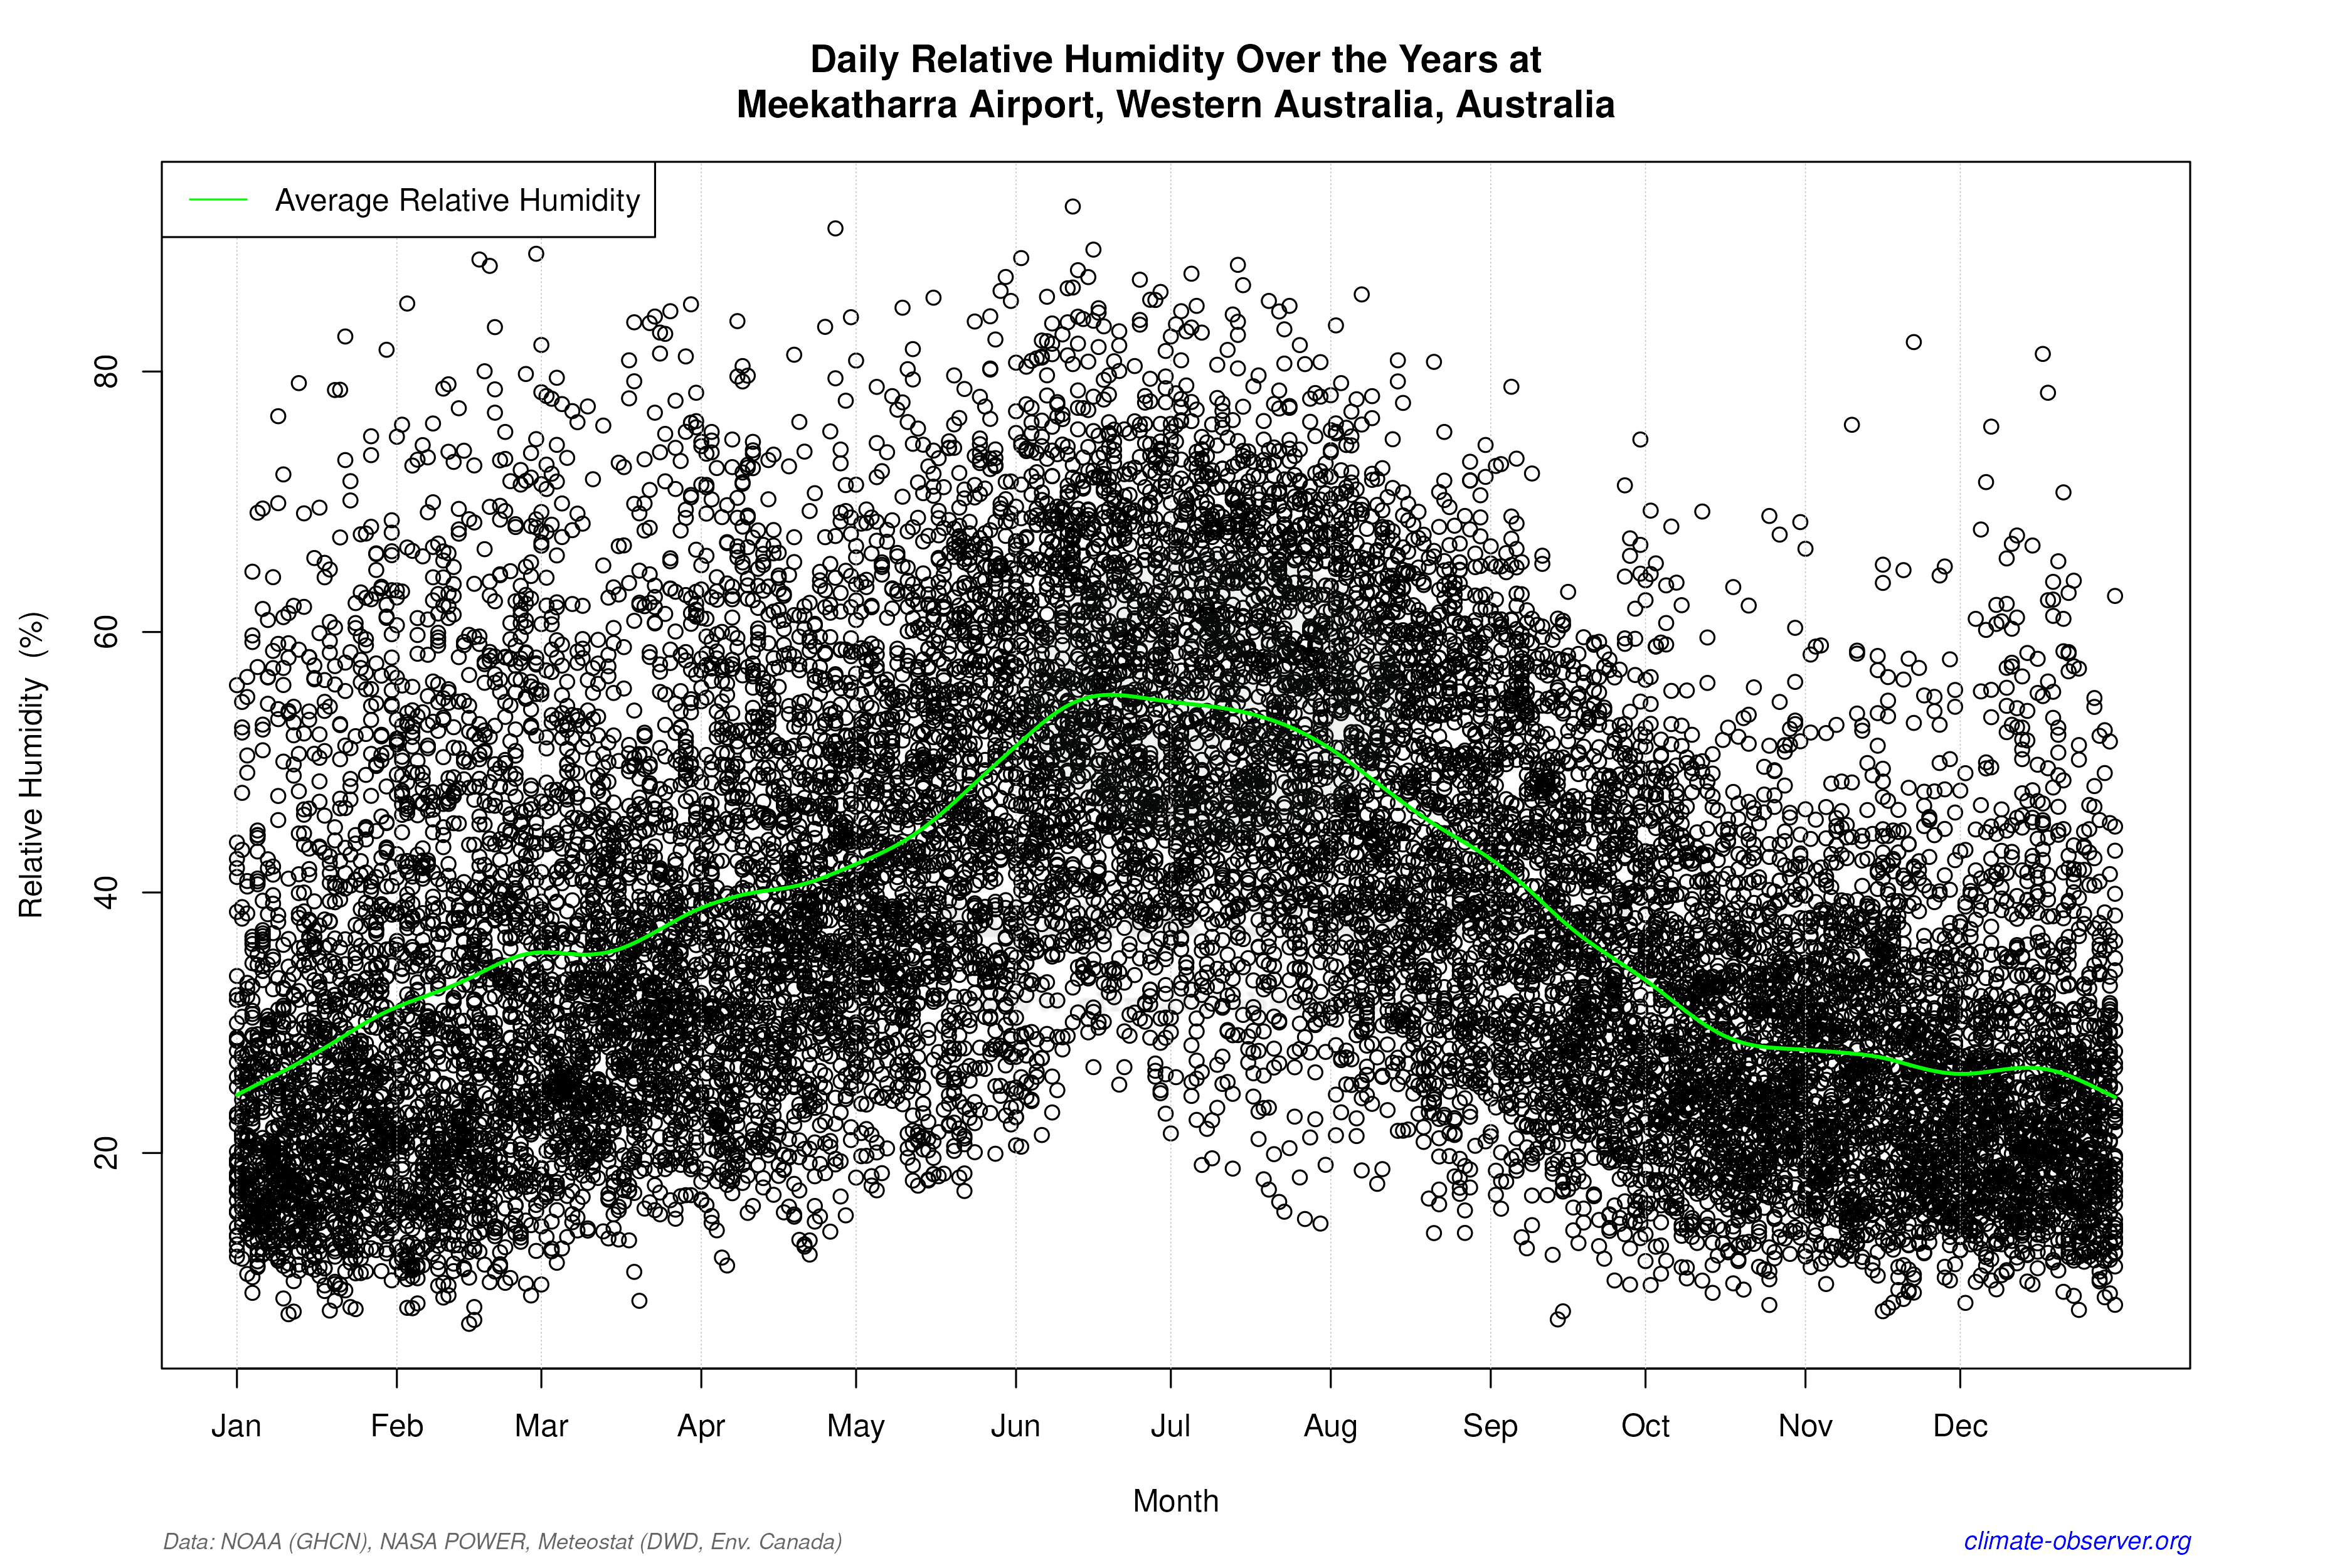

Average Max Temperature Throughout Year | 1 of 5
