Climate for Station: Cape Leeuwin, Western Australia, Australia
Loading live weather...
Climate Analysis & Overview
Cape Leeuwin, located at the southwestern tip of Australia, is experiencing a warming trend with a notable increase in both high and low temperatures over the past decade. The precipitation is becoming slightly more evenly distributed, indicating subtle shifts in the region's climate dynamics.
Cape Leeuwin's Climatic Identity
Cape Leeuwin, situated at -34.37° latitude and 115.14° longitude, is characterised by a Mediterranean climate, defined by wet winters and dry summers. This is classified under the Köppen climate system as Csb. The proximity to the Indian Ocean significantly influences its weather patterns, moderating temperatures and contributing to its precipitation profile. The region's climate is being reshaped by a warming trend, with both highs and lows showing an increase over the past decade.
Temperature Trends: A Decade of Warming
Over the past ten years, Cape Leeuwin has experienced a warming trend with high temperatures increasing by 1.18°C (2.12°F) and low temperatures rising by 0.87°C (1.57°F). This recent trend is more pronounced than the all-time warming trend, where highs have increased by 0.09°C (0.16°F) and lows by 0.07°C (0.13°F). This suggests a more rapid warming in recent years, which aligns with broader regional patterns observed across Western Australia.
Precipitation Patterns: A Slight Shift
The Precipitation Concentration Index (PCI) for Cape Leeuwin indicates a slight shift towards more evenly distributed rainfall. The baseline PCI of 13.92 has decreased to a current value of 13.71. This marginal change suggests that precipitation events are becoming slightly more regular throughout the year. While not a drastic shift, it reflects subtle changes in the precipitation dynamics, potentially influenced by broader climatic changes.
Temperature Extremes: Records in Context
The record high temperature at Cape Leeuwin stands at 33.6°C (92.5°F), while the record low is 3.3°C (37.9°F). These extremes highlight the range of temperatures the region can experience, although such values remain relatively moderate due to the oceanic influence. The warming trends observed may lead to more frequent occurrences of higher temperatures, impacting local ecosystems and human activities.
Regional Climate Goals and Implications
Australia's commitment to reducing greenhouse gas emissions and adapting to climate change is crucial for regions like Cape Leeuwin. The observed warming trends and slight shifts in precipitation patterns underscore the importance of these efforts. Recent weather events, such as increased heatwaves, further highlight the need for adaptive strategies to mitigate the impacts of climate change on local communities and natural resources.
Station Statistics
10-Year Trend
High: +1.50 °F/decade
Low: +1.38 °F/decade
Rain: -0.008 in/decade
25-Year Trend
High: +0.69 °F/decade
Low: +0.38 °F/decade
Rain: +0.003 in/decade
50-Year Trend
High: +0.20 °F/decade
Low: +0.28 °F/decade
Rain: -0.007 in/decade
All-Time Trend
High: +0.16 °F/decade
Low: +0.14 °F/decade
Rain: -0.003 in/decade
Percentage Above-Average Days
Last 12 Months: 47.7%
This Year: 28.9%
Precipitation Concentration Index (PCI) ℹ️
Last 12 Months: 12.6
Historical Average: 15.5
Percentile Rank of Last 12 Months ℹ️
High: 81st percentile
Low: 85th percentile
Rain: 37th percentile
Change in Variance ℹ️
High: -10.5%
Low: -2.5%
Intraday: +4.1%
Data Coverage
83.2%
First Year of Data
1903
Station Location
Historical Weather Records
| Max High | Avg High | Min High | Max Avg | Avg Avg | Min Avg | Max Low | Avg Low | Min Low | Max Precipitation | Avg Precipitation | Max Snow | Avg Snow | |
|---|---|---|---|---|---|---|---|---|---|---|---|---|---|
| Record | 92.66 °F | — | 50.18 °F | 82.58 °F | — | 48.74 °F | 75.92 °F | — | 37.94 °F | 4.85 in | — | — | — |
| January | 90.50 °F | 73.43 °F | 61.34 °F | 80.06 °F | 67.89 °F | 59.90 °F | 74.30 °F | 62.67 °F | 48.92 °F | 2.16 in | 0.02 in | — | — |
| February | 92.66 °F | 73.89 °F | 61.52 °F | 81.14 °F | 68.36 °F | 60.08 °F | 75.02 °F | 63.25 °F | 50.00 °F | 4.03 in | 0.02 in | — | — |
| March | 92.48 °F | 72.76 °F | 59.00 °F | 82.58 °F | 67.61 °F | 57.92 °F | 75.92 °F | 62.29 °F | 46.40 °F | 3.34 in | 0.03 in | — | — |
| April | 92.12 °F | 70.37 °F | 57.02 °F | 77.72 °F | 65.55 °F | 53.24 °F | 72.32 °F | 59.94 °F | 44.96 °F | 2.71 in | 0.08 in | — | — |
| May | 84.74 °F | 66.74 °F | 55.22 °F | 73.58 °F | 62.73 °F | 53.96 °F | 68.54 °F | 56.89 °F | 41.54 °F | 4.85 in | 0.17 in | — | — |
| June | 76.10 °F | 63.47 °F | 51.08 °F | 73.04 °F | 59.67 °F | 49.64 °F | 65.52 °F | 54.14 °F | 37.94 °F | 4.69 in | 0.23 in | — | — |
| July | 72.50 °F | 61.71 °F | 52.88 °F | 66.92 °F | 58.11 °F | 48.74 °F | 63.86 °F | 52.50 °F | 39.92 °F | 4.11 in | 0.23 in | — | — |
| August | 77.90 °F | 61.78 °F | 50.18 °F | 67.28 °F | 58.04 °F | 49.28 °F | 64.04 °F | 52.31 °F | 41.00 °F | 3.11 in | 0.17 in | — | — |
| September | 78.98 °F | 62.88 °F | 52.52 °F | 71.24 °F | 58.91 °F | 51.08 °F | 64.76 °F | 53.31 °F | 39.56 °F | 3.00 in | 0.12 in | — | — |
| October | 81.86 °F | 64.86 °F | 53.78 °F | 73.58 °F | 60.46 °F | 50.36 °F | 66.38 °F | 54.76 °F | 39.74 °F | 1.95 in | 0.08 in | — | — |
| November | 86.00 °F | 68.13 °F | 55.58 °F | 77.72 °F | 63.16 °F | 49.46 °F | 68.90 °F | 57.66 °F | 41.00 °F | 3.00 in | 0.05 in | — | — |
| December | 87.98 °F | 71.12 °F | 59.00 °F | 79.52 °F | 65.76 °F | 57.92 °F | 71.60 °F | 60.49 °F | 48.92 °F | 3.74 in | 0.02 in | — | — |
Data Visualisations
Remove WatermarksCurrent Year Climate Trends vs Historical
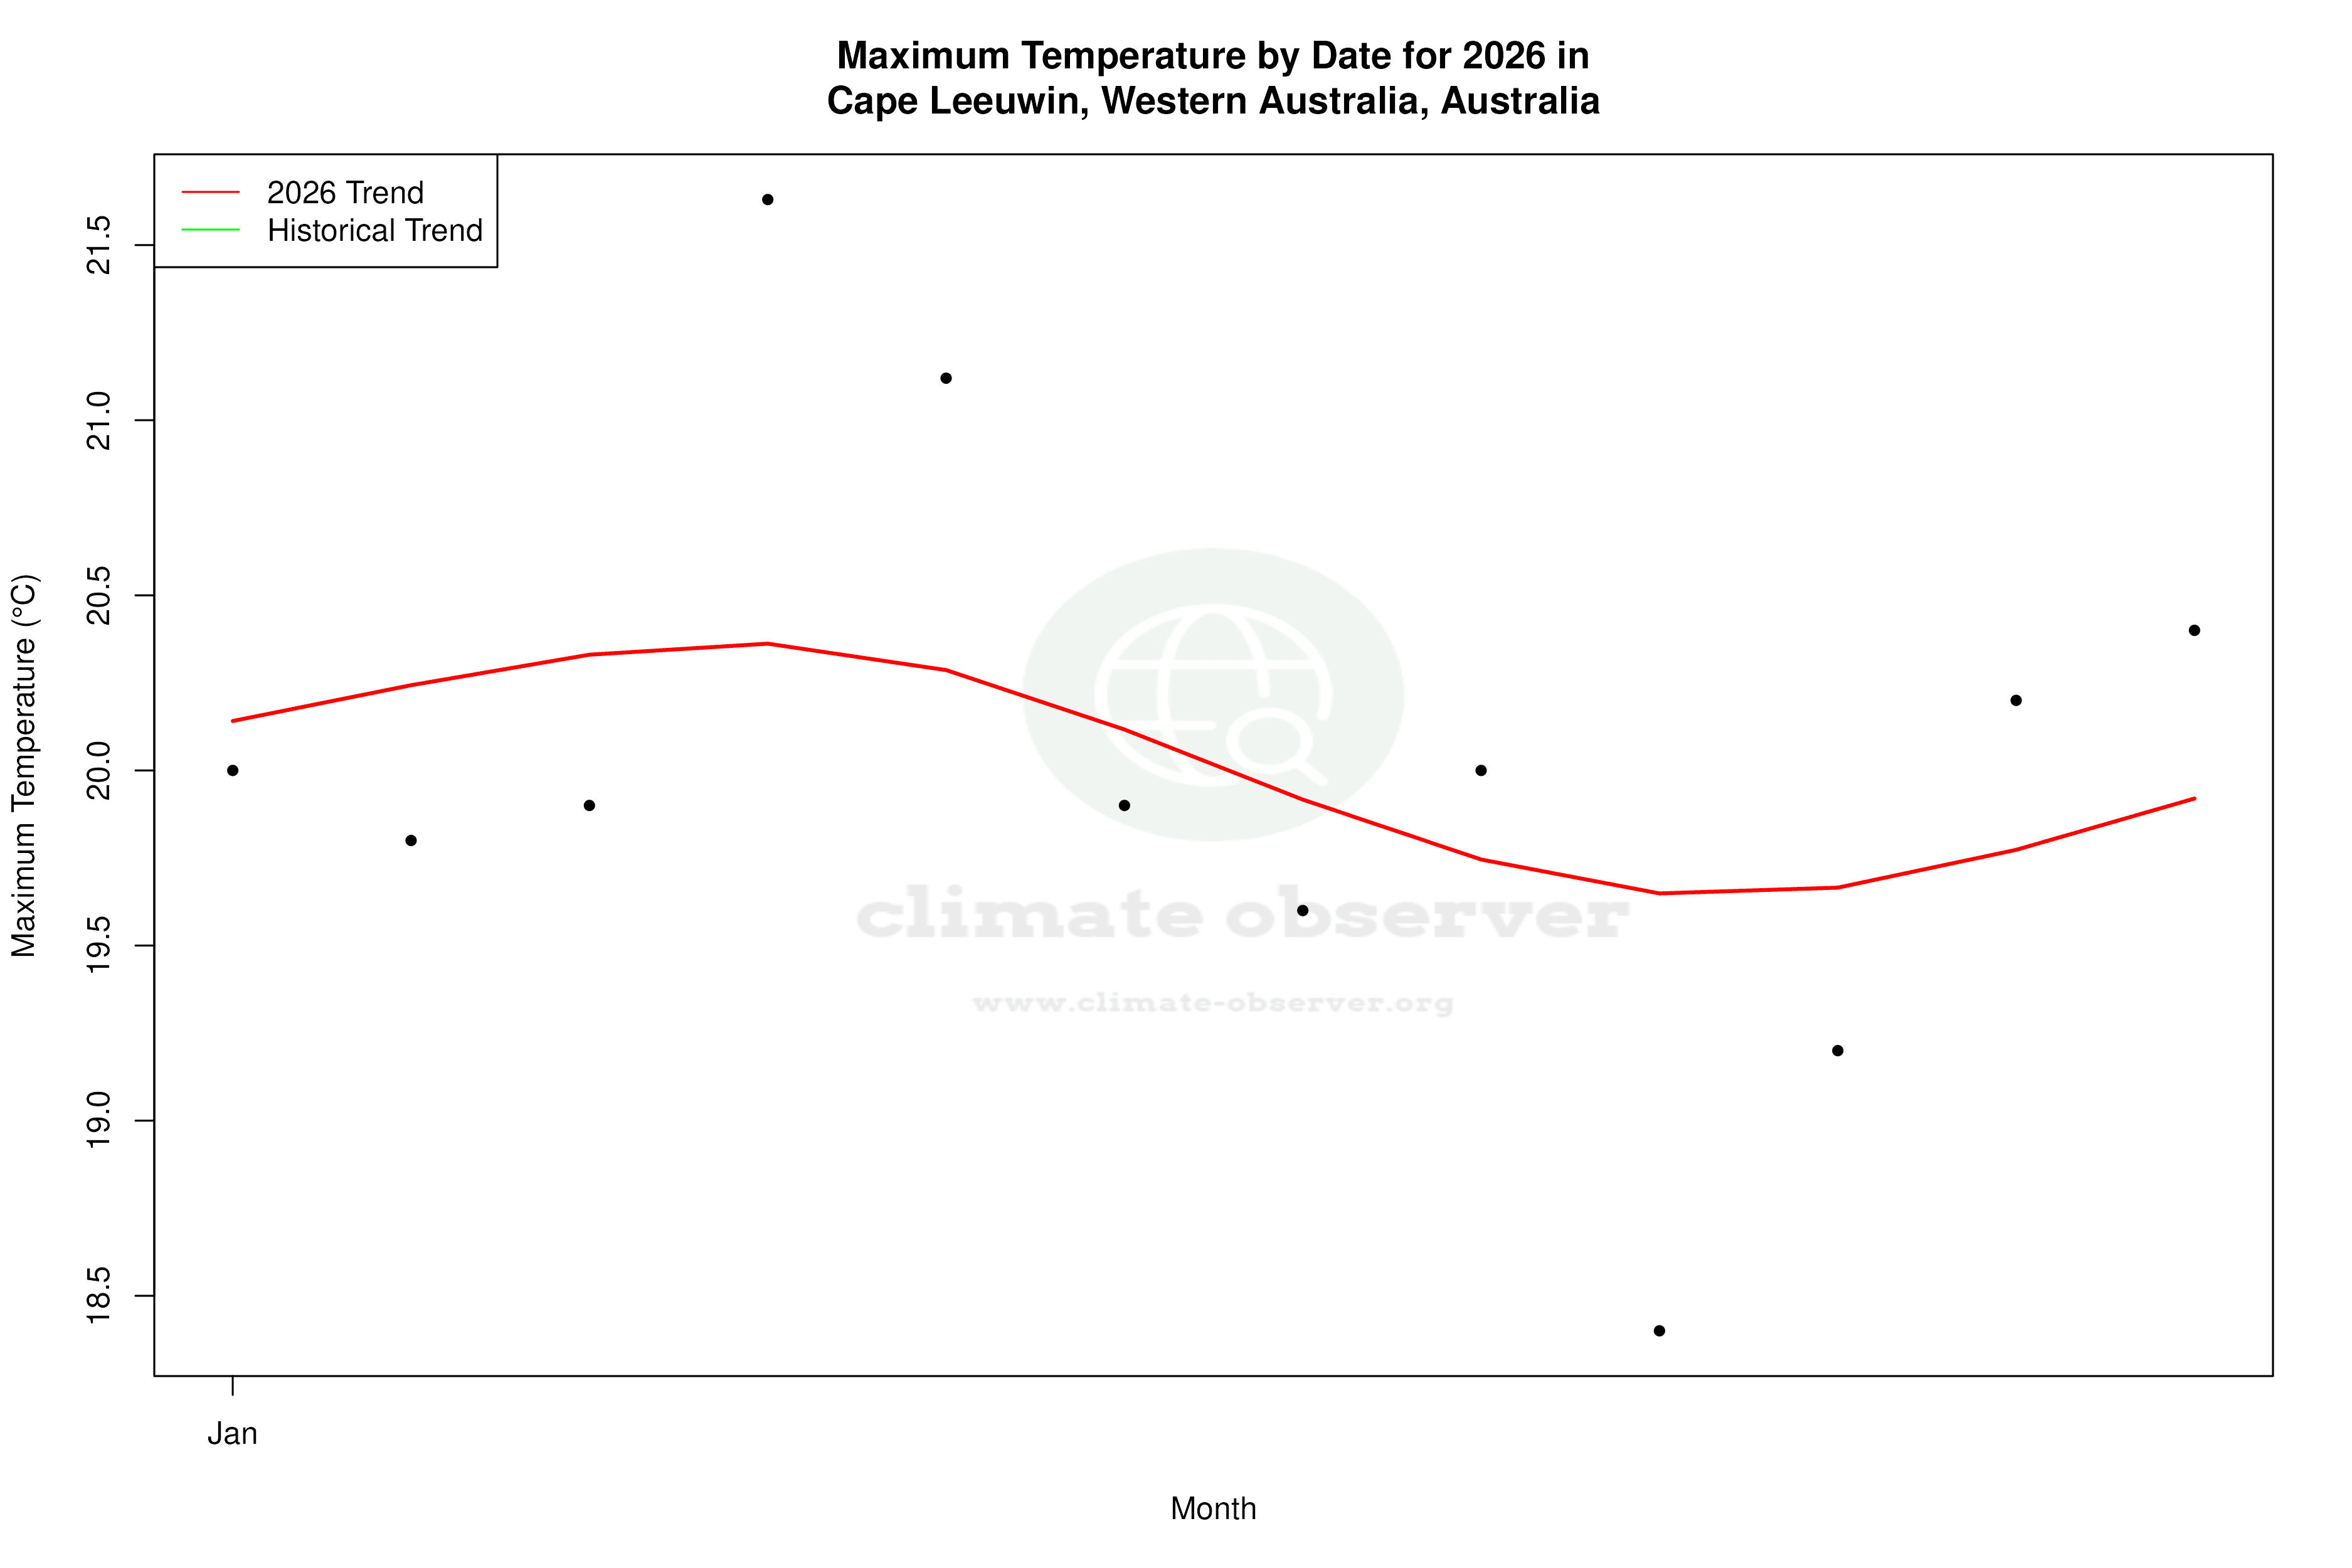


Max Temperature this Year | 1 of 6
Climate 12-Month Moving Averages


Max Temperature 12-Month MA | 1 of 6
Daily Data Points and Averages Throughout the Year


Average Max Temperature Throughout Year | 1 of 5
