Climate for Station: Eucla, Western Australia, Australia
Loading live weather...
Climate Analysis & Overview
Eucla's climate is experiencing a subtle shift, marked by a long-term warming trend in both highs and lows, despite a recent cooling in high temperatures over the past decade. Precipitation patterns are becoming slightly more even, suggesting a potential shift in rainfall dynamics.
A Warming Landscape
Eucla, situated in the Shire of Dundas, Western Australia, is characterised by a semi-arid climate under the Köppen classification. Its geographical position near the southern coast influences its weather patterns, with the Indian Ocean moderating temperatures and affecting precipitation. Over the long term, the region has experienced a warming trend, with all-time high temperatures rising by 0.25°C (0.45°F). This increase is mirrored in the low temperatures, which have risen by 0.12°C (0.22°F). These trends suggest a gradual warming of the overall climate, potentially impacting local ecosystems and human activities.
Decadal Temperature Dynamics
In contrast to the long-term warming, the past decade has seen a cooling trend in high temperatures, with a decrease of 0.18°C (0.32°F). This anomaly could be attributed to various factors, including changes in ocean currents or atmospheric patterns. Meanwhile, low temperatures have continued to rise over the same period, with an increase of 0.61°C (1.10°F). This divergence between highs and lows may indicate more pronounced diurnal temperature variations, which could affect agriculture and energy consumption in the area.
Precipitation Patterns: A Subtle Shift
The Precipitation Concentration Index (PCI) for Eucla has shown a slight decrease, from a baseline of 15.95 to a current value of 15.16. The PCI measures how rainfall is distributed throughout the year, with lower values indicating a more even distribution. This marginal change suggests that rainfall events may be becoming more evenly spread, potentially reducing the risk of droughts and floods. Such a shift could have significant implications for water resource management and agricultural planning in the region.
Record Extremes and Climate Resilience
Eucla's climate extremes are marked by a record high of 49.8°C (121.6°F) and a record low of -0.6°C (30.9°F). These extremes highlight the region's vulnerability to temperature fluctuations, which could become more pronounced with ongoing climate change. The resilience of local infrastructure and ecosystems will be crucial in adapting to these potential challenges.
Regional Climate Context
Australia's commitment to reducing greenhouse gas emissions and adapting to climate change provides a backdrop for understanding Eucla's climate dynamics. Recent weather events, such as heatwaves and unseasonal rainfall, underscore the importance of monitoring and responding to climate trends. As Eucla navigates these changes, the integration of climate data into regional planning will be essential for sustainable development and environmental stewardship.
Station Statistics
10-Year Trend
High: -0.40 °F/decade
Low: +0.65 °F/decade
Rain: -0.003 in/decade
25-Year Trend
High: +0.36 °F/decade
Low: +0.18 °F/decade
Rain: -0.003 in/decade
50-Year Trend
High: +0.43 °F/decade
Low: +0.23 °F/decade
Rain: -0.001 in/decade
All-Time Trend
High: +0.43 °F/decade
Low: +0.16 °F/decade
Rain: +0.000 in/decade
Percentage Above-Average Days
Last 12 Months: 46.8%
This Year: 42.8%
Precipitation Concentration Index (PCI) ℹ️
Last 12 Months: 10.8
Historical Average: 13.5
Percentile Rank of Last 12 Months ℹ️
High: 84th percentile
Low: 74th percentile
Rain: 28th percentile
Change in Variance ℹ️
High: -2.7%
Low: +0.6%
Intraday: +1.8%
Data Coverage
48.4%
First Year of Data
1878
Station Location
Historical Weather Records
| Max High | Avg High | Min High | Max Avg | Avg Avg | Min Avg | Max Low | Avg Low | Min Low | Max Precipitation | Avg Precipitation | Max Snow | Avg Snow | |
|---|---|---|---|---|---|---|---|---|---|---|---|---|---|
| Record | 121.64 °F | — | 48.92 °F | 98.04 °F | — | 43.16 °F | 81.50 °F | — | 30.92 °F | 4.53 in | — | — | — |
| January | 117.50 °F | 80.24 °F | 62.96 °F | 97.16 °F | 70.51 °F | 60.26 °F | 81.32 °F | 62.07 °F | 42.80 °F | 2.13 in | 0.02 in | — | — |
| February | 114.57 °F | 79.63 °F | 62.06 °F | 98.04 °F | 70.62 °F | 60.26 °F | 81.32 °F | 62.78 °F | 46.04 °F | 4.53 in | 0.02 in | — | — |
| March | 112.28 °F | 77.97 °F | 64.94 °F | 91.20 °F | 68.48 °F | 55.94 °F | 81.50 °F | 60.57 °F | 44.06 °F | 2.02 in | 0.03 in | — | — |
| April | 107.60 °F | 75.58 °F | 59.00 °F | 88.34 °F | 65.41 °F | 53.78 °F | 74.30 °F | 56.17 °F | 35.60 °F | 1.63 in | 0.03 in | — | — |
| May | 97.70 °F | 70.32 °F | 53.06 °F | 81.68 °F | 60.25 °F | 49.46 °F | 70.70 °F | 51.02 °F | 32.00 °F | 2.96 in | 0.04 in | — | — |
| June | 91.94 °F | 65.99 °F | 50.36 °F | 70.16 °F | 55.71 °F | 44.96 °F | 66.02 °F | 46.87 °F | 32.00 °F | 1.43 in | 0.04 in | — | — |
| July | 86.54 °F | 64.81 °F | 48.92 °F | 73.22 °F | 54.42 °F | 43.16 °F | 60.26 °F | 44.76 °F | 30.92 °F | 1.03 in | 0.03 in | — | — |
| August | 94.46 °F | 67.25 °F | 51.08 °F | 75.92 °F | 56.29 °F | 45.32 °F | 62.06 °F | 45.63 °F | 32.00 °F | 2.02 in | 0.03 in | — | — |
| September | 104.18 °F | 71.54 °F | 53.78 °F | 87.44 °F | 59.77 °F | 46.22 °F | 70.88 °F | 48.65 °F | 32.90 °F | 1.57 in | 0.03 in | — | — |
| October | 109.22 °F | 75.34 °F | 55.22 °F | 87.26 °F | 62.87 °F | 50.36 °F | 77.90 °F | 52.61 °F | 34.70 °F | 1.30 in | 0.02 in | — | — |
| November | 112.10 °F | 77.02 °F | 59.54 °F | 89.20 °F | 65.46 °F | 52.88 °F | 80.24 °F | 56.14 °F | 39.38 °F | 1.66 in | 0.02 in | — | — |
| December | 121.64 °F | 78.76 °F | 60.98 °F | 95.70 °F | 68.27 °F | 58.46 °F | 80.06 °F | 59.22 °F | 44.42 °F | 2.56 in | 0.02 in | — | — |
Data Visualisations
Remove WatermarksCurrent Year Climate Trends vs Historical


Max Temperature this Year | 1 of 6
Climate 12-Month Moving Averages


Max Temperature 12-Month MA | 1 of 6
Daily Data Points and Averages Throughout the Year


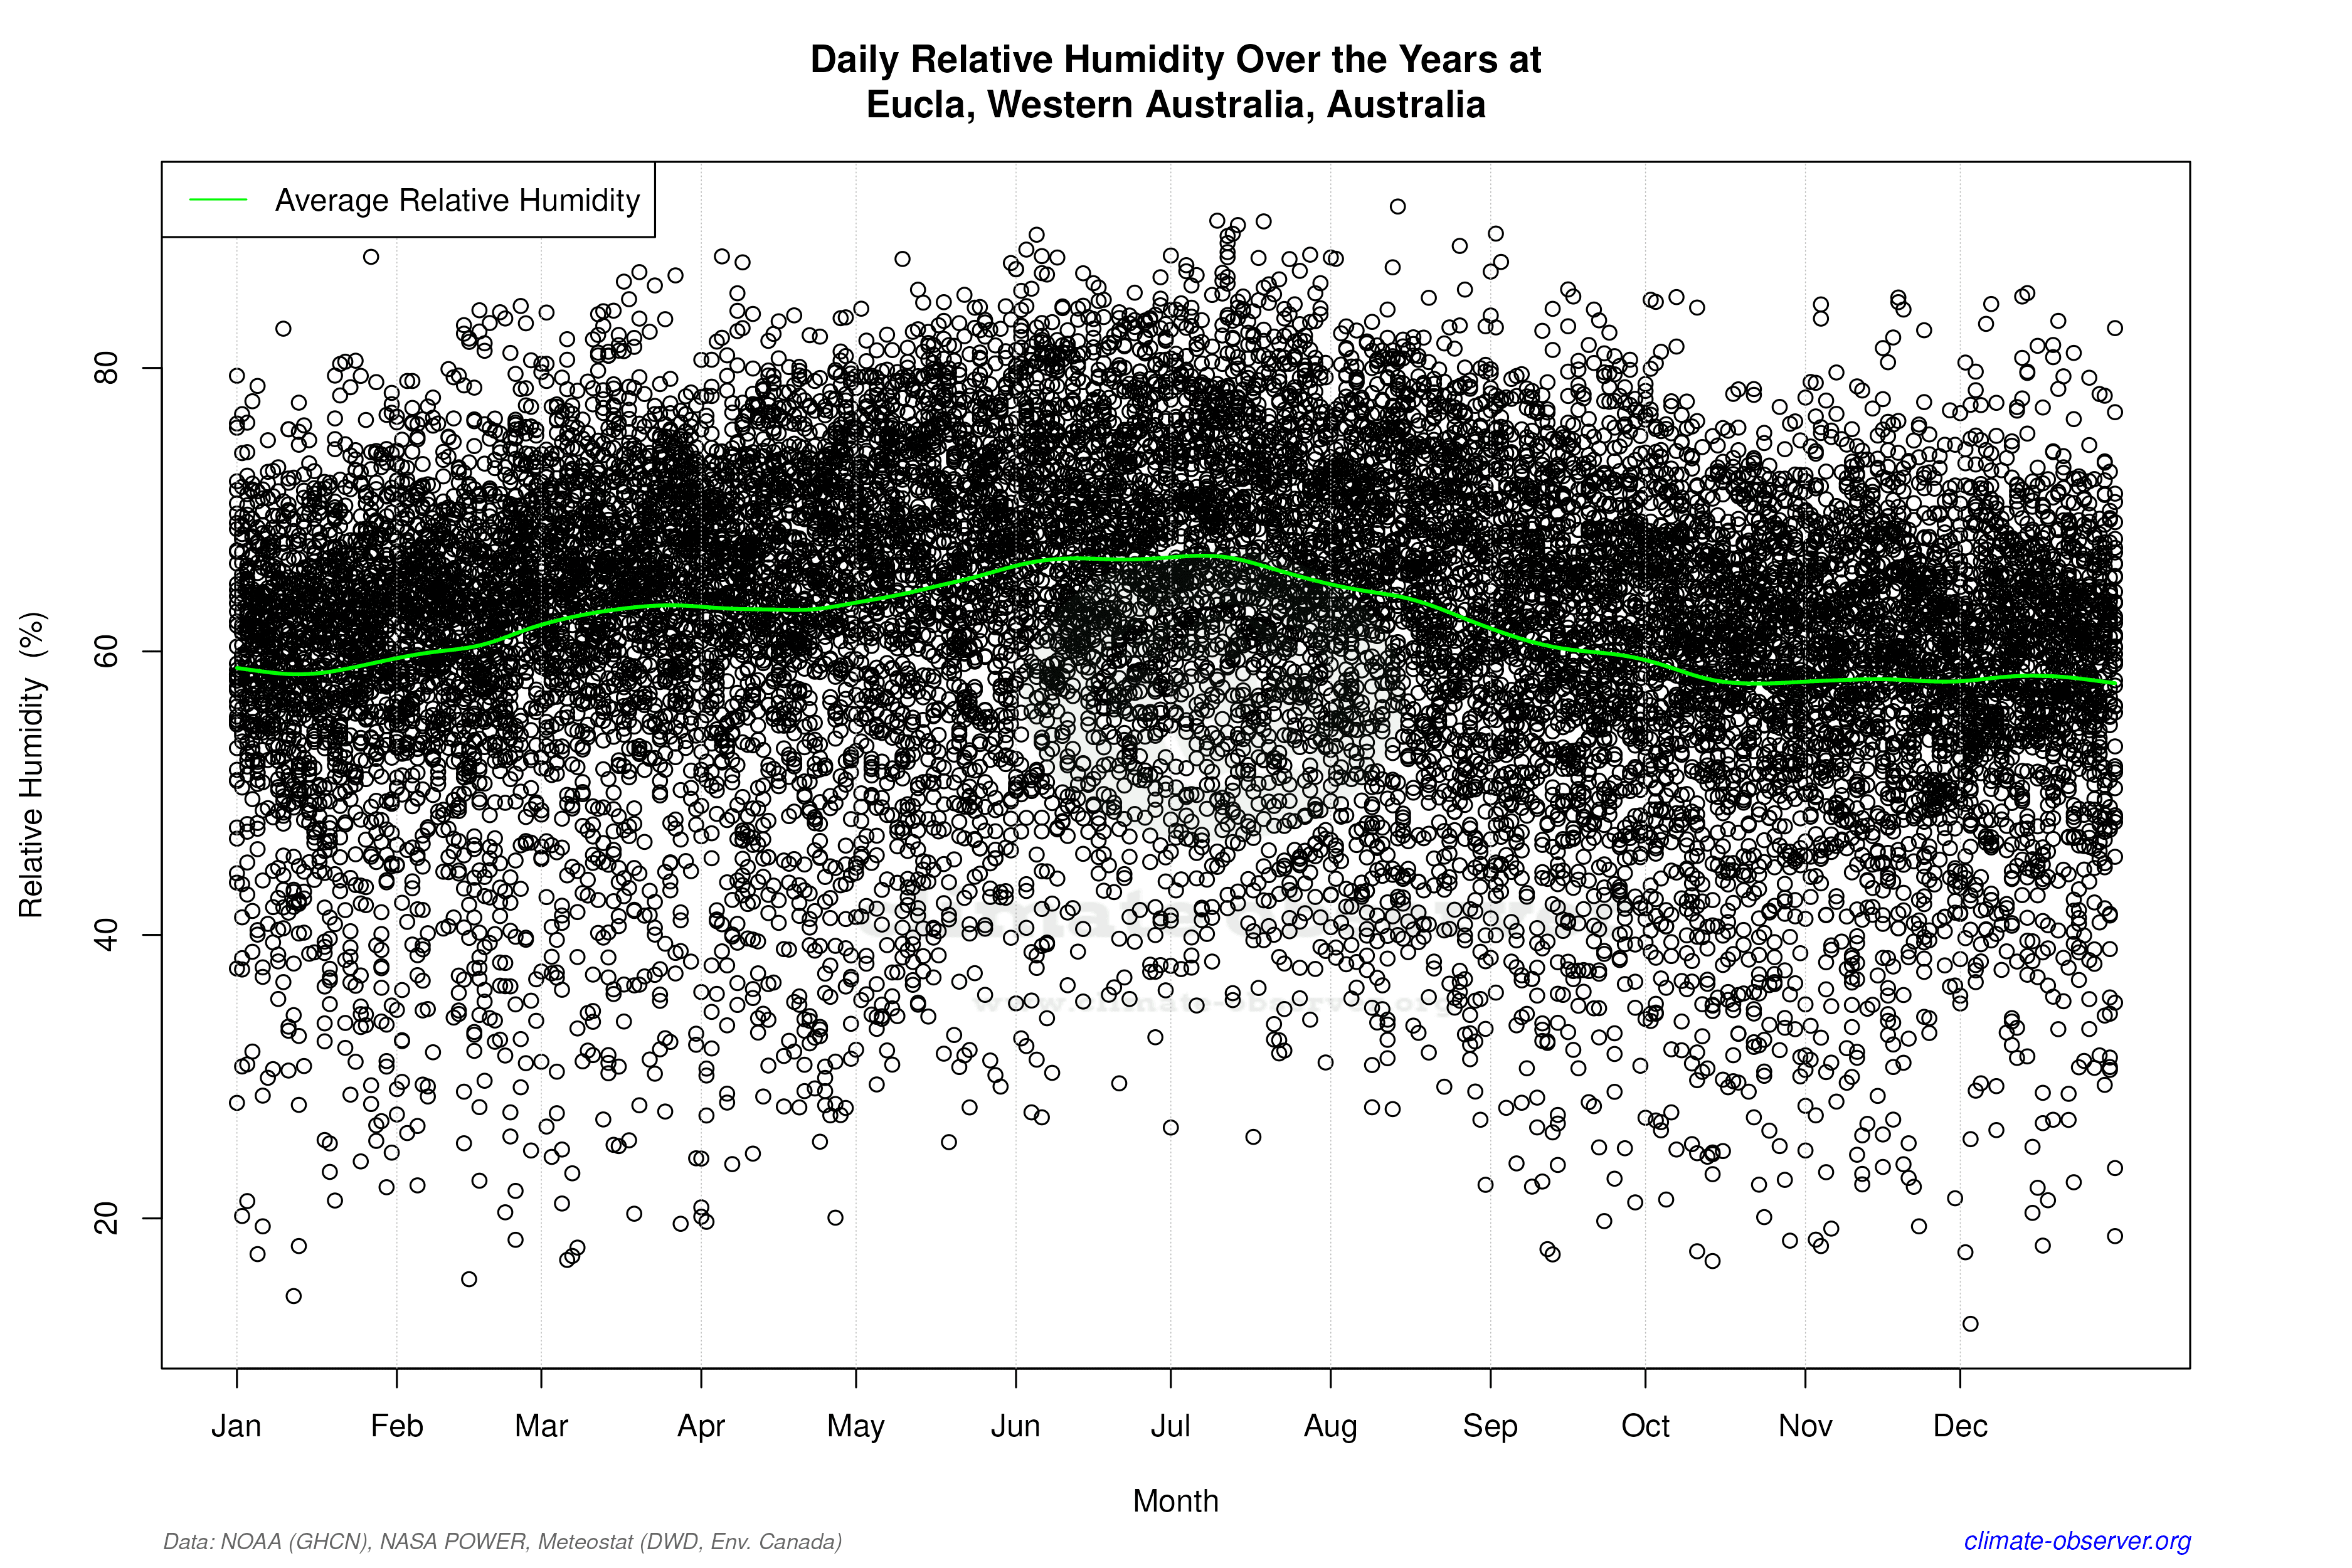

Average Max Temperature Throughout Year | 1 of 5
