Climate for Station: Darwin Airport, Northern Territory, Australia
Loading live weather...
Climate Analysis & Overview
Darwin Airport's climate profile reflects a nuanced interplay of warming and cooling trends, with a significant shift towards more evenly distributed rainfall. While all-time temperature trends indicate a warming pattern, recent decades have shown a cooling in high temperatures, highlighting the complexity of climate dynamics in this tropical region.
Tropical Climate Dynamics
Darwin Airport, located at -12.42° latitude and 130.89° longitude, falls under the tropical savanna climate category (Köppen classification Aw). This region experiences distinct wet and dry seasons, influenced by its proximity to the Timor Sea. The surrounding geography, with its coastal plains and nearby rivers, plays a critical role in modulating local weather patterns. The all-time temperature trends reveal a warming of 0.15°C (0.27°F) for high temperatures and 0.07°C (0.13°F) for low temperatures, indicating an overall rise in temperatures over the long term. This aligns with broader regional climate goals in Australia, which focus on understanding and adapting to warming trends.
Decadal Temperature Shifts
In the past decade, Darwin Airport has experienced a cooling trend in high temperatures, with a decrease of 0.05°C (0.09°F). This contrasts with the warming observed in low temperatures, which have increased by 0.23°C (0.41°F). Such divergent trends highlight the complexity of short-term climatic fluctuations, which may be influenced by localised weather events or broader atmospheric changes. These shifts underscore the necessity for continuous monitoring to understand the underlying drivers of these trends.
Precipitation Patterns and Distribution
The Precipitation Concentration Index (PCI) at Darwin Airport has decreased from a baseline of 20.2 to a current value of 15.6. This significant change suggests that rainfall is now more evenly distributed throughout the year, rather than being concentrated in fewer, more intense events. For a region accustomed to dramatic wet seasons, this shift towards more consistent precipitation could have profound implications for water management and agricultural practices.
Temperature Extremes
Darwin Airport has recorded an all-time maximum temperature of 38.9°C (102.0°F) and a minimum of 10.4°C (50.7°F). These extremes illustrate the potential variability within the tropical climate zone. While these records provide a snapshot of the potential temperature range, the ongoing trends and shifts in precipitation patterns offer a more comprehensive understanding of the region's evolving climate profile.
Implications for Regional Climate Goals
Australia's regional climate goals emphasise the importance of adapting to both warming trends and shifts in precipitation patterns. The data from Darwin Airport, with its nuanced temperature changes and more evenly distributed rainfall, offers critical insights into the challenges and opportunities for climate adaptation in tropical regions. By focusing on these evolving patterns, policymakers and researchers can better strategise for sustainable development and climate resilience in the Northern Territory.
Station Statistics
10-Year Trend
High: -0.04 °F/decade
Low: +0.97 °F/decade
Rain: +0.056 in/decade
25-Year Trend
High: +0.62 °F/decade
Low: +0.64 °F/decade
Rain: +0.003 in/decade
50-Year Trend
High: +0.38 °F/decade
Low: +0.06 °F/decade
Rain: -0.000 in/decade
All-Time Trend
High: +0.27 °F/decade
Low: +0.13 °F/decade
Rain: +0.003 in/decade
Percentage Above-Average Days
Last 12 Months: 46.6%
This Year: 18.9%
Precipitation Concentration Index (PCI) ℹ️
Last 12 Months: 16.7
Historical Average: 21.6
Percentile Rank of Last 12 Months ℹ️
High: 90th percentile
Low: 89th percentile
Rain: 74th percentile
Change in Variance ℹ️
High: +0.1%
Low: -0.4%
Intraday: +19.3%
Data Coverage
88.0%
First Year of Data
1941
Station Location
Historical Weather Records
| Max High | Avg High | Min High | Max Avg | Avg Avg | Min Avg | Max Low | Avg Low | Min Low | Max Precipitation | Avg Precipitation | Max Snow | Avg Snow | |
|---|---|---|---|---|---|---|---|---|---|---|---|---|---|
| Record | 102.02 °F | — | 72.86 °F | 89.47 °F | — | 64.22 °F | 86.36 °F | — | 50.72 °F | 11.43 in | — | — | — |
| January | 96.98 °F | 89.33 °F | 78.26 °F | 88.88 °F | 83.01 °F | 75.92 °F | 85.82 °F | 76.82 °F | 68.36 °F | 11.43 in | 0.55 in | — | — |
| February | 96.80 °F | 88.72 °F | 76.64 °F | 87.98 °F | 82.61 °F | 75.02 °F | 86.00 °F | 76.66 °F | 62.96 °F | 9.85 in | 0.52 in | — | — |
| March | 96.80 °F | 89.58 °F | 78.26 °F | 87.80 °F | 82.61 °F | 76.28 °F | 84.56 °F | 76.37 °F | 66.56 °F | 9.47 in | 0.40 in | — | — |
| April | 98.06 °F | 90.99 °F | 78.44 °F | 86.54 °F | 82.41 °F | 73.58 °F | 82.94 °F | 75.37 °F | 64.40 °F | 5.62 in | 0.13 in | — | — |
| May | 96.80 °F | 89.77 °F | 75.92 °F | 85.46 °F | 80.26 °F | 69.98 °F | 79.88 °F | 71.96 °F | 56.84 °F | 2.30 in | 0.02 in | — | — |
| June | 95.00 °F | 87.38 °F | 72.86 °F | 83.73 °F | 77.31 °F | 64.22 °F | 78.08 °F | 68.02 °F | 53.78 °F | 1.17 in | 0.00 in | — | — |
| July | 95.00 °F | 87.26 °F | 74.12 °F | 85.82 °F | 76.81 °F | 66.38 °F | 79.88 °F | 66.79 °F | 50.72 °F | 0.38 in | 0.00 in | — | — |
| August | 98.24 °F | 88.76 °F | 77.18 °F | 85.01 °F | 78.48 °F | 69.26 °F | 78.08 °F | 68.62 °F | 55.40 °F | 3.15 in | 0.00 in | — | — |
| September | 100.40 °F | 90.91 °F | 80.24 °F | 88.16 °F | 82.17 °F | 72.86 °F | 81.32 °F | 73.48 °F | 57.92 °F | 2.78 in | 0.01 in | — | — |
| October | 102.02 °F | 92.09 °F | 79.59 °F | 89.47 °F | 84.58 °F | 76.19 °F | 84.56 °F | 76.95 °F | 66.20 °F | 3.76 in | 0.08 in | — | — |
| November | 99.14 °F | 92.12 °F | 82.22 °F | 88.88 °F | 84.84 °F | 75.02 °F | 85.46 °F | 77.62 °F | 66.74 °F | 4.13 in | 0.19 in | — | — |
| December | 98.78 °F | 90.96 °F | 77.00 °F | 88.88 °F | 84.07 °F | 75.02 °F | 86.36 °F | 77.65 °F | 67.64 °F | 10.91 in | 0.32 in | — | — |
Data Visualisations
Remove WatermarksCurrent Year Climate Trends vs Historical


Max Temperature this Year | 1 of 6
Climate 12-Month Moving Averages


Max Temperature 12-Month MA | 1 of 6
Daily Data Points and Averages Throughout the Year


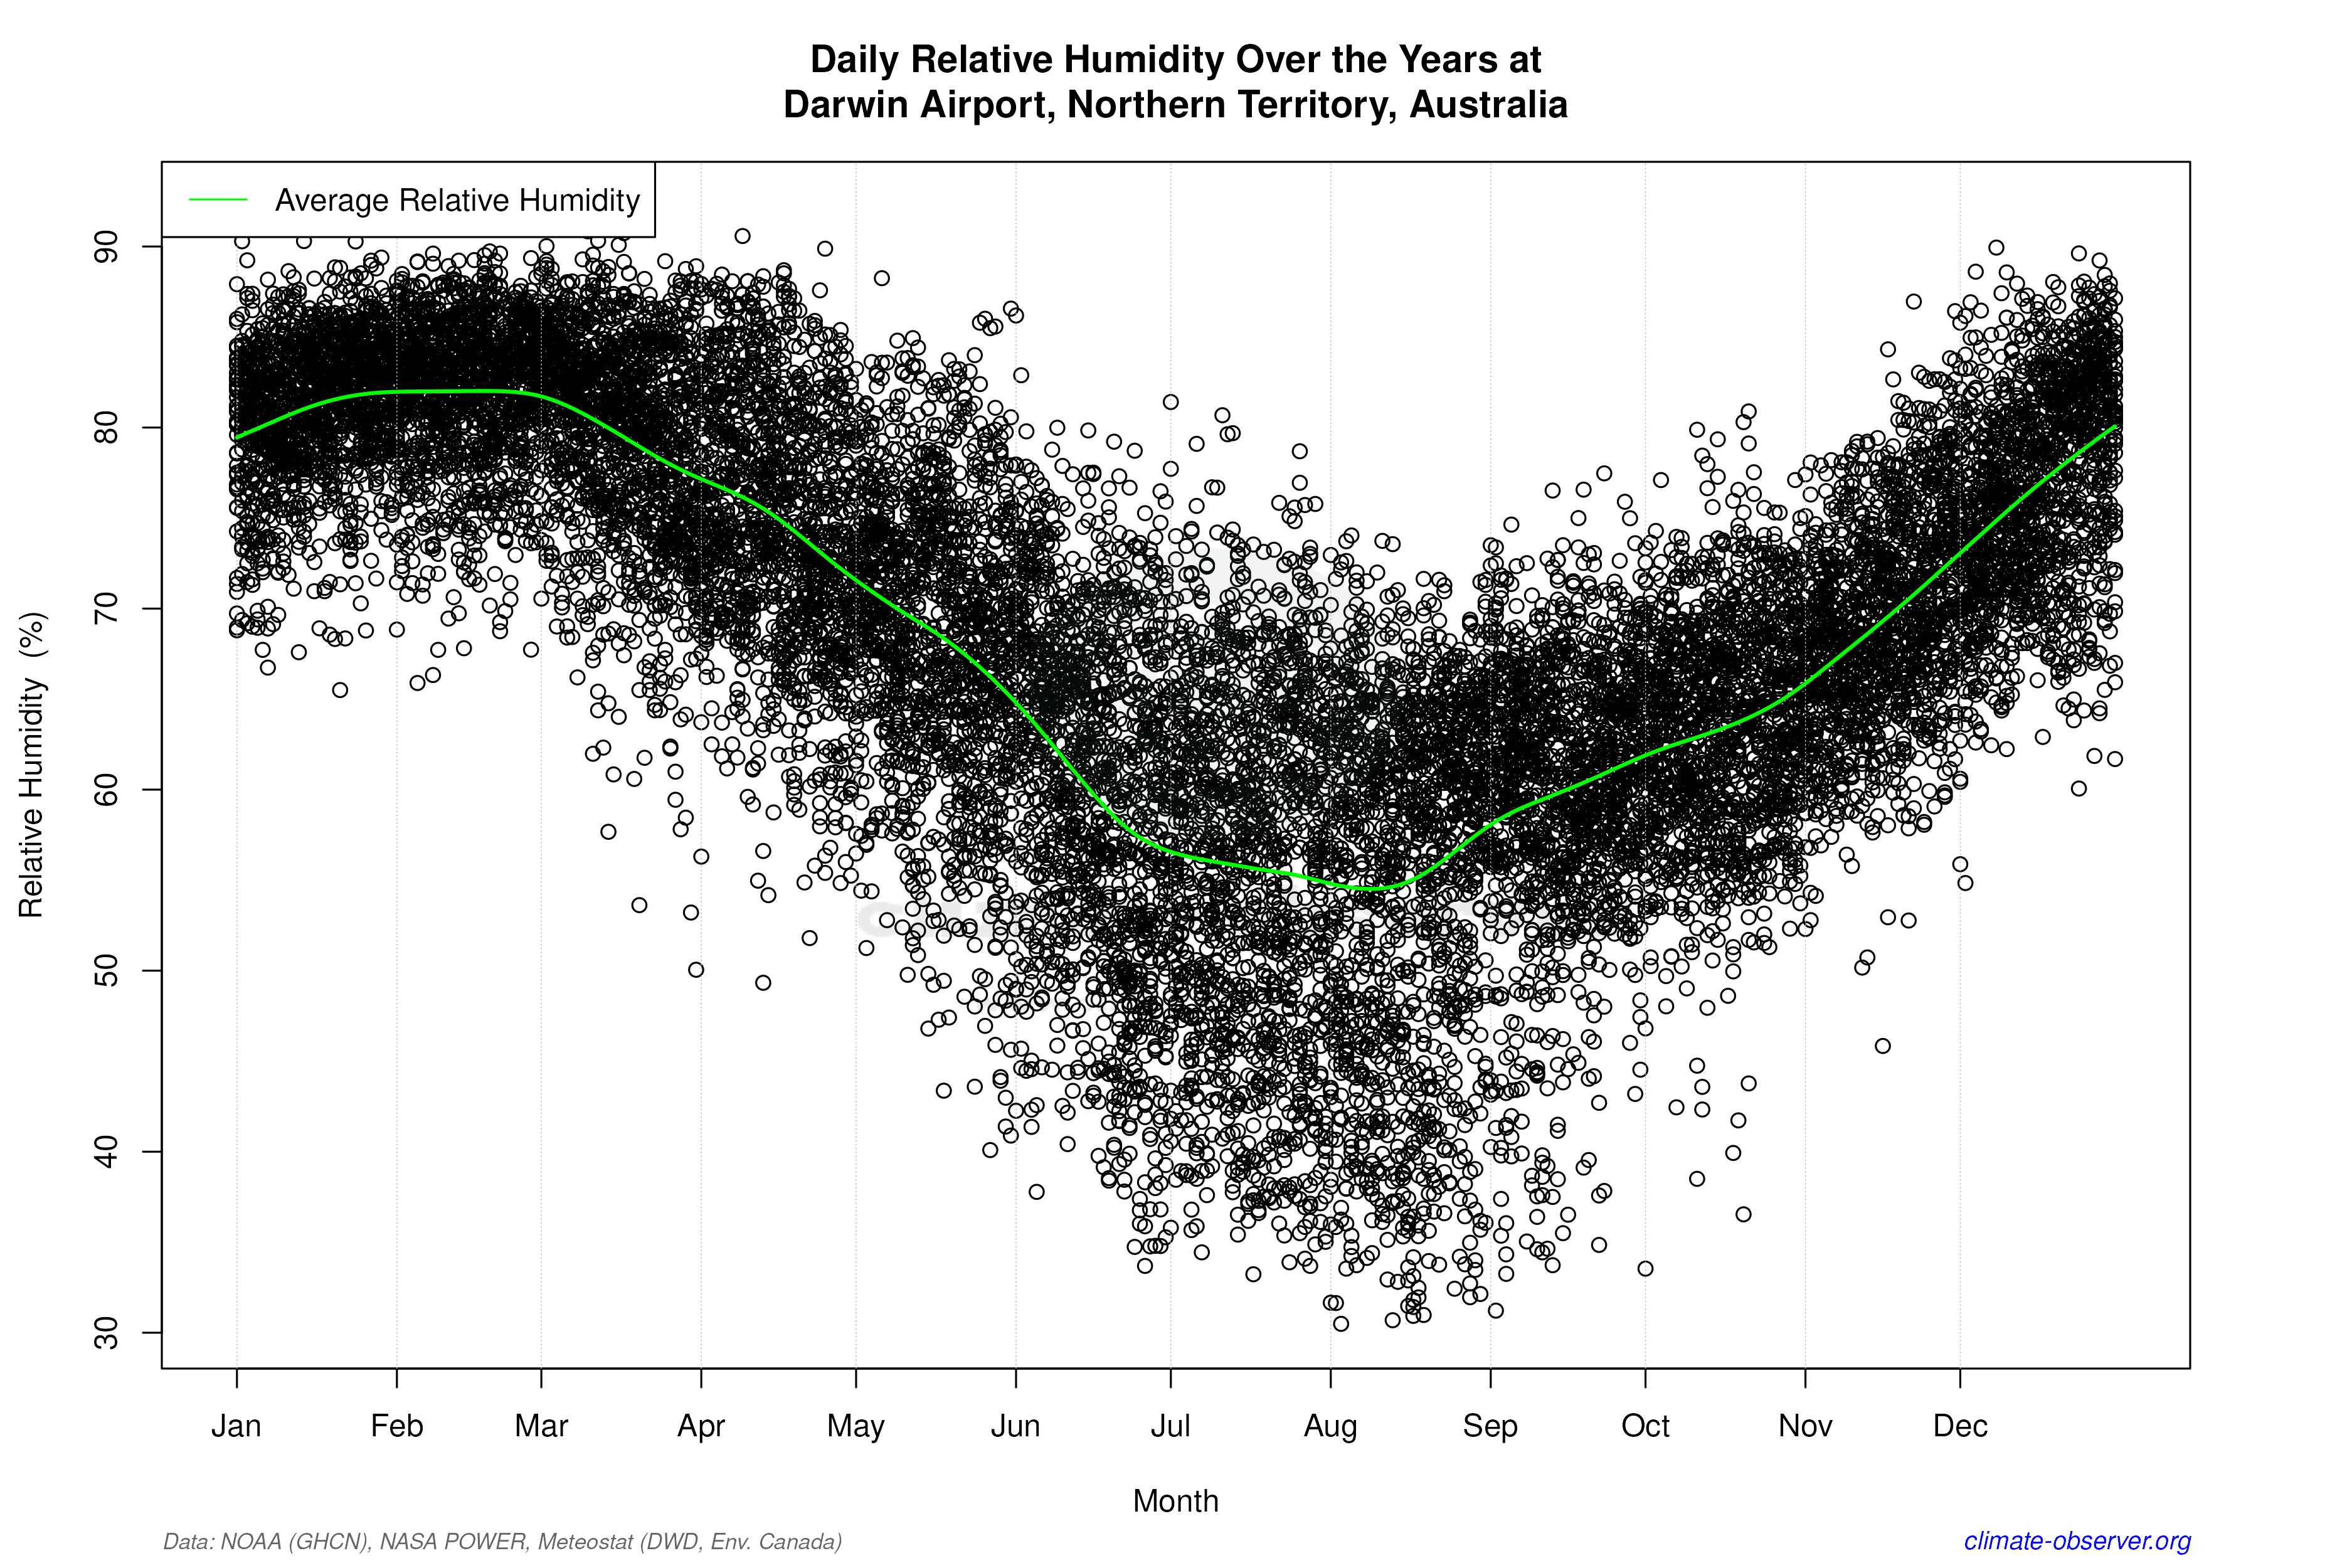

Average Max Temperature Throughout Year | 1 of 5
