Climate for Station: Brisbane Aero, Queensland, Australia
Loading live weather...
Climate Analysis & Overview
Brisbane Aero's climate profile reveals a slight cooling trend in high temperatures over the past decade, contrasting with a long-term warming of low temperatures. Precipitation has become more concentrated, indicating shifts in rainfall patterns. These changes reflect broader regional climate dynamics and underscore the importance of adaptive strategies.
Subtropical Climate Dynamics
Brisbane Aero, located at -27.42° latitude and 153.11° longitude, experiences a humid subtropical climate, classified under the Köppen system as Cfa. This classification is characterised by hot, humid summers and mild winters. The proximity to the coast influences its weather patterns, with sea breezes moderating temperatures and contributing to humidity levels. Over the past decade, the station has recorded a cooling trend in high temperatures, with a decrease of 0.63°C (1.13°F). This is an interesting deviation from the all-time trend, which shows a slight cooling of 0.02°C (0.04°F) in high temperatures. Such variations may be influenced by localised factors, including urbanisation and land-use changes.
Warming Nights: A Persistent Trend
While daytime highs have shown a cooling trend, night-time lows tell a different story. Over the last decade, lows have increased by a modest 0.02°C (0.04°F). More notably, the all-time trend indicates a warming of 0.17°C (0.31°F). This rise in night-time temperatures could be attributed to increased atmospheric moisture and urban heat effects, which trap heat during the night. Such warming can have significant ecological impacts, affecting local flora and fauna adapted to cooler night-time conditions.
Precipitation Patterns: Increasing Concentration
The Precipitation Concentration Index (PCI) is a measure of how rainfall is distributed over time. A higher PCI indicates that precipitation is concentrated in fewer, more intense events. Brisbane Aero's PCI has increased from a baseline of 13.96 to a current value of 15.34, suggesting a shift towards more concentrated rainfall events. This change implies that while the total annual rainfall may not have significantly altered, the distribution has, leading to potential challenges in water management and flood risk.
Temperature Extremes: Record Observations
Brisbane Aero has recorded temperature extremes with a maximum of 39.02°C (102.24°F) and a minimum of -2.5°C (27.5°F). These records highlight the range of temperatures experienced in the region, influenced by both subtropical and occasional temperate weather systems. Such extremes can have implications for infrastructure resilience and energy demand, particularly during peak temperature events.
Regional Climate Implications
The observed climatic trends at Brisbane Aero are reflective of broader patterns across Queensland and Australia. As the nation strives to meet its climate goals, including reducing greenhouse gas emissions and enhancing resilience to climate impacts, understanding localised trends becomes crucial. Recent weather events, such as intense rainfall and heatwaves, underscore the need for adaptive strategies to mitigate the impacts of climate variability and change.
Station Statistics
10-Year Trend
High: -1.35 °F/decade
Low: -0.09 °F/decade
Rain: +0.056 in/decade
25-Year Trend
High: -0.13 °F/decade
Low: +0.88 °F/decade
Rain: +0.013 in/decade
50-Year Trend
High: -0.06 °F/decade
Low: +0.08 °F/decade
Rain: -0.001 in/decade
All-Time Trend
High: -0.04 °F/decade
Low: +0.29 °F/decade
Rain: +0.001 in/decade
Percentage Above-Average Days
Last 12 Months: 53.0%
This Year: 31.5%
Precipitation Concentration Index (PCI) ℹ️
Last 12 Months: 12.7
Historical Average: 14.6
Percentile Rank of Last 12 Months ℹ️
High: 46th percentile
Low: 97th percentile
Rain: 82nd percentile
Change in Variance ℹ️
High: -15.6%
Low: -3.8%
Intraday: -13.9%
Data Coverage
68.3%
First Year of Data
1899
Station Location
Historical Weather Records
| Max High | Avg High | Min High | Max Avg | Avg Avg | Min Avg | Max Low | Avg Low | Min Low | Max Precipitation | Avg Precipitation | Max Snow | Avg Snow | |
|---|---|---|---|---|---|---|---|---|---|---|---|---|---|
| Record | 102.24 °F | — | 53.42 °F | 87.26 °F | — | 45.68 °F | 81.14 °F | — | 27.50 °F | 12.10 in | — | — | — |
| January | 100.94 °F | 84.51 °F | 68.72 °F | 86.90 °F | 76.92 °F | 66.02 °F | 81.14 °F | 69.76 °F | 56.84 °F | 12.10 in | 0.18 in | — | — |
| February | 102.24 °F | 84.00 °F | 69.80 °F | 87.26 °F | 76.43 °F | 66.56 °F | 80.60 °F | 69.46 °F | 57.56 °F | 8.28 in | 0.21 in | — | — |
| March | 98.06 °F | 82.46 °F | 67.64 °F | 83.66 °F | 74.35 °F | 64.22 °F | 80.24 °F | 67.08 °F | 51.08 °F | 8.84 in | 0.17 in | — | — |
| April | 93.74 °F | 79.06 °F | 62.78 °F | 81.50 °F | 70.03 °F | 58.46 °F | 73.40 °F | 61.71 °F | 42.08 °F | 6.20 in | 0.10 in | — | — |
| May | 87.80 °F | 74.25 °F | 59.00 °F | 73.94 °F | 64.53 °F | 52.16 °F | 70.52 °F | 55.74 °F | 35.06 °F | 5.78 in | 0.10 in | — | — |
| June | 84.38 °F | 70.22 °F | 55.40 °F | 73.94 °F | 60.02 °F | 46.58 °F | 66.38 °F | 51.05 °F | 31.46 °F | 11.61 in | 0.08 in | — | — |
| July | 85.28 °F | 69.39 °F | 53.42 °F | 72.32 °F | 58.57 °F | 45.68 °F | 65.84 °F | 48.37 °F | 27.50 °F | 8.57 in | 0.06 in | — | — |
| August | 88.52 °F | 71.51 °F | 54.14 °F | 73.40 °F | 60.33 °F | 48.38 °F | 66.20 °F | 49.49 °F | 28.76 °F | 2.65 in | 0.04 in | — | — |
| September | 94.82 °F | 75.18 °F | 59.90 °F | 77.18 °F | 64.95 °F | 53.06 °F | 69.80 °F | 54.24 °F | 31.28 °F | 2.28 in | 0.05 in | — | — |
| October | 98.06 °F | 78.24 °F | 62.06 °F | 84.74 °F | 69.19 °F | 58.64 °F | 73.22 °F | 59.84 °F | 39.56 °F | 5.20 in | 0.10 in | — | — |
| November | 101.30 °F | 81.09 °F | 67.50 °F | 85.64 °F | 72.61 °F | 61.70 °F | 75.74 °F | 64.35 °F | 46.22 °F | 6.57 in | 0.12 in | — | — |
| December | 102.02 °F | 83.41 °F | 63.86 °F | 86.54 °F | 75.38 °F | 62.60 °F | 78.80 °F | 67.61 °F | 49.64 °F | 6.01 in | 0.16 in | — | — |
Data Visualisations
Remove WatermarksCurrent Year Climate Trends vs Historical


Max Temperature this Year | 1 of 6
Climate 12-Month Moving Averages


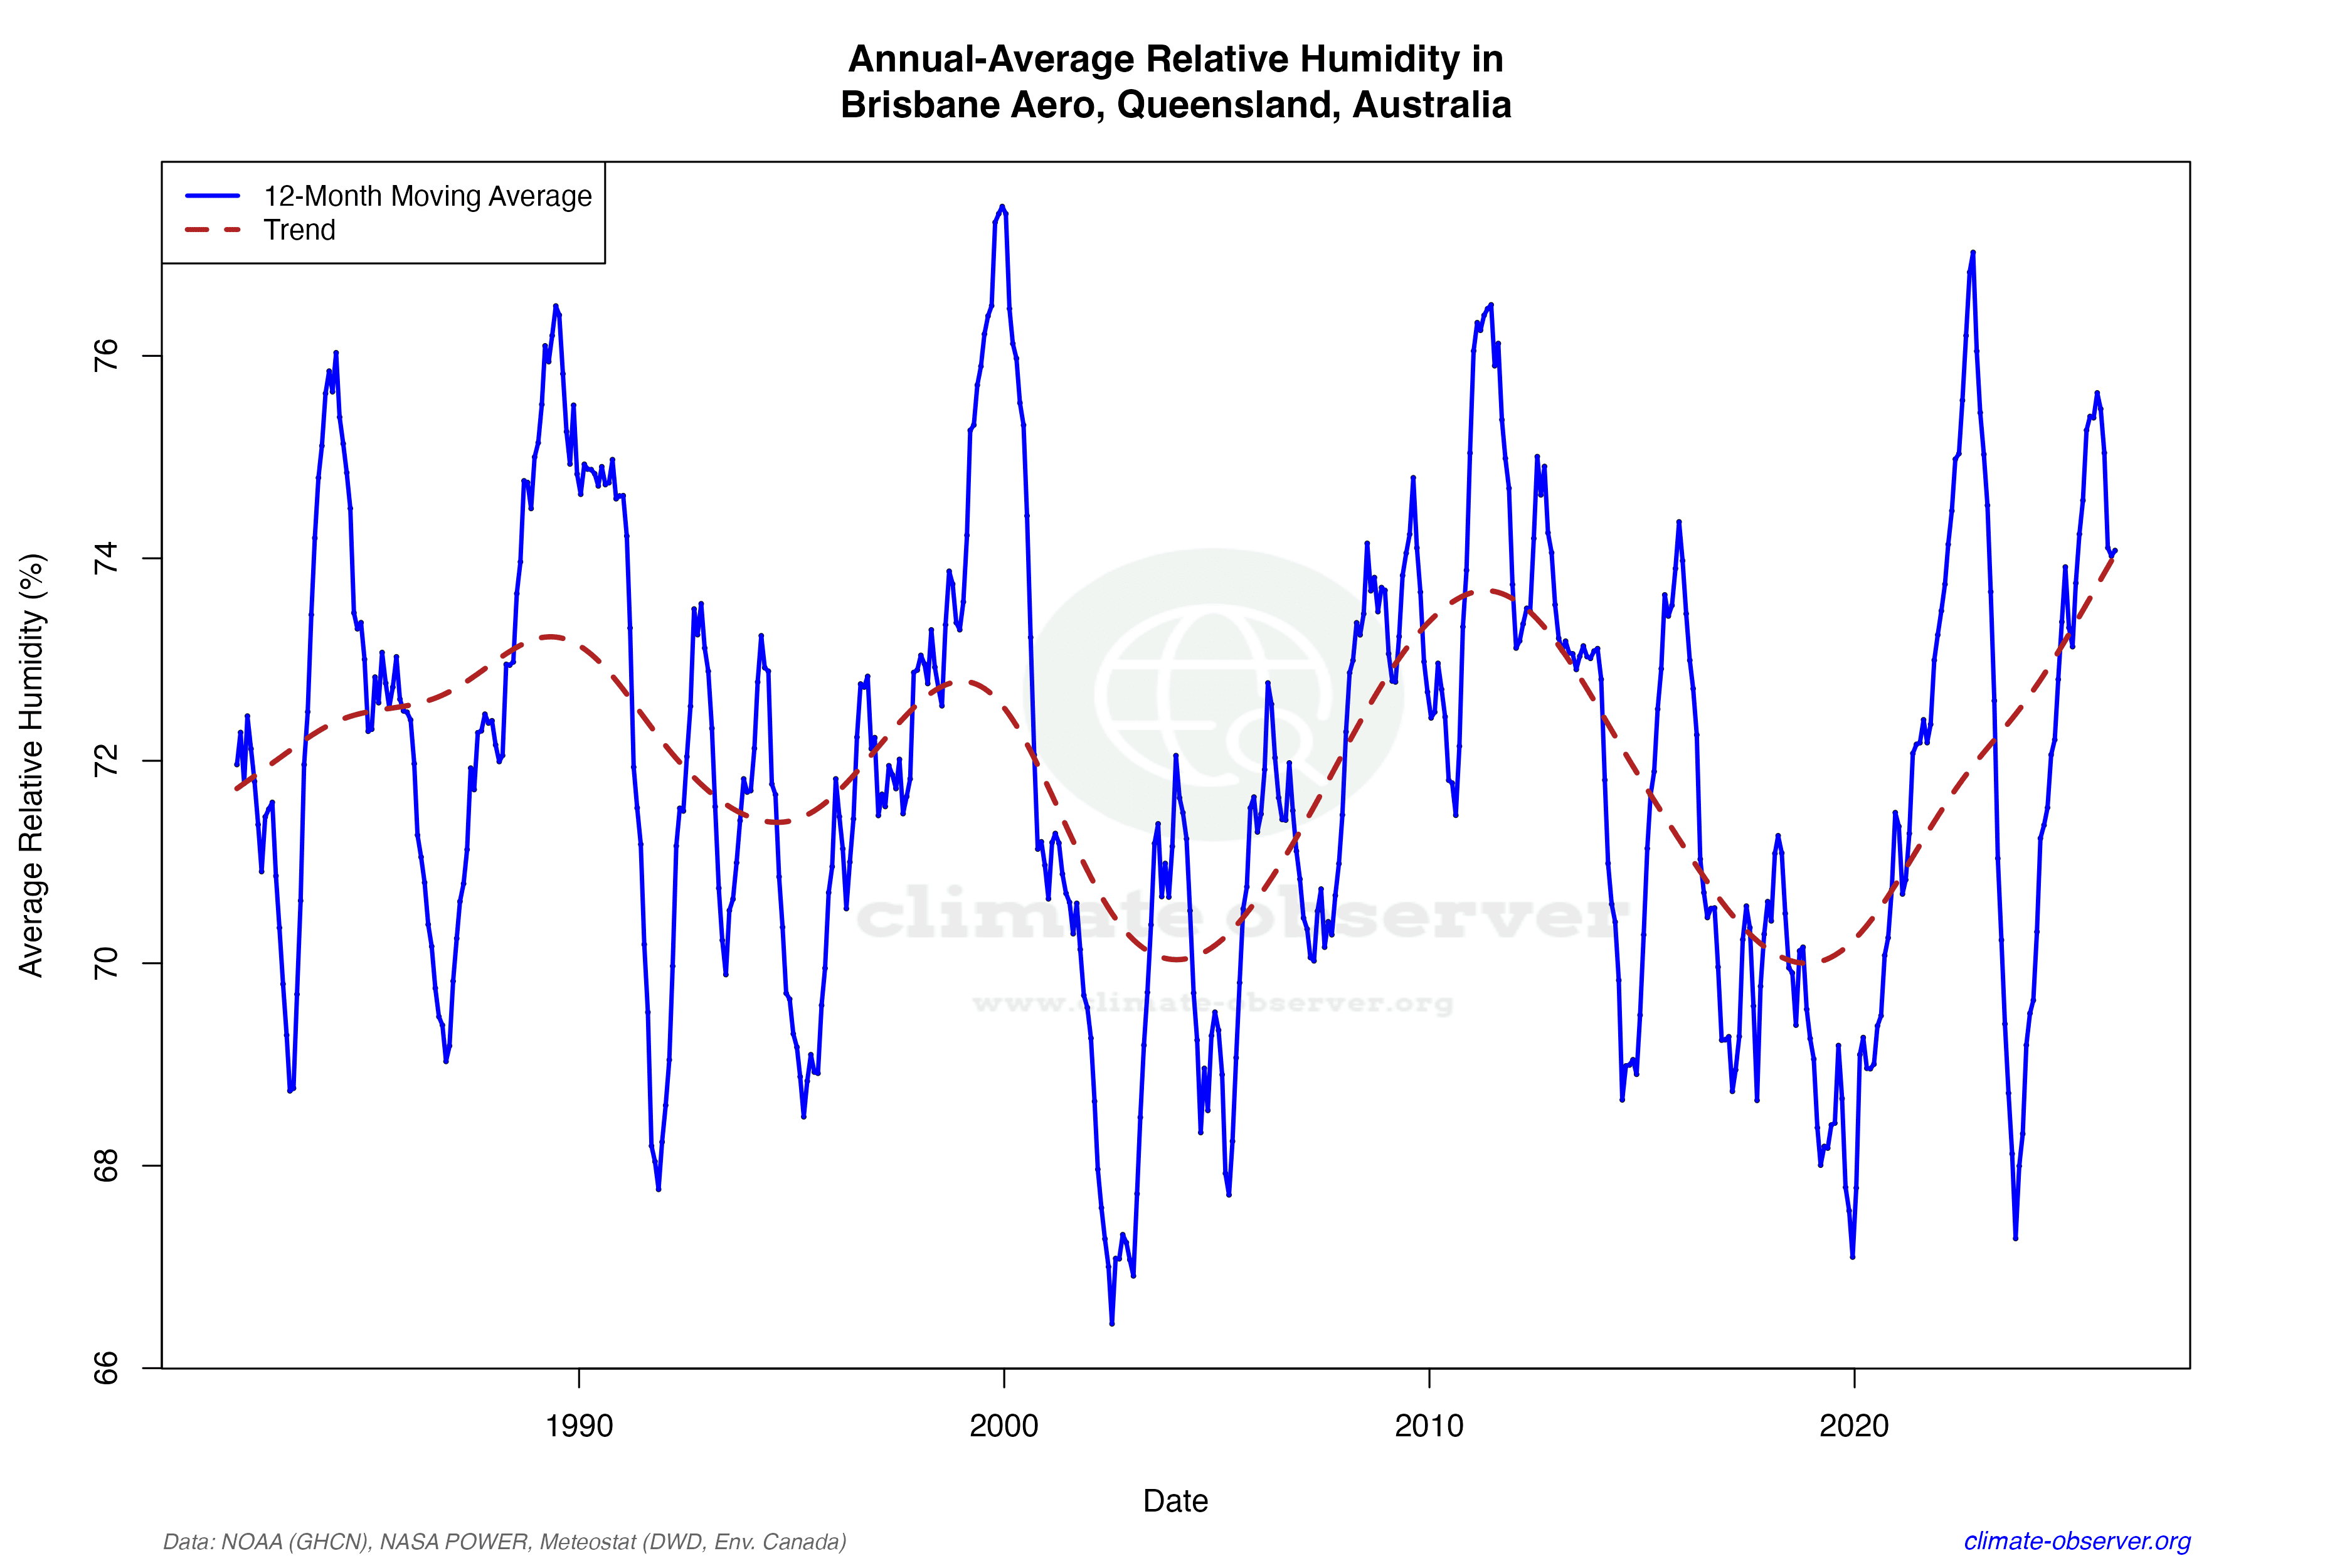

Max Temperature 12-Month MA | 1 of 6
Daily Data Points and Averages Throughout the Year


Average Max Temperature Throughout Year | 1 of 5
