Climate for Station: Sydney Airport Amo, New South Wales, Australia
Loading live weather...
Climate Analysis & Overview
Sydney Airport Amo experiences a complex climate narrative. While all-time trends show a slight warming, recent decades indicate a cooling trend, suggesting a nuanced climatic shift. Precipitation patterns have become more evenly distributed, reflecting broader regional climate dynamics.
Climatic Context and Geography
Sydney Airport Amo is situated at -33.95° S, 151.17° E, nestled within the urban sprawl of Sydney, New South Wales. The region is classified under the Köppen climate classification as Cfa, indicating a humid subtropical climate. This classification is characterized by warm summers and mild winters, influenced by its proximity to the Pacific Ocean. The coastal location moderates temperature extremes, which is evident in the station's all-time records, with a maximum temperature of 46.4°C (115.5°F) and a minimum of -0.1°C (31.8°F). The oceanic influence also contributes to the distribution of precipitation, a critical factor in understanding local climate trends.
Thermal Trends: A Tale of Two Timeframes
The temperature trends at Sydney Airport Amo reveal an intriguing dichotomy. Over the past decade, there has been a cooling trend with high temperatures decreasing by 0.76°C (1.37°F) and low temperatures by 0.17°C (0.31°F). This recent cooling contrasts with the all-time data, which indicates a warming trend with highs rising by 0.15°C (0.27°F) and lows by 0.06°C (0.11°F). This divergence suggests that while long-term climatic forces may be driving a gradual warming, shorter-term variability is introducing cooling patterns, possibly influenced by regional climatic phenomena or urban development.
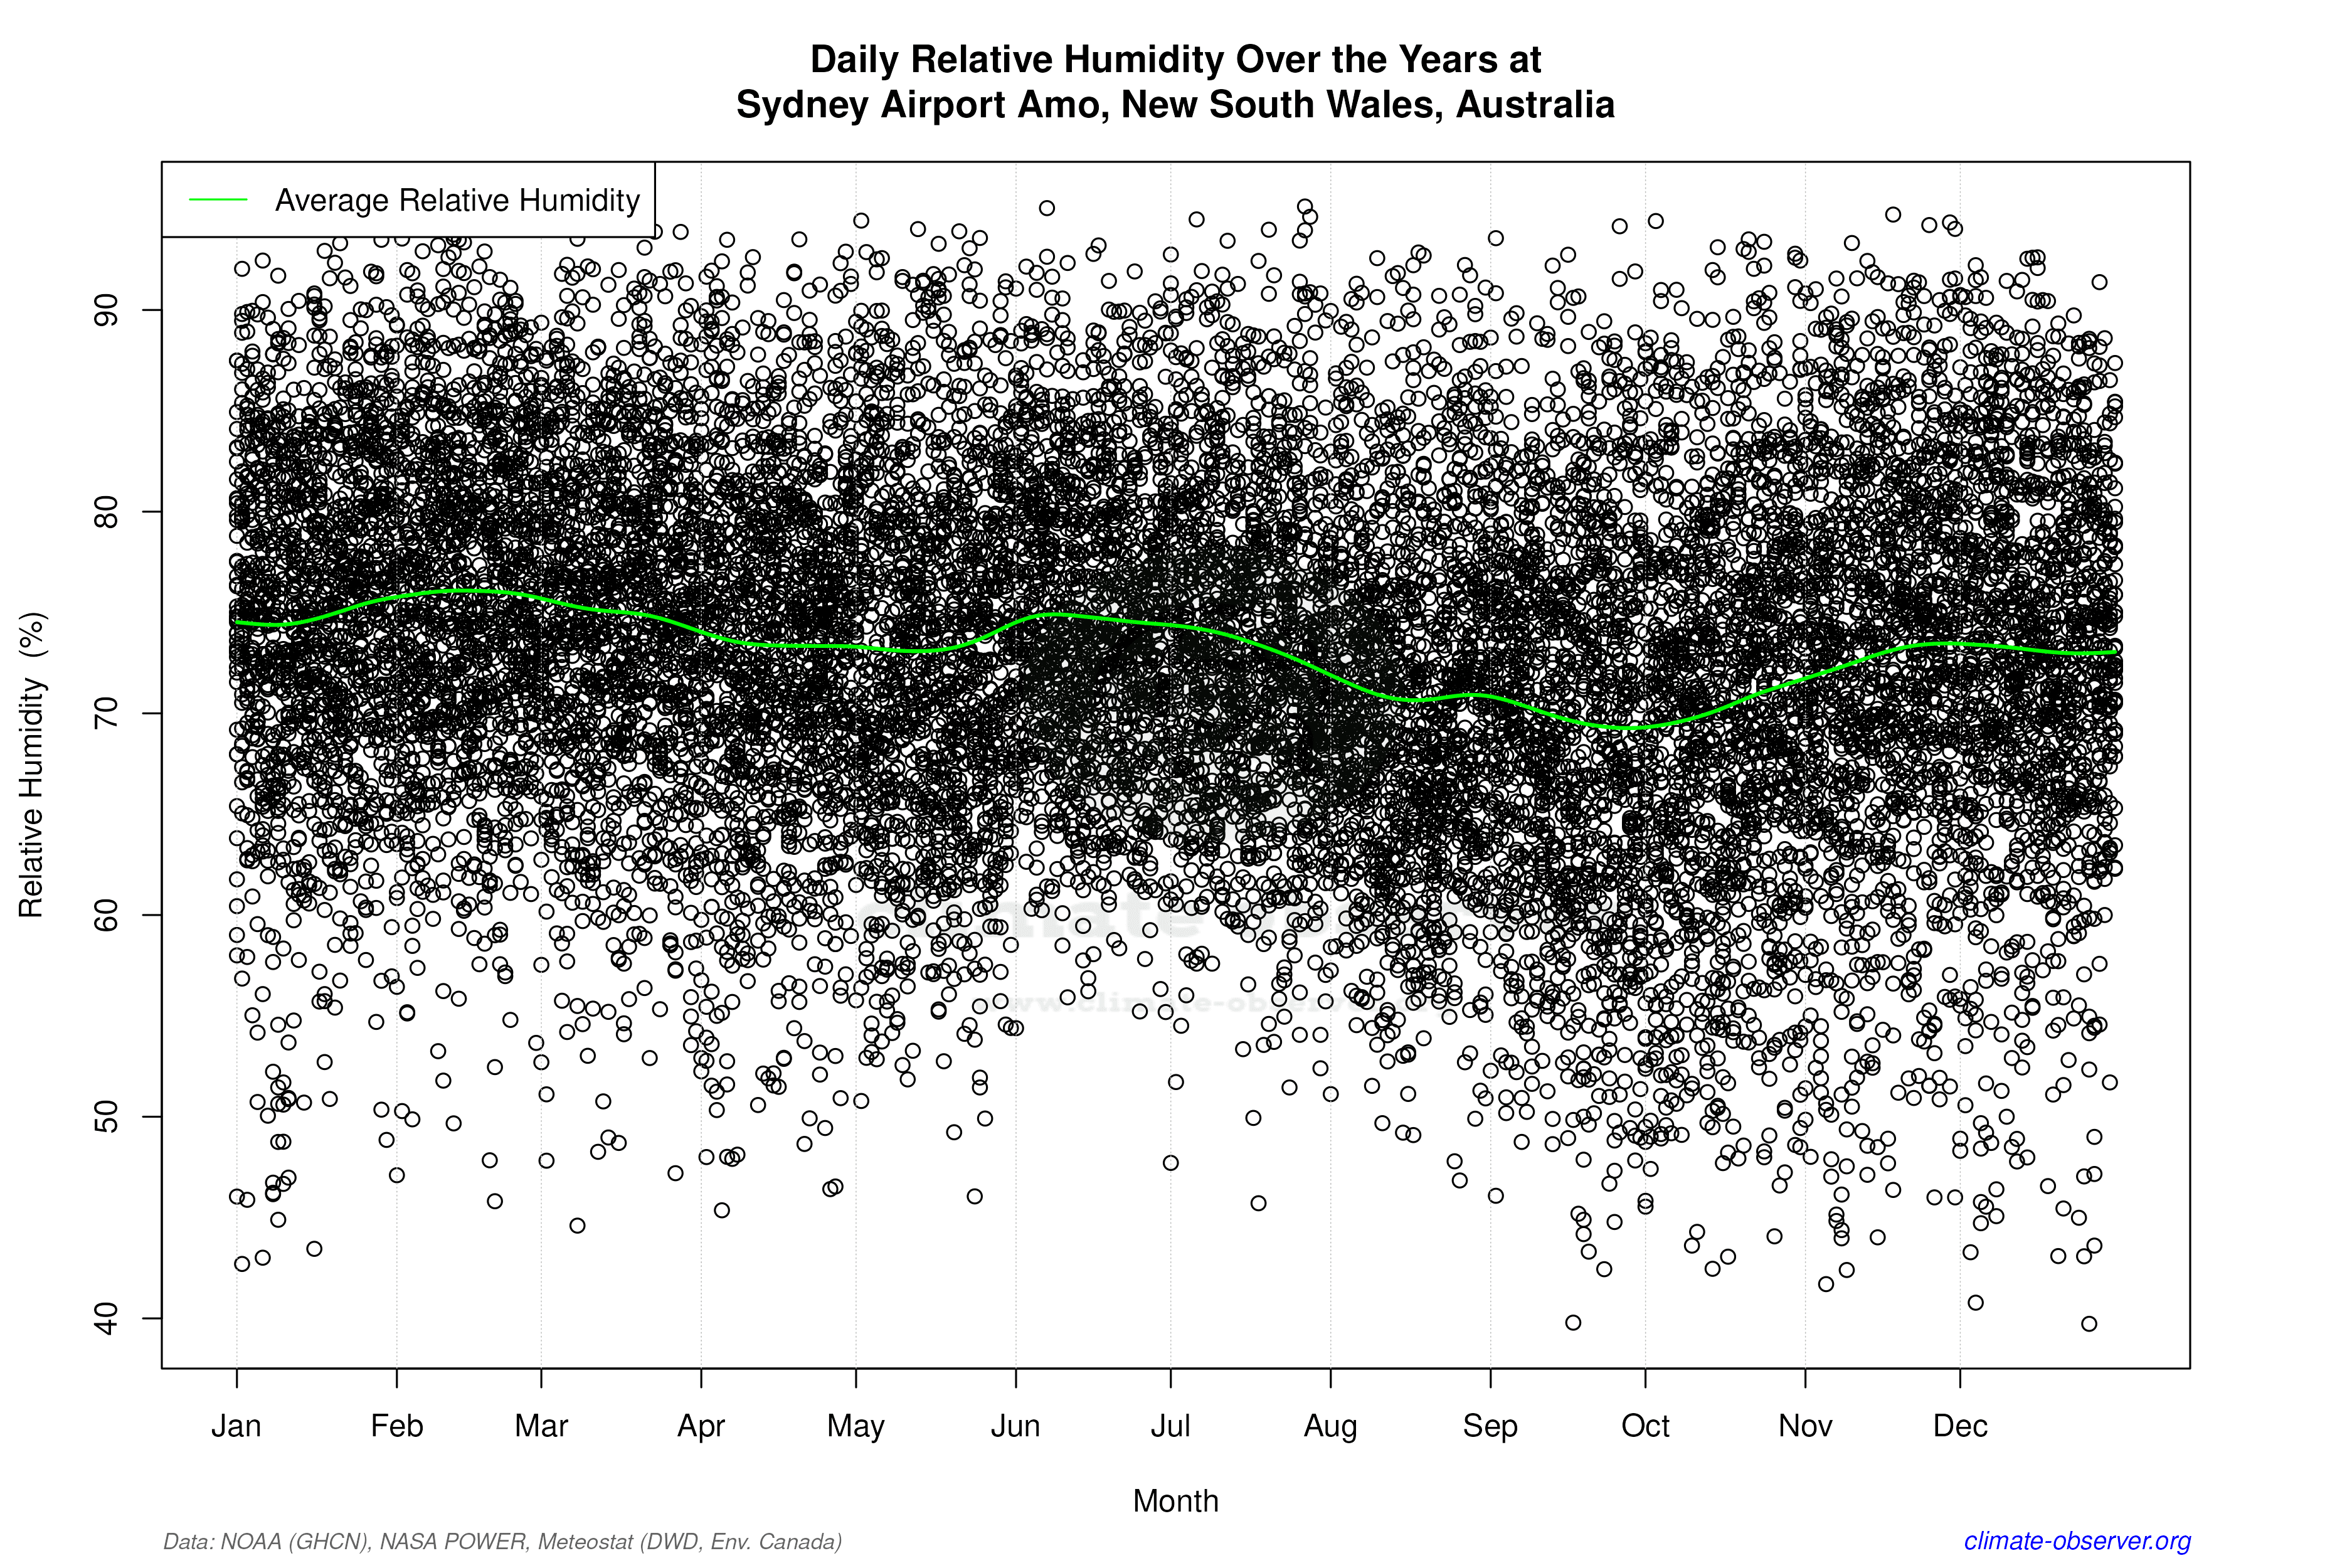
Precipitation Patterns: Towards Even Distribution
The Precipitation Concentration Index (PCI) at Sydney Airport Amo has shown a decrease from a baseline of 14.4 to a current value of 11.3. This reduction indicates that precipitation has become more evenly distributed over time, moving away from concentrated heavy rainfall events. A PCI below 10 is considered very even, so the current value suggests a moderate shift towards more consistent rainfall throughout the year. This change aligns with broader regional efforts to adapt to climate variability, ensuring water resources are managed sustainably.
Regional Climate Dynamics and Implications
Australia's commitment to addressing climate change is reflected in its National Climate Resilience and Adaptation Strategy, which aims to enhance the resilience of communities and ecosystems. The trends observed at Sydney Airport Amo underscore the importance of understanding local climate dynamics as part of this national strategy. The cooling trend in recent years, juxtaposed with an all-time warming trend, highlights the complexity of climate systems and the need for adaptive management. As Sydney continues to grow, integrating climate data into urban planning will be crucial to mitigate potential impacts on infrastructure and society.
Station Statistics
10-Year Trend
High: -2.37 °F/decade
Low: -1.17 °F/decade
Rain: +0.044 in/decade
25-Year Trend
High: +0.81 °F/decade
Low: +0.51 °F/decade
Rain: +0.017 in/decade
50-Year Trend
High: +0.61 °F/decade
Low: +0.70 °F/decade
Rain: +0.000 in/decade
All-Time Trend
High: +0.25 °F/decade
Low: +0.10 °F/decade
Rain: -0.001 in/decade
Percentage Above-Average Days
Last 12 Months: 59.5%
This Year: 63.5%
Precipitation Concentration Index (PCI) ℹ️
Last 12 Months: 16.4
Historical Average: 14.0
Percentile Rank of Last 12 Months ℹ️
High: 80th percentile
Low: 80th percentile
Rain: 78th percentile
Change in Variance ℹ️
High: +10.2%
Low: -4.0%
Intraday: +5.7%
Data Coverage
85.7%
First Year of Data
1858
Station Location
Historical Weather Records
| Max High | Avg High | Min High | Max Avg | Avg Avg | Min Avg | Max Low | Avg Low | Min Low | Max Precipitation | Avg Precipitation | Max Snow | Avg Snow | |
|---|---|---|---|---|---|---|---|---|---|---|---|---|---|
| Record | 115.52 °F | — | 45.86 °F | 92.84 °F | — | 43.16 °F | 79.34 °F | — | 31.82 °F | 8.18 in | — | — | — |
| January | 115.52 °F | 79.28 °F | 63.86 °F | 92.12 °F | 72.89 °F | 60.08 °F | 78.26 °F | 65.56 °F | 49.46 °F | 6.18 in | 0.11 in | — | — |
| February | 109.22 °F | 78.81 °F | 60.08 °F | 92.84 °F | 72.76 °F | 59.36 °F | 78.26 °F | 65.78 °F | 49.28 °F | 8.18 in | 0.15 in | — | — |
| March | 106.16 °F | 76.83 °F | 61.16 °F | 85.64 °F | 70.70 °F | 58.10 °F | 77.72 °F | 63.44 °F | 45.32 °F | 7.95 in | 0.15 in | — | — |
| April | 98.24 °F | 72.49 °F | 56.84 °F | 84.02 °F | 65.82 °F | 51.44 °F | 73.58 °F | 57.95 °F | 42.98 °F | 4.41 in | 0.15 in | — | — |
| May | 86.00 °F | 67.05 °F | 52.34 °F | 73.76 °F | 60.11 °F | 48.20 °F | 67.64 °F | 52.11 °F | 37.40 °F | 6.53 in | 0.14 in | — | — |
| June | 80.42 °F | 62.60 °F | 49.46 °F | 67.64 °F | 55.77 °F | 45.68 °F | 65.12 °F | 47.96 °F | 33.80 °F | 4.75 in | 0.16 in | — | — |
| July | 80.60 °F | 61.53 °F | 45.86 °F | 68.54 °F | 54.25 °F | 43.16 °F | 62.60 °F | 45.61 °F | 31.82 °F | 5.22 in | 0.11 in | — | — |
| August | 88.88 °F | 64.19 °F | 48.38 °F | 74.30 °F | 56.38 °F | 45.86 °F | 68.36 °F | 47.26 °F | 34.16 °F | 6.44 in | 0.09 in | — | — |
| September | 96.62 °F | 68.30 °F | 49.10 °F | 82.40 °F | 60.74 °F | 48.92 °F | 71.24 °F | 51.25 °F | 36.14 °F | 2.83 in | 0.08 in | — | — |
| October | 102.38 °F | 72.22 °F | 53.78 °F | 84.92 °F | 64.73 °F | 50.72 °F | 73.76 °F | 55.96 °F | 40.64 °F | 4.42 in | 0.08 in | — | — |
| November | 110.12 °F | 75.03 °F | 56.66 °F | 87.08 °F | 67.66 °F | 54.32 °F | 76.28 °F | 59.83 °F | 42.62 °F | 5.64 in | 0.09 in | — | — |
| December | 110.30 °F | 77.99 °F | 59.36 °F | 88.88 °F | 70.90 °F | 58.10 °F | 79.34 °F | 63.33 °F | 46.76 °F | 7.17 in | 0.09 in | — | — |
Data Visualisations
Remove WatermarksCurrent Year Climate Trends vs Historical


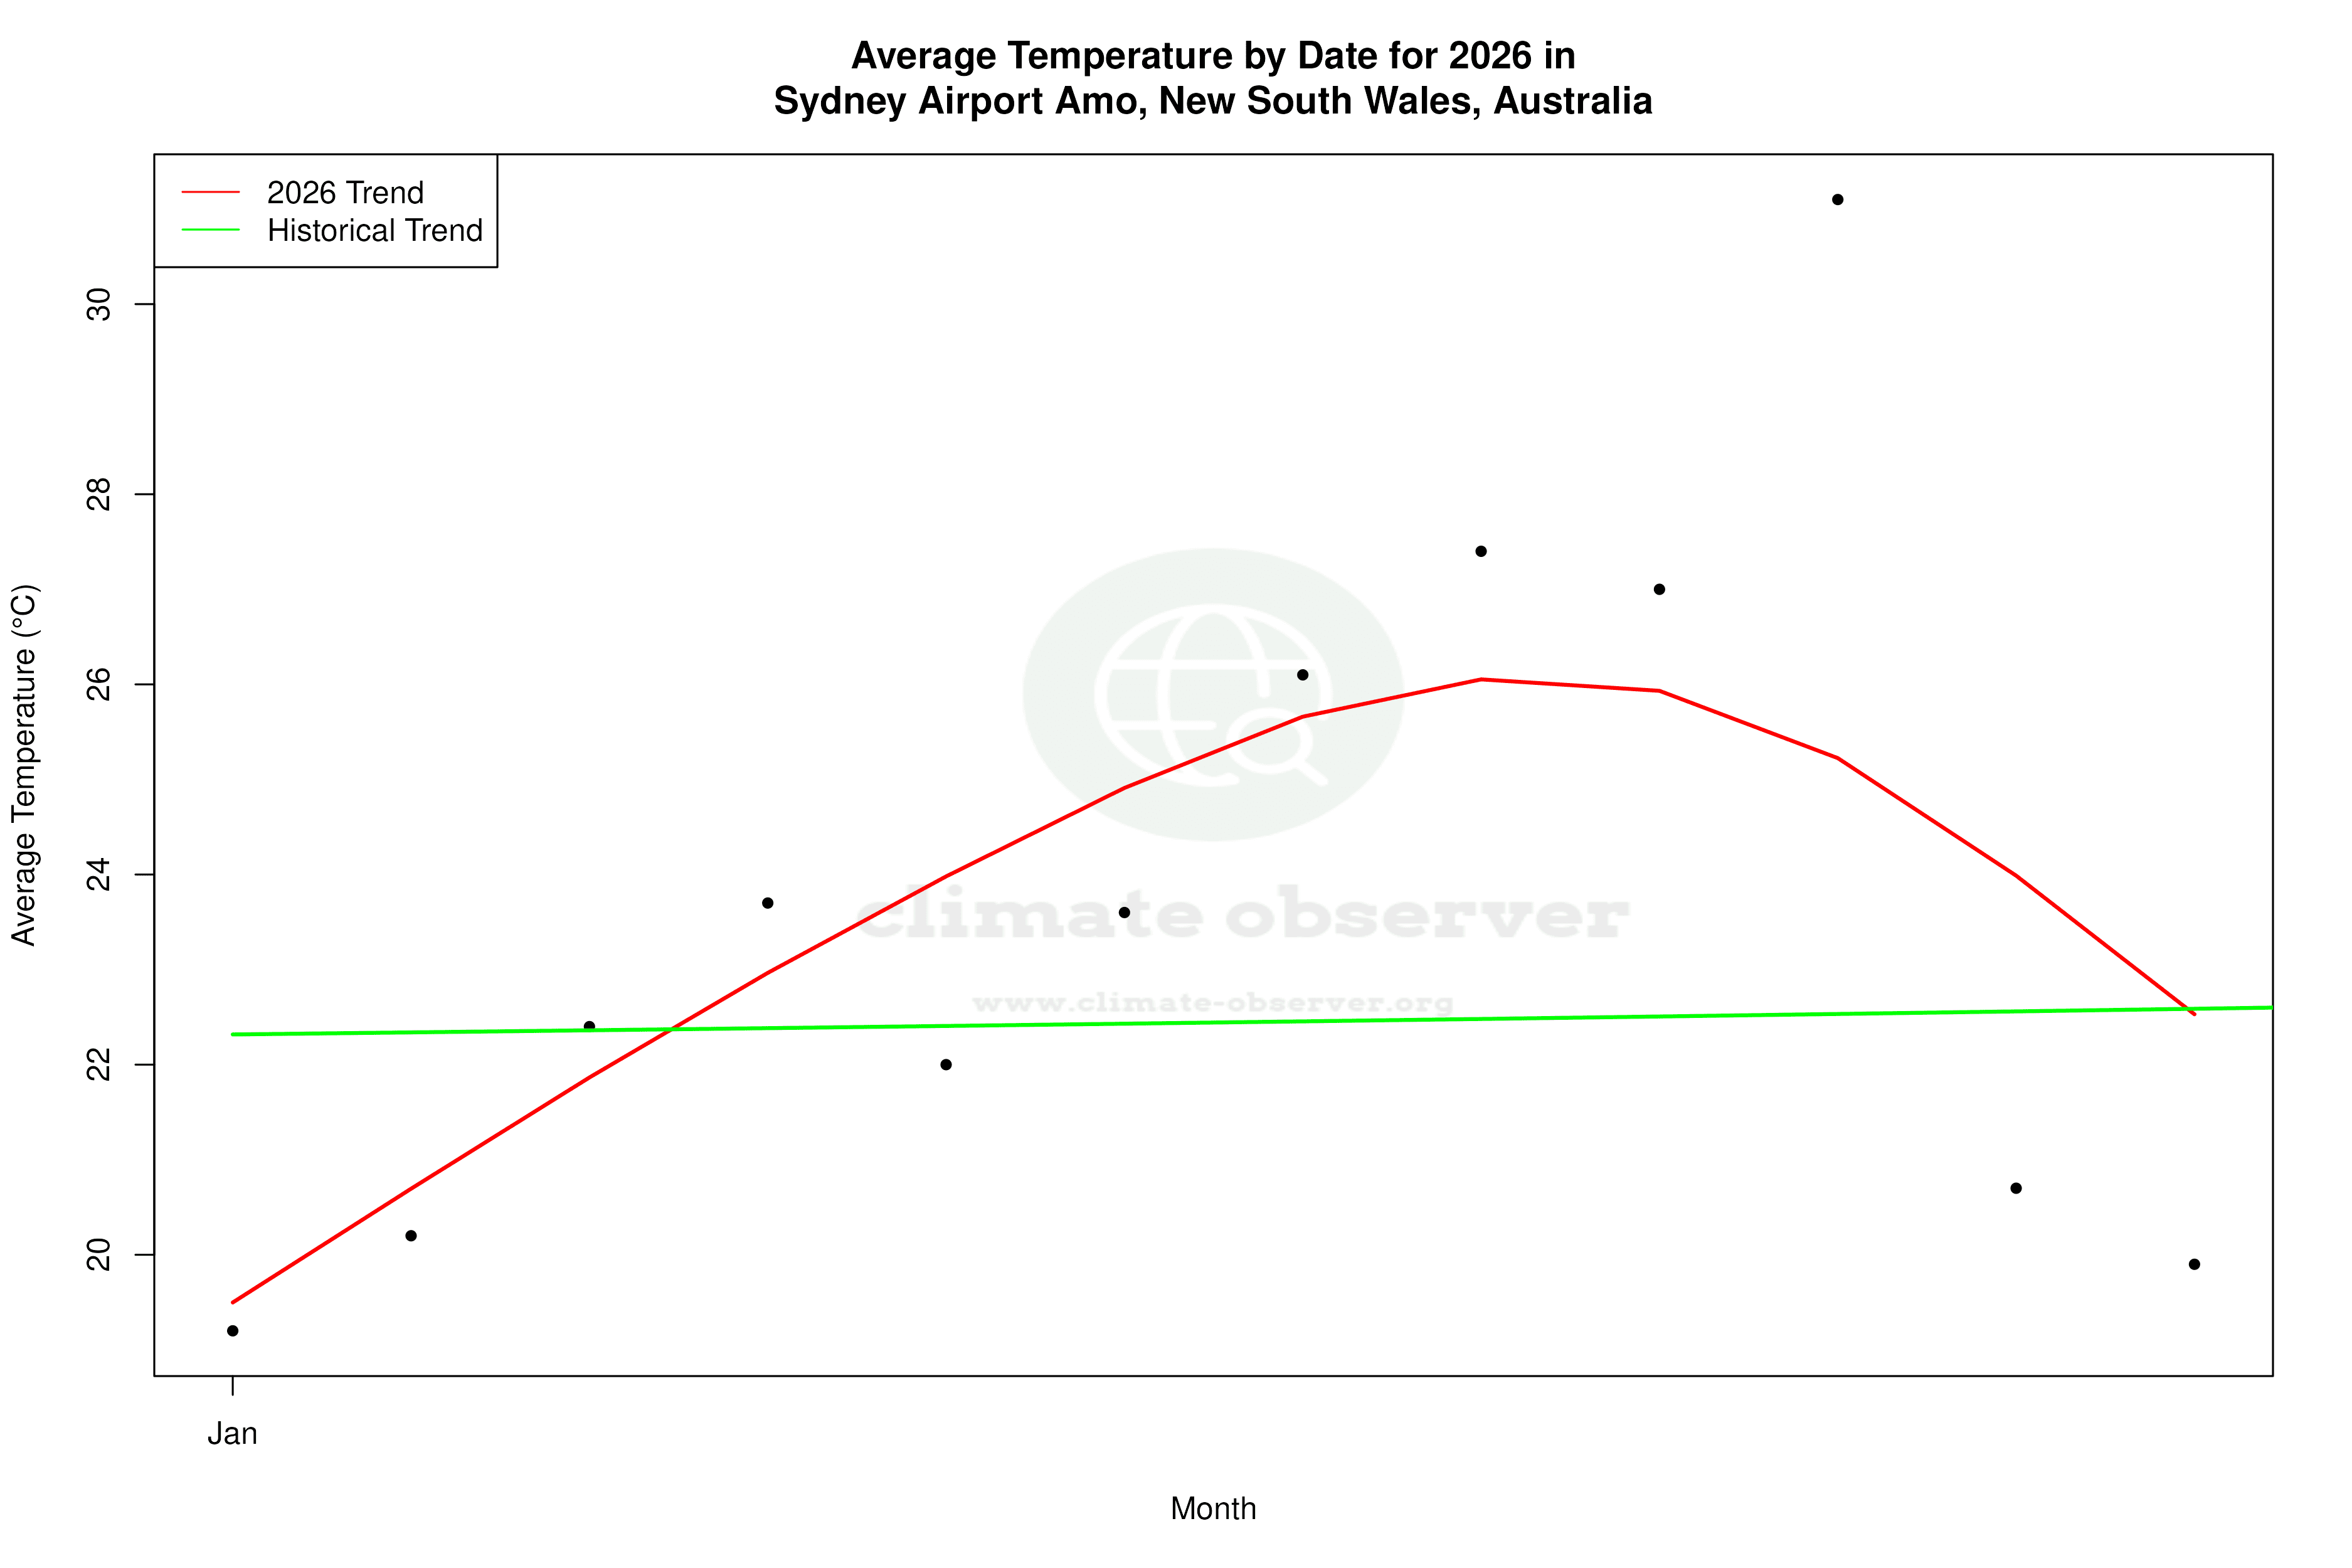


Max Temperature this Year | 1 of 6
Climate 12-Month Moving Averages


Max Temperature 12-Month MA | 1 of 6
Daily Data Points and Averages Throughout the Year
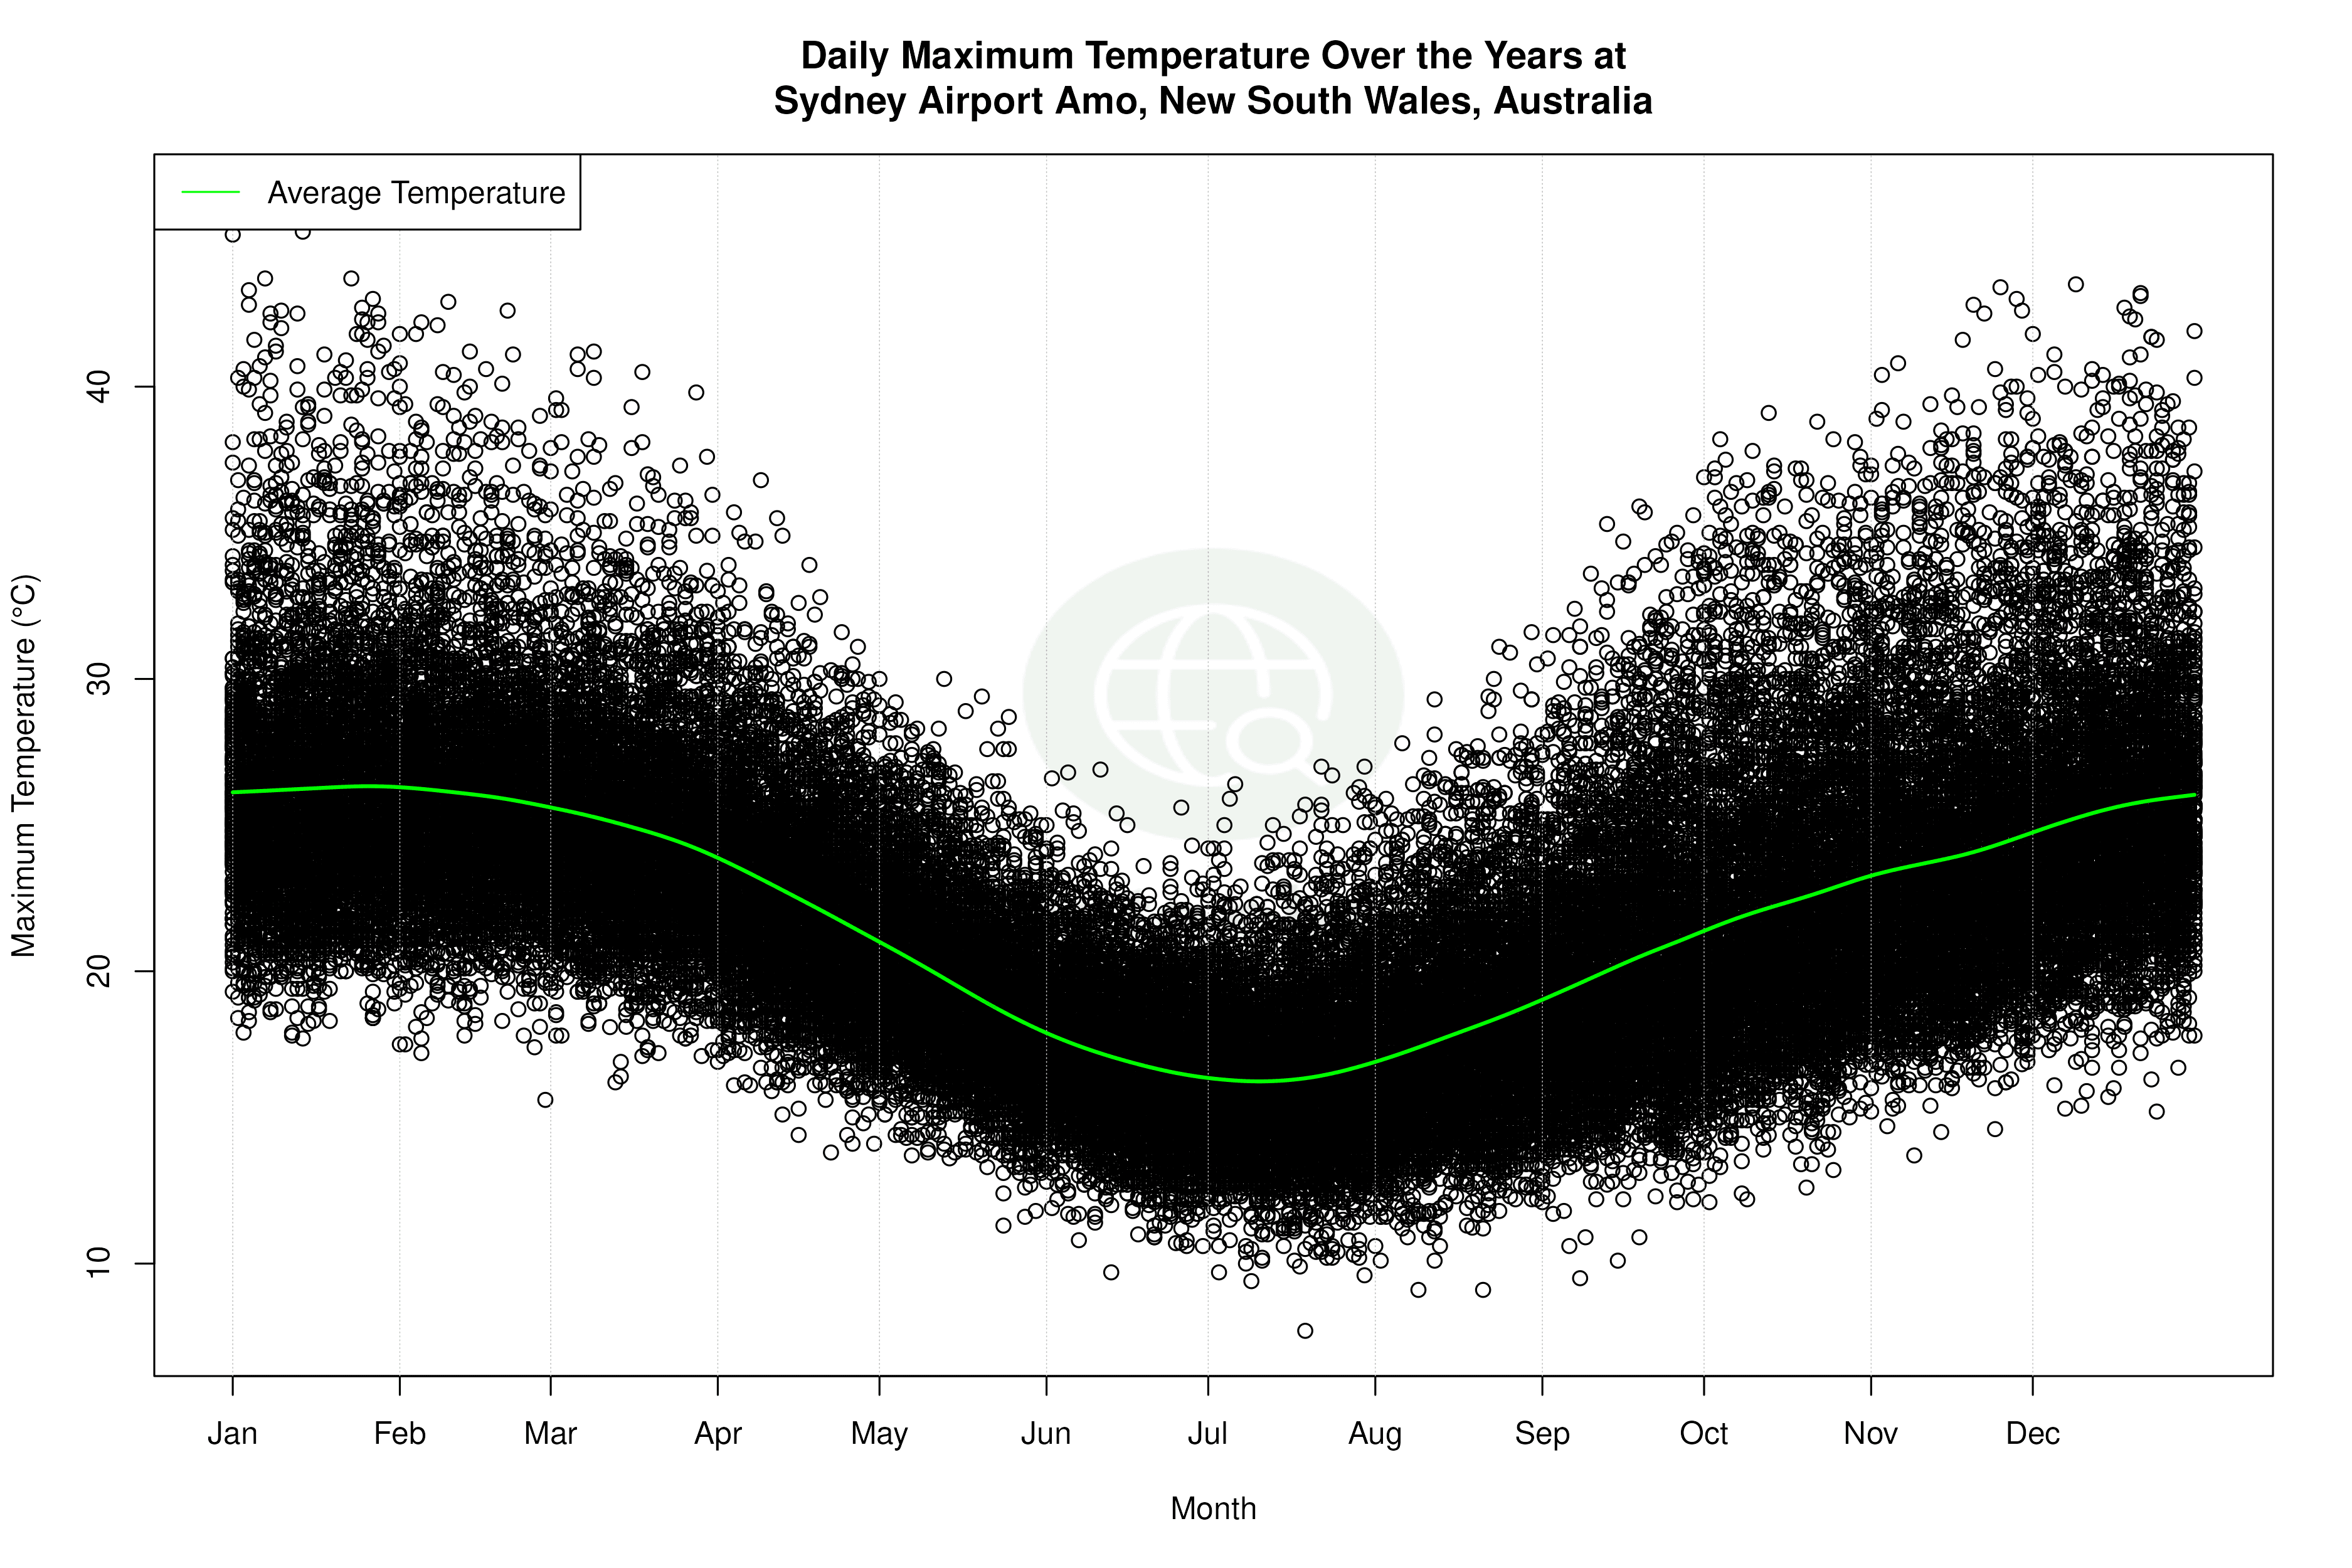


Average Max Temperature Throughout Year | 1 of 5
