Climate for Station: Sydney (Observatory Hill), New South Wales, Australia
Loading live weather...
Climate Analysis & Overview
Sydney's climate at Observatory Hill reveals a complex interplay between cooling short-term trends and long-term warming. While recent decades show a cooling tendency, the all-time data indicates a subtle warming. Precipitation is becoming more evenly distributed, reflecting potential shifts in regional weather patterns.
Sydney's Climatic Identity
Sydney, located at -33.86°S, 151.21°E, is classified under the Köppen climate system as having a humid subtropical climate. This classification is characterised by warm summers and mild winters, influenced significantly by its proximity to the Pacific Ocean. The coastal location moderates temperature extremes, resulting in a generally stable climate. However, the data from Observatory Hill reveals nuanced trends that suggest both short-term cooling and long-term warming dynamics.
Temperature Trends: A Tale of Two Timelines
Over the past decade, Sydney has experienced a cooling trend, with average high temperatures decreasing by 0.24°C (0.43°F) and lows by 0.46°C (0.83°F). This recent cooling contrasts with the all-time temperature trends, which indicate a subtle warming. Over the long term, highs have risen by 0.14°C (0.25°F) and lows by 0.10°C (0.18°F). These figures suggest that while short-term fluctuations may indicate cooling, the broader historical context points to a gradual warming trend, consistent with global climate change patterns.
Precipitation Patterns: A More Even Distribution
The Precipitation Concentration Index (PCI) at Observatory Hill has decreased from a baseline of 14.4 to a current value of 11.3. This decline signifies a more even distribution of rainfall throughout the year, as opposed to concentrated heavy rainfall events. This shift could be attributed to changing atmospheric patterns or regional climate initiatives aimed at managing water resources more effectively. A PCI value below 10 would indicate an even distribution, suggesting that Sydney is moving towards a more balanced precipitation pattern.
Record Extremes: The Bounds of Sydney's Climate
Sydney's historical temperature records highlight the extremes of its climate. The highest recorded temperature is 43.5°C (110.3°F), while the lowest is 2.1°C (35.8°F). These extremes underscore the variability inherent in Sydney's climate, influenced by both natural and anthropogenic factors. Such records are critical for understanding the potential impacts of climate change on urban environments and for planning adaptive strategies.
Regional Implications and Future Outlook
The observed trends at Sydney's Observatory Hill align with Australia's broader climate goals, which include reducing greenhouse gas emissions and enhancing climate resilience. The recent cooling trend may offer temporary relief from heat-related stress, but the long-term warming trajectory underscores the need for continued vigilance and adaptation. Recent weather events, such as intense bushfires and floods, highlight the urgency of understanding and responding to these climatic shifts.
Station Statistics
10-Year Trend
High: -0.48 °F/decade
Low: -0.93 °F/decade
Rain: +0.021 in/decade
25-Year Trend
High: +0.72 °F/decade
Low: +0.41 °F/decade
Rain: +0.014 in/decade
50-Year Trend
High: +0.57 °F/decade
Low: +0.34 °F/decade
Rain: +0.002 in/decade
All-Time Trend
High: +0.24 °F/decade
Low: +0.18 °F/decade
Rain: -0.001 in/decade
Percentage Above-Average Days
Last 12 Months: 60.3%
This Year: 62.3%
Precipitation Concentration Index (PCI) ℹ️
Last 12 Months: 16.4
Historical Average: 14.0
Percentile Rank of Last 12 Months ℹ️
High: 96th percentile
Low: 93rd percentile
Rain: 65th percentile
Change in Variance ℹ️
High: +6.2%
Low: +5.9%
Intraday: +18.1%
Data Coverage
85.9%
First Year of Data
1858
Station Location
Historical Weather Records
| Max High | Avg High | Min High | Max Avg | Avg Avg | Min Avg | Max Low | Avg Low | Min Low | Max Precipitation | Avg Precipitation | Max Snow | Avg Snow | |
|---|---|---|---|---|---|---|---|---|---|---|---|---|---|
| Record | 110.30 °F | — | 45.86 °F | 92.84 °F | — | 43.16 °F | 81.68 °F | — | 35.78 °F | 11.05 in | — | — | — |
| January | 109.40 °F | 78.87 °F | 62.96 °F | 92.12 °F | 72.89 °F | 60.08 °F | 79.16 °F | 65.88 °F | 51.08 °F | 7.08 in | 0.12 in | — | — |
| February | 106.16 °F | 78.53 °F | 60.08 °F | 92.84 °F | 72.76 °F | 59.36 °F | 81.68 °F | 66.03 °F | 49.28 °F | 8.90 in | 0.15 in | — | — |
| March | 103.64 °F | 76.72 °F | 61.16 °F | 85.64 °F | 70.70 °F | 58.10 °F | 77.72 °F | 63.83 °F | 48.74 °F | 11.05 in | 0.16 in | — | — |
| April | 95.72 °F | 72.58 °F | 56.84 °F | 84.02 °F | 65.82 °F | 51.44 °F | 75.74 °F | 58.62 °F | 44.60 °F | 7.52 in | 0.16 in | — | — |
| May | 86.00 °F | 67.22 °F | 52.34 °F | 73.76 °F | 60.11 °F | 48.20 °F | 69.44 °F | 52.95 °F | 39.92 °F | 8.36 in | 0.14 in | — | — |
| June | 80.42 °F | 62.68 °F | 49.46 °F | 67.64 °F | 55.77 °F | 45.68 °F | 65.12 °F | 48.81 °F | 35.78 °F | 5.17 in | 0.16 in | — | — |
| July | 79.70 °F | 61.65 °F | 45.86 °F | 68.54 °F | 54.25 °F | 43.16 °F | 64.58 °F | 46.66 °F | 35.96 °F | 5.71 in | 0.12 in | — | — |
| August | 88.88 °F | 64.30 °F | 48.38 °F | 74.30 °F | 56.38 °F | 45.86 °F | 67.46 °F | 48.28 °F | 36.86 °F | 6.44 in | 0.10 in | — | — |
| September | 96.62 °F | 68.31 °F | 49.10 °F | 82.40 °F | 60.74 °F | 48.92 °F | 73.40 °F | 52.15 °F | 40.82 °F | 5.69 in | 0.08 in | — | — |
| October | 101.84 °F | 72.02 °F | 53.78 °F | 84.92 °F | 64.73 °F | 50.72 °F | 78.08 °F | 56.64 °F | 42.26 °F | 6.37 in | 0.09 in | — | — |
| November | 110.12 °F | 74.72 °F | 54.68 °F | 87.08 °F | 67.66 °F | 54.32 °F | 76.64 °F | 60.31 °F | 45.86 °F | 5.24 in | 0.10 in | — | — |
| December | 110.30 °F | 77.54 °F | 59.36 °F | 88.88 °F | 70.90 °F | 58.10 °F | 80.78 °F | 63.70 °F | 48.38 °F | 4.96 in | 0.09 in | — | — |
Data Visualisations
Remove WatermarksCurrent Year Climate Trends vs Historical
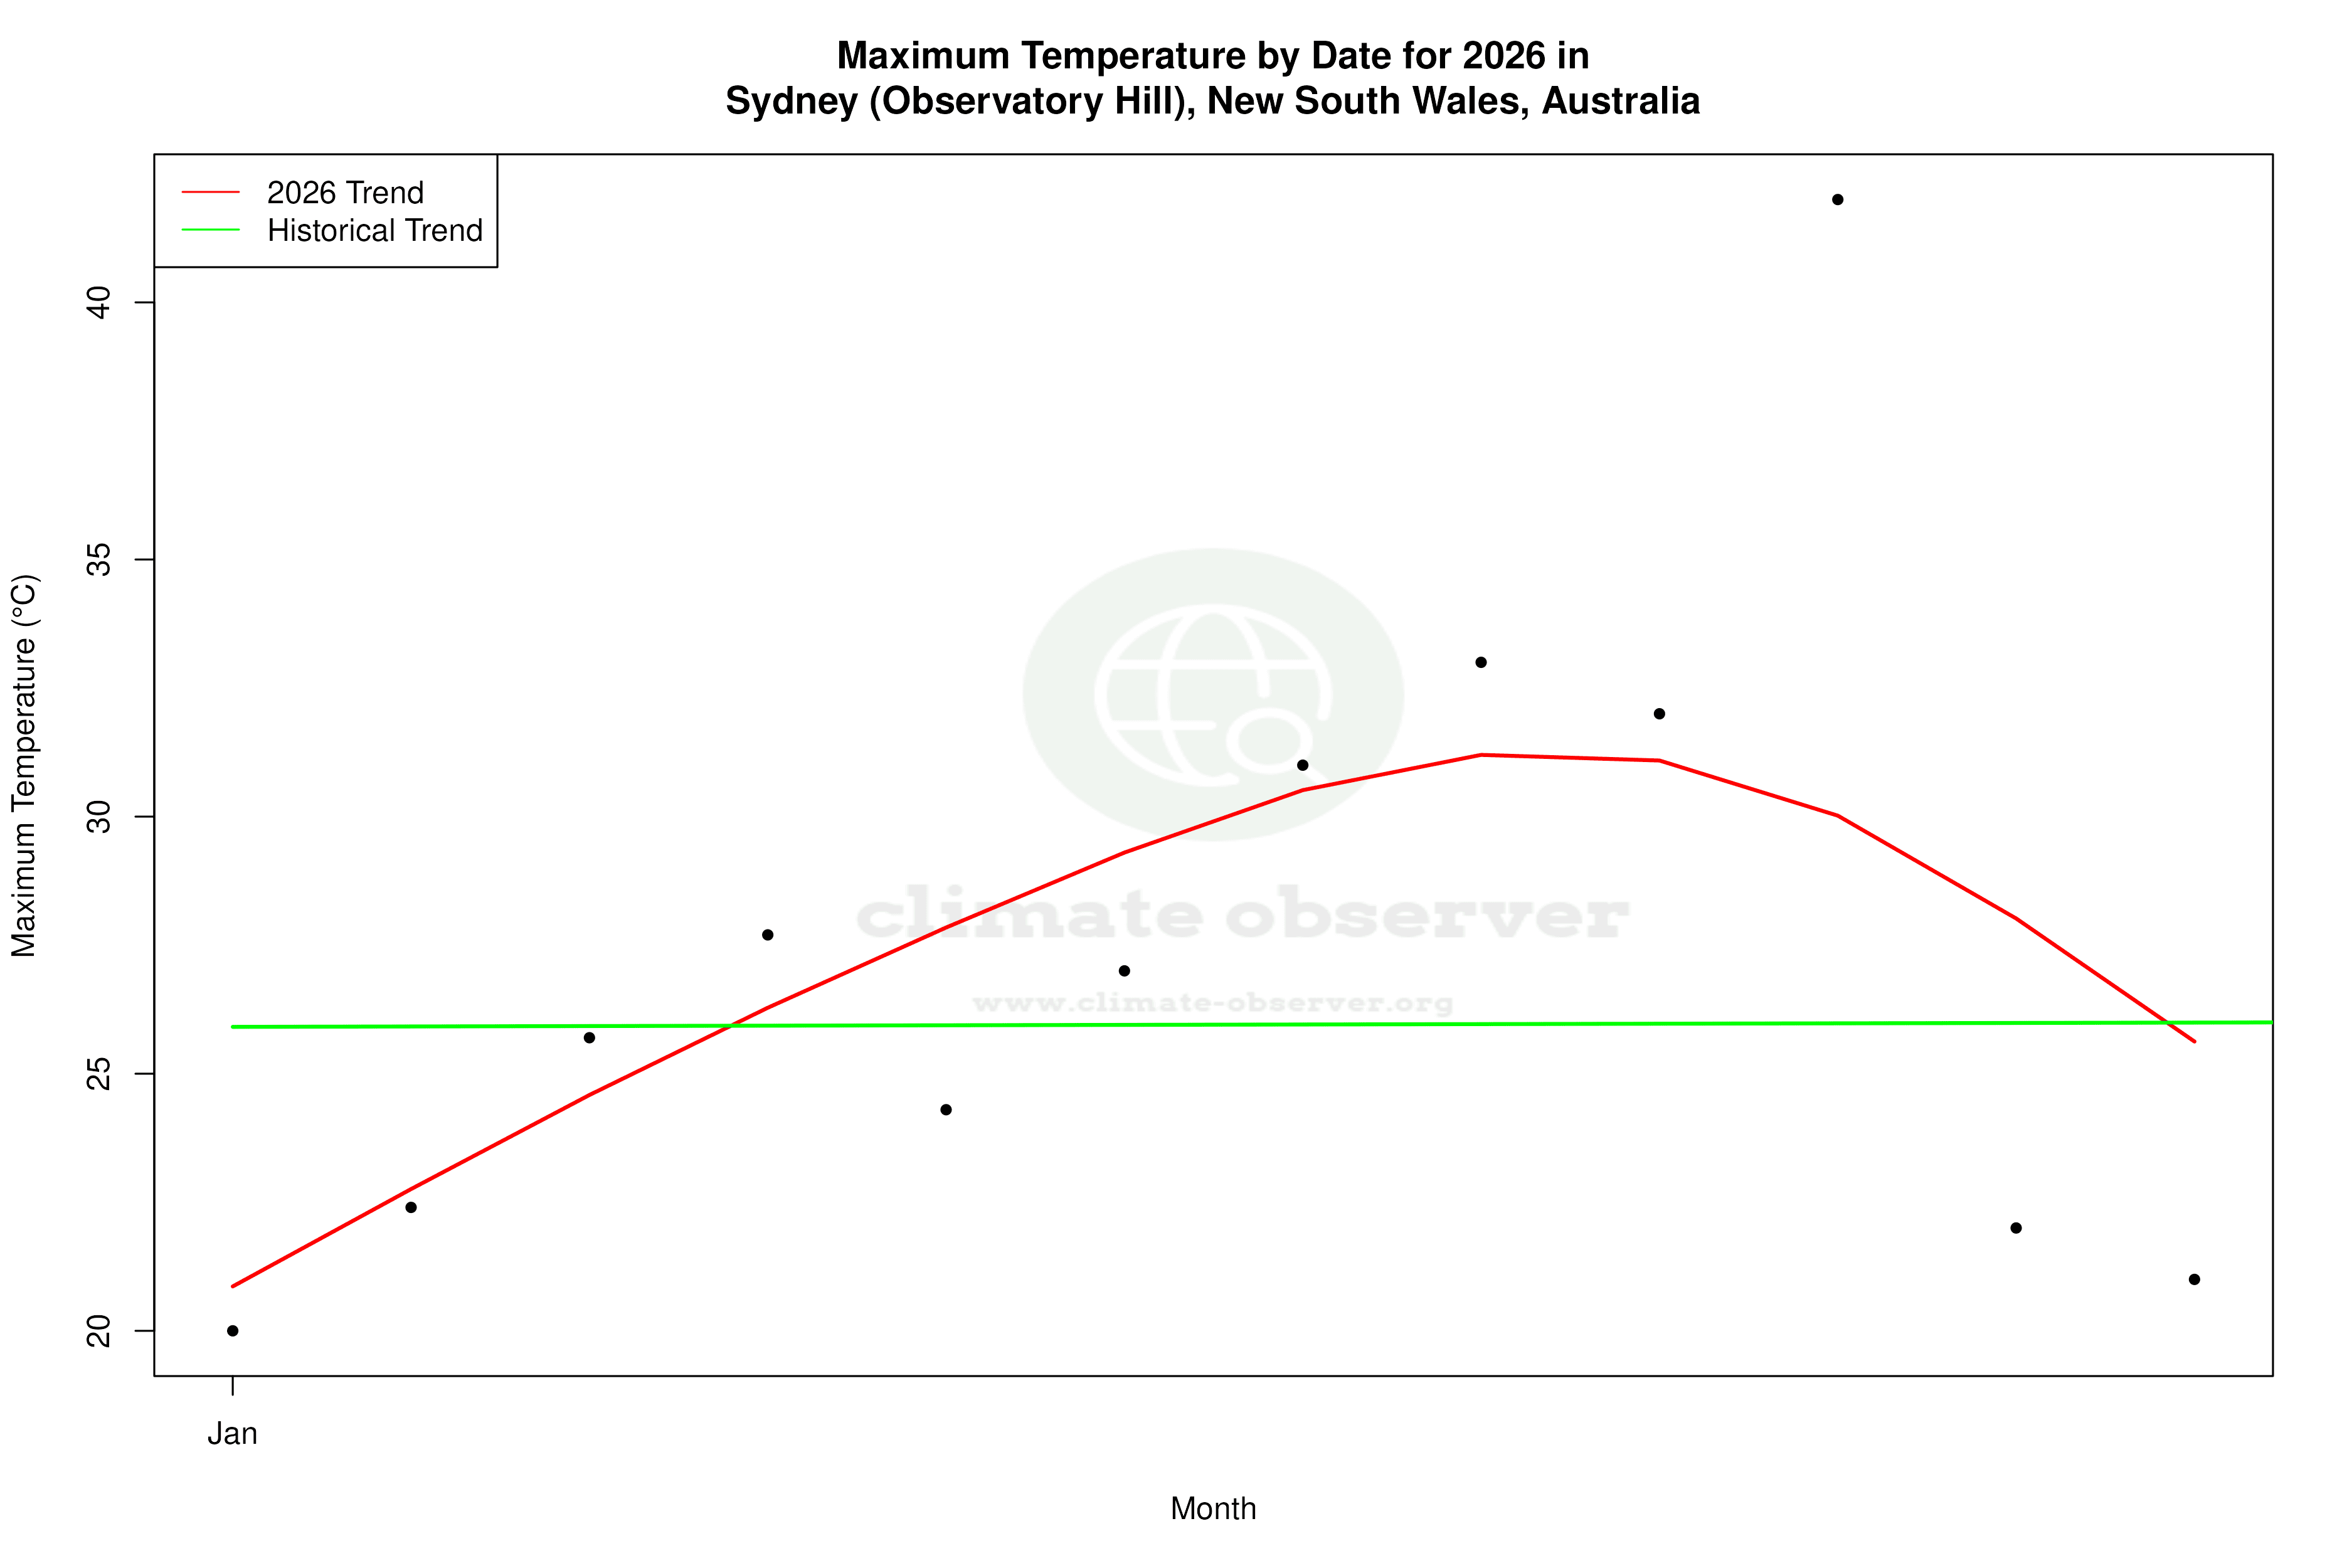


Max Temperature this Year | 1 of 6
Climate 12-Month Moving Averages


Max Temperature 12-Month MA | 1 of 6
Daily Data Points and Averages Throughout the Year


Average Max Temperature Throughout Year | 1 of 5
