Climate for Station: Wien, Vienna, Austria
Loading live weather...
Climate Analysis & Overview
Wien's climate is experiencing a noticeable warming trend, with both highs and lows increasing over time. Precipitation patterns have become more evenly distributed, indicating a shift towards more consistent rainfall throughout the year. These changes are critical in the context of Austria's climate goals and recent weather anomalies.
Warming Trends in Wien
Wien, located at 48.2331°N, 16.35°E, falls under the Köppen climate classification of Cfb, indicating a temperate oceanic climate with warm summers and no dry season. The city's geographical setting, nestled in the Vienna Basin and shielded by the Eastern Alps, influences its climate dynamics significantly. Over the last decade, Wien has experienced a warming trend, with high temperatures rising by 0.81°C (1.46°F) and lows by 0.42°C (0.76°F). This recent warming is more pronounced compared to the all-time trends, where highs have risen by 0.16°C (0.29°F) and lows by 0.14°C (0.25°F). Such warming trends align with Austria's broader climate objectives to mitigate temperature increases and adapt to changing conditions.
Precipitation Patterns: A Shift Towards Consistency
The Precipitation Concentration Index (PCI) provides insights into how rainfall is distributed over time. In Wien, the PCI has decreased from a baseline of 11.79 to a current value of 10.74. This marginal decrease suggests that precipitation is now more evenly distributed across the year, rather than being concentrated in fewer, more intense events. Such a shift can be beneficial for agriculture and water management, reducing the risk of droughts and floods, and supporting Austria's efforts to enhance climate resilience.
Temperature Extremes: Records and Realities
Wien's temperature records highlight the city's climatic extremes. The highest recorded temperature stands at 38.5°C (101.3°F), while the lowest is -22.6°C (-8.7°F). These extremes underscore the variability inherent in Wien's climate, influenced by its geographical position and the moderating effects of the surrounding landscape. Understanding these extremes is crucial for planning and infrastructure development, ensuring that the city can withstand both heatwaves and cold snaps.
Implications for Regional Climate Goals
Austria has set ambitious climate targets, aiming to reduce greenhouse gas emissions and increase renewable energy usage. The warming trends observed in Wien, coupled with changes in precipitation patterns, highlight the challenges and opportunities in meeting these goals. Recent weather events, such as heatwaves and unusual rainfall patterns, serve as reminders of the urgency to adapt and mitigate climate impacts. As Wien continues to warm, these insights will be vital for policymakers and stakeholders working towards a sustainable future.
Station Statistics
10-Year Trend
High: +1.21 °F/decade
Low: +0.62 °F/decade
Rain: -0.004 in/decade
25-Year Trend
High: +1.63 °F/decade
Low: +1.07 °F/decade
Rain: -0.002 in/decade
50-Year Trend
High: +1.07 °F/decade
Low: +0.76 °F/decade
Rain: +0.002 in/decade
All-Time Trend
High: +0.27 °F/decade
Low: +0.23 °F/decade
Rain: -0.001 in/decade
Percentage Above-Average Days
Last 12 Months: 55.3%
This Year: 60.1%
Precipitation Concentration Index (PCI) ℹ️
Last 12 Months: 10.4
Historical Average: 11.5
Percentile Rank of Last 12 Months ℹ️
High: 92nd percentile
Low: 90th percentile
Rain: 13th percentile
Change in Variance ℹ️
High: +0.4%
Low: -10.0%
Intraday: +22.1%
Data Coverage
78.4%
First Year of Data
1855
Station Location
Historical Weather Records
| Max High | Avg High | Min High | Max Avg | Avg Avg | Min Avg | Max Low | Avg Low | Min Low | Max Precipitation | Avg Precipitation | Max Snow | Avg Snow | |
|---|---|---|---|---|---|---|---|---|---|---|---|---|---|
| Record | 101.30 °F | — | 0.32 °F | 86.18 °F | — | 1.04 °F | 77.54 °F | — | -8.68 °F | 3.65 in | — | — | — |
| January | 65.66 °F | 35.46 °F | 3.74 °F | 56.48 °F | 32.47 °F | 1.04 °F | 52.52 °F | 26.52 °F | -7.96 °F | 1.05 in | 0.05 in | — | — |
| February | 69.08 °F | 39.53 °F | 0.32 °F | 59.00 °F | 35.35 °F | 3.92 °F | 56.12 °F | 28.85 °F | -8.68 °F | 2.44 in | 0.05 in | — | — |
| March | 77.90 °F | 48.80 °F | 15.98 °F | 64.76 °F | 42.63 °F | 12.92 °F | 57.20 °F | 34.65 °F | 2.66 °F | 1.71 in | 0.06 in | — | — |
| April | 86.00 °F | 59.11 °F | 31.10 °F | 72.32 °F | 51.40 °F | 30.74 °F | 61.70 °F | 42.18 °F | 17.42 °F | 1.87 in | 0.06 in | — | — |
| May | 93.20 °F | 67.60 °F | 40.28 °F | 77.18 °F | 59.74 °F | 38.84 °F | 71.24 °F | 50.21 °F | 29.12 °F | 3.65 in | 0.09 in | — | — |
| June | 97.70 °F | 73.81 °F | 50.72 °F | 84.38 °F | 65.98 °F | 46.94 °F | 74.66 °F | 56.62 °F | 37.76 °F | 3.07 in | 0.09 in | — | — |
| July | 100.94 °F | 77.51 °F | 53.96 °F | 86.18 °F | 69.23 °F | 52.70 °F | 77.54 °F | 59.81 °F | 44.42 °F | 2.91 in | 0.10 in | — | — |
| August | 101.30 °F | 76.34 °F | 53.78 °F | 85.46 °F | 68.23 °F | 50.90 °F | 77.54 °F | 58.82 °F | 43.70 °F | 2.98 in | 0.08 in | — | — |
| September | 92.30 °F | 68.56 °F | 44.60 °F | 77.90 °F | 60.76 °F | 44.96 °F | 69.44 °F | 52.61 °F | 30.92 °F | 3.36 in | 0.07 in | — | — |
| October | 82.04 °F | 57.40 °F | 28.58 °F | 69.08 °F | 50.79 °F | 30.56 °F | 62.60 °F | 44.27 °F | 15.62 °F | 2.74 in | 0.06 in | — | — |
| November | 71.06 °F | 45.17 °F | 16.88 °F | 62.96 °F | 41.57 °F | 21.74 °F | 62.42 °F | 36.09 °F | 6.26 °F | 1.94 in | 0.06 in | — | — |
| December | 66.38 °F | 37.65 °F | 8.60 °F | 56.66 °F | 34.64 °F | 6.44 °F | 53.42 °F | 29.49 °F | -5.26 °F | 1.98 in | 0.06 in | — | — |
Data Visualisations
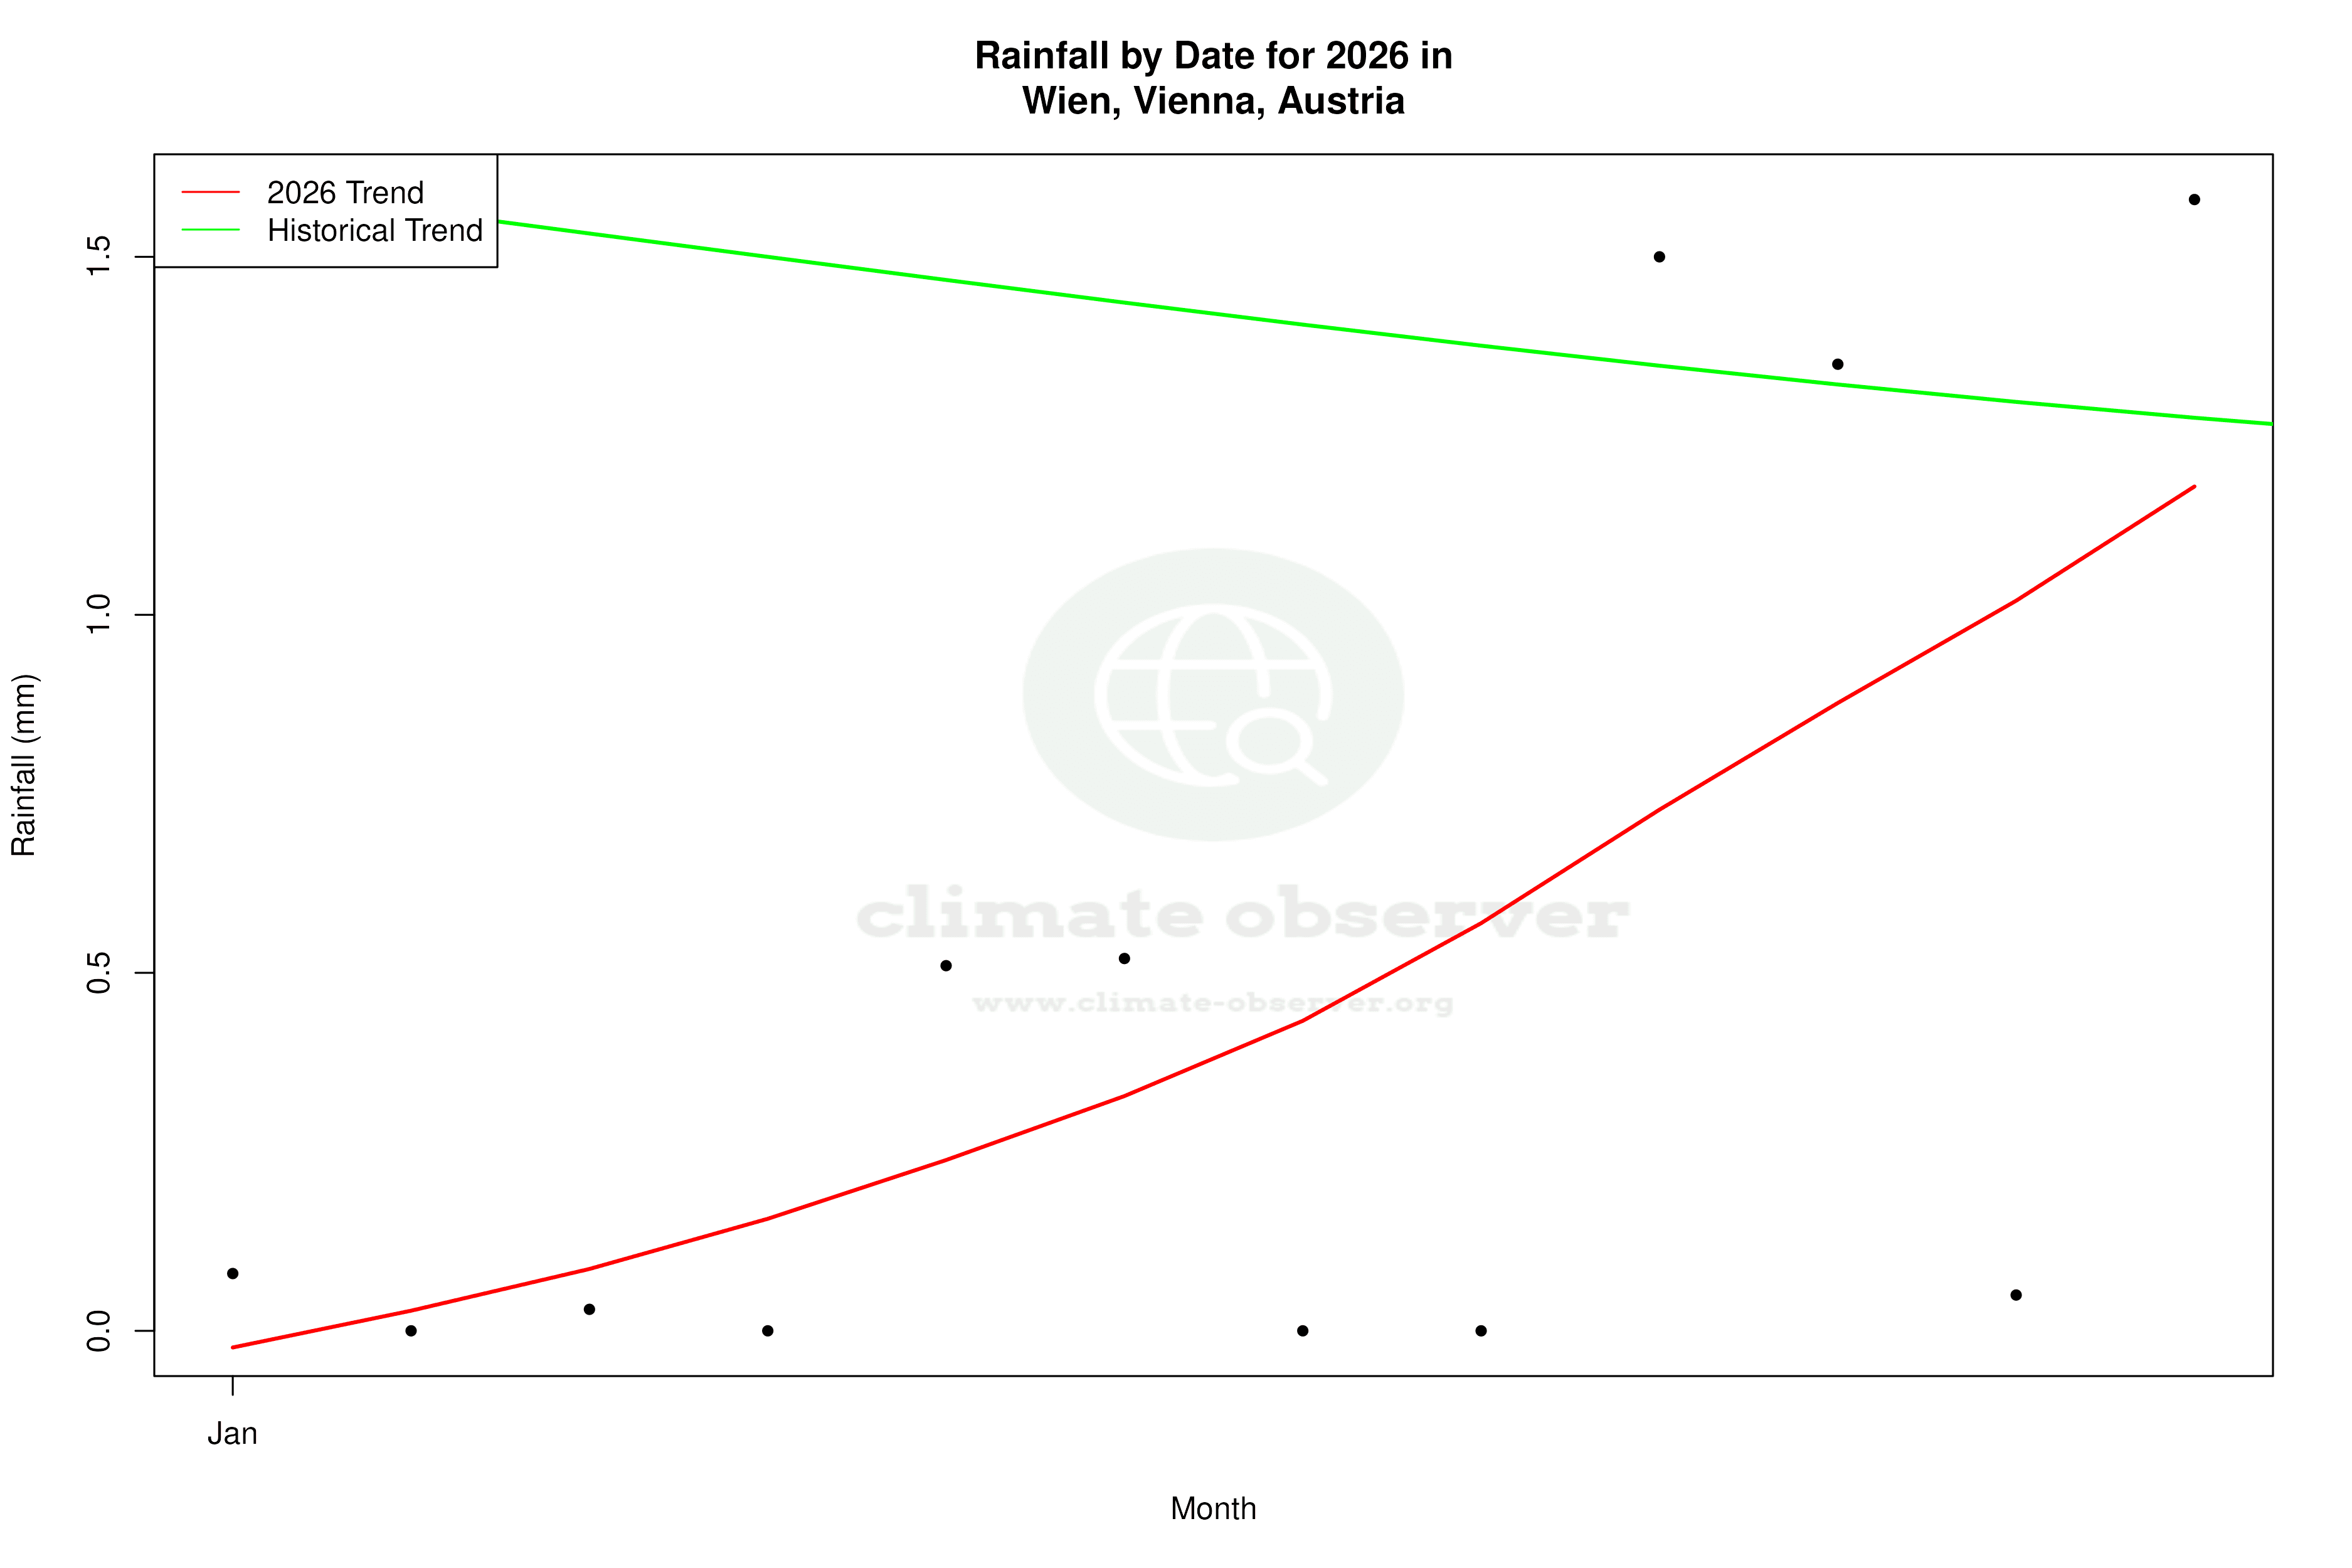
Remove WatermarksCurrent Year Climate Trends vs Historical


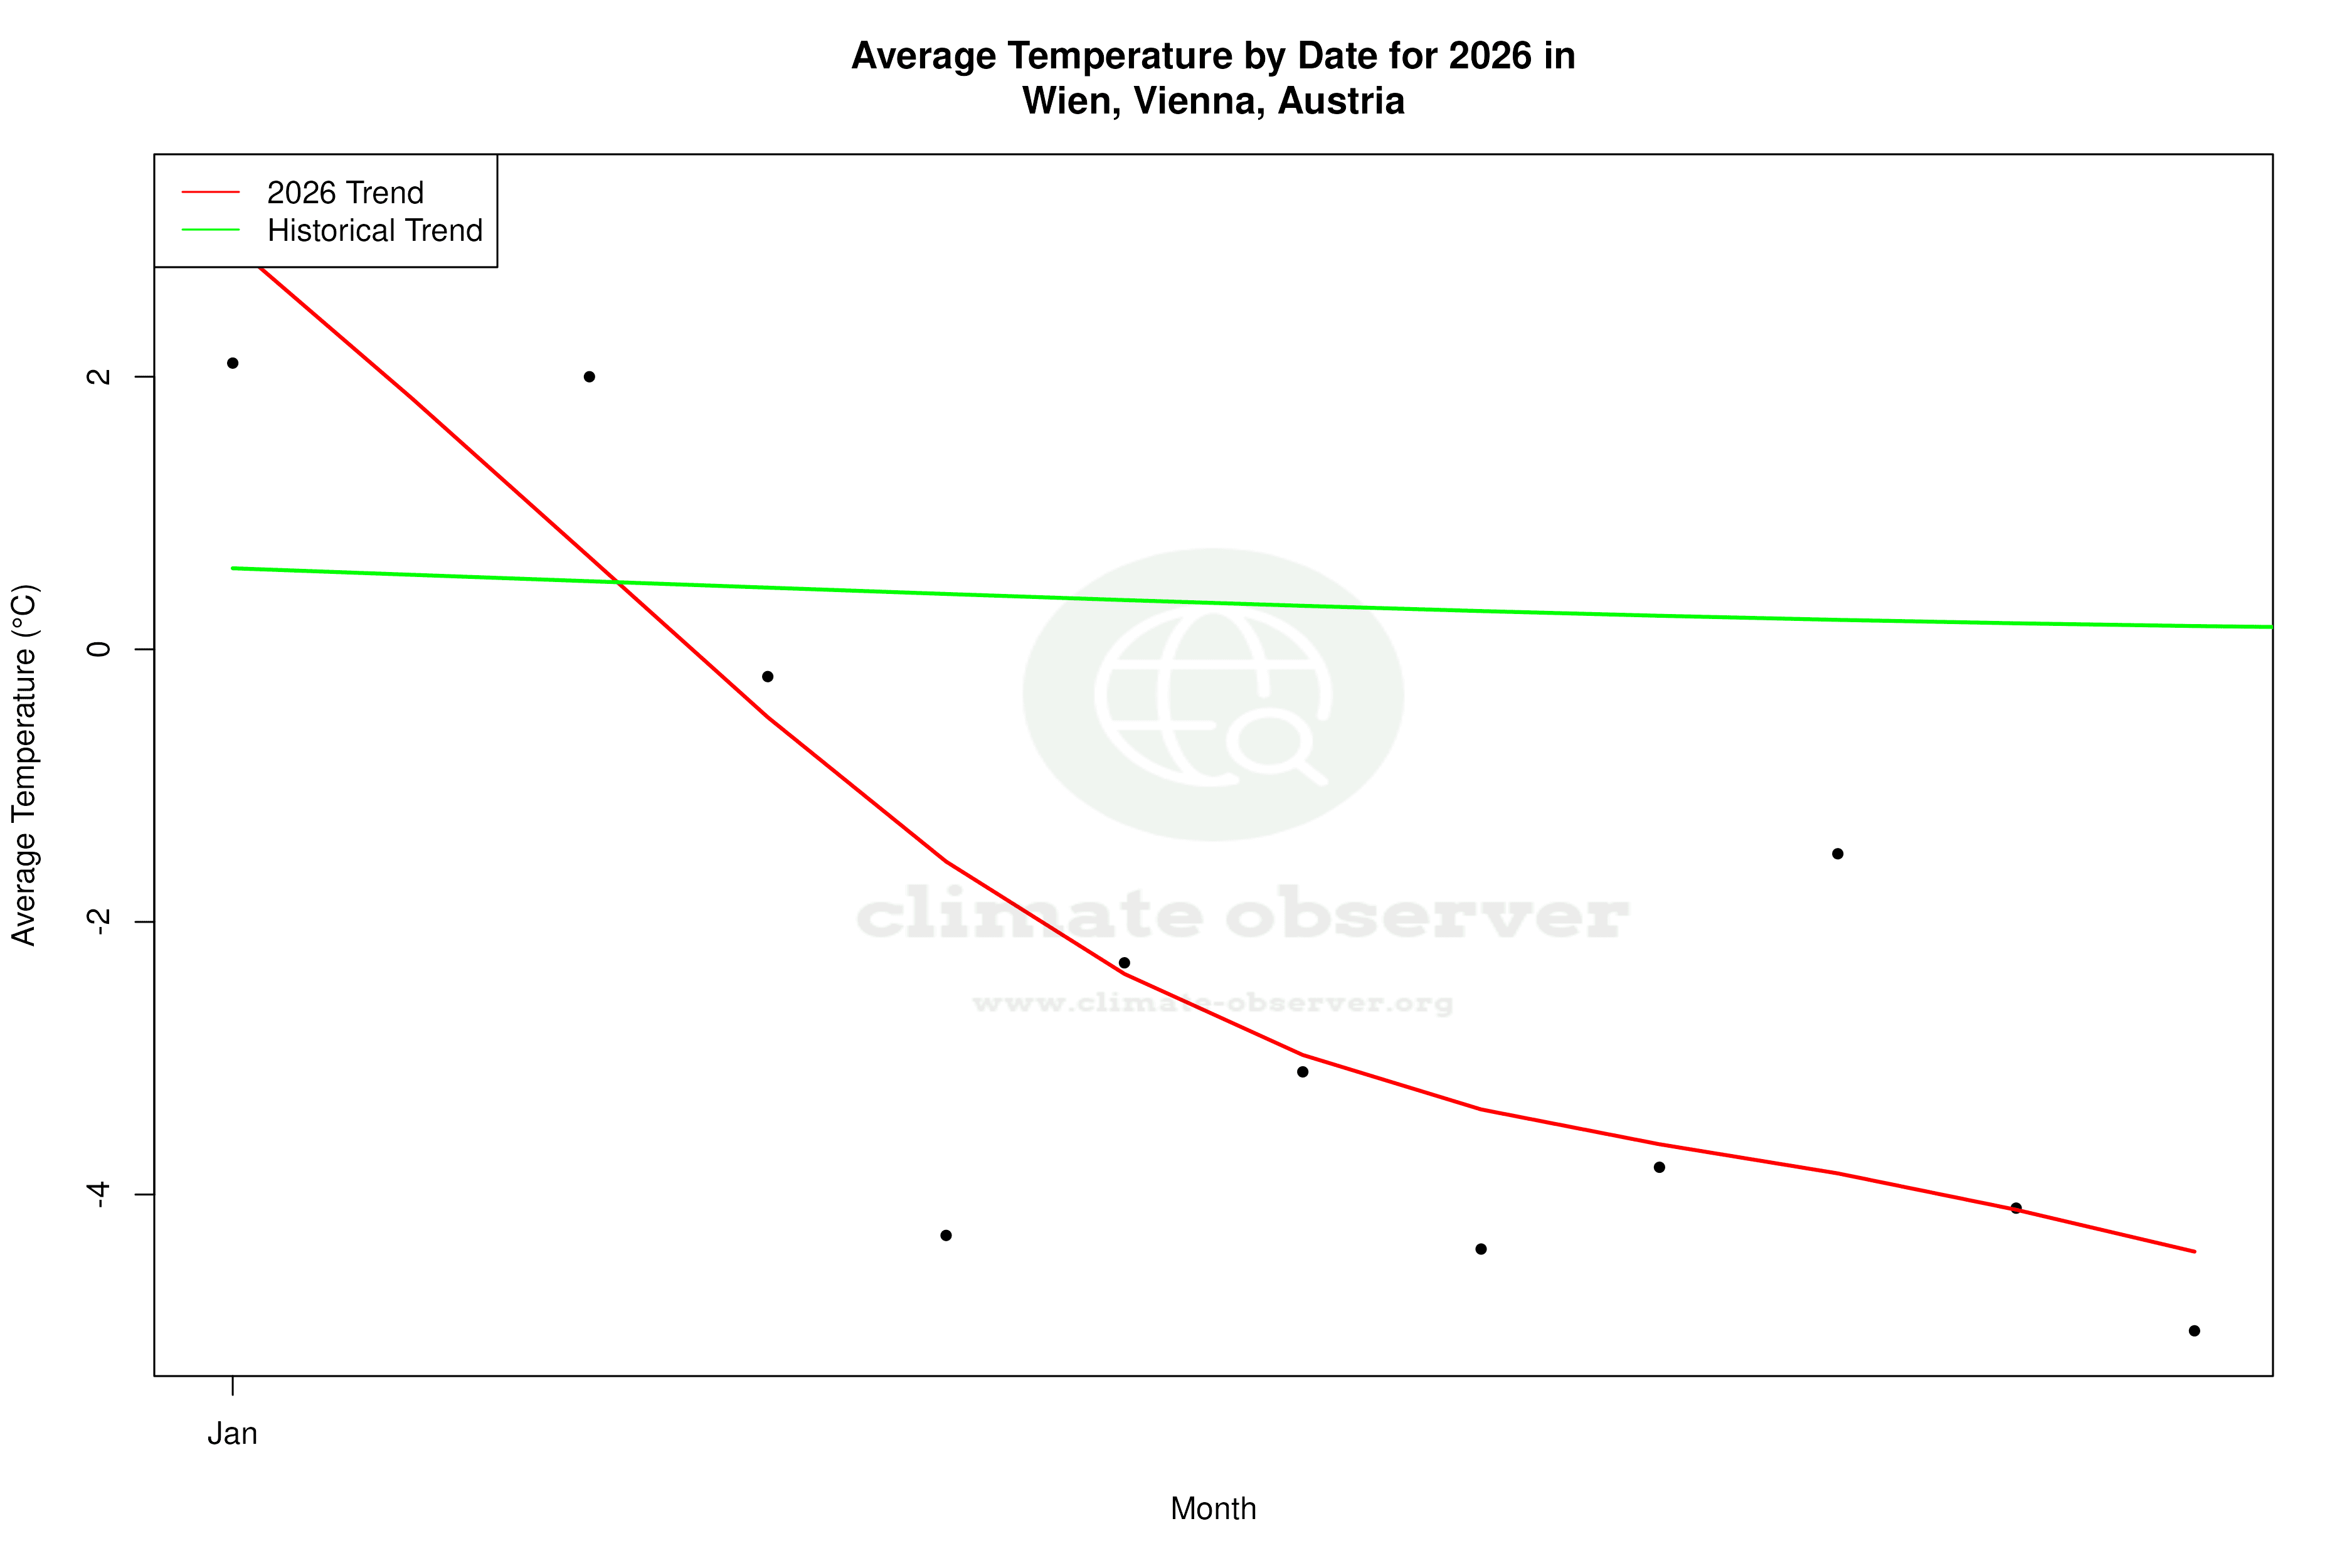


Max Temperature this Year | 1 of 6
Climate 12-Month Moving Averages


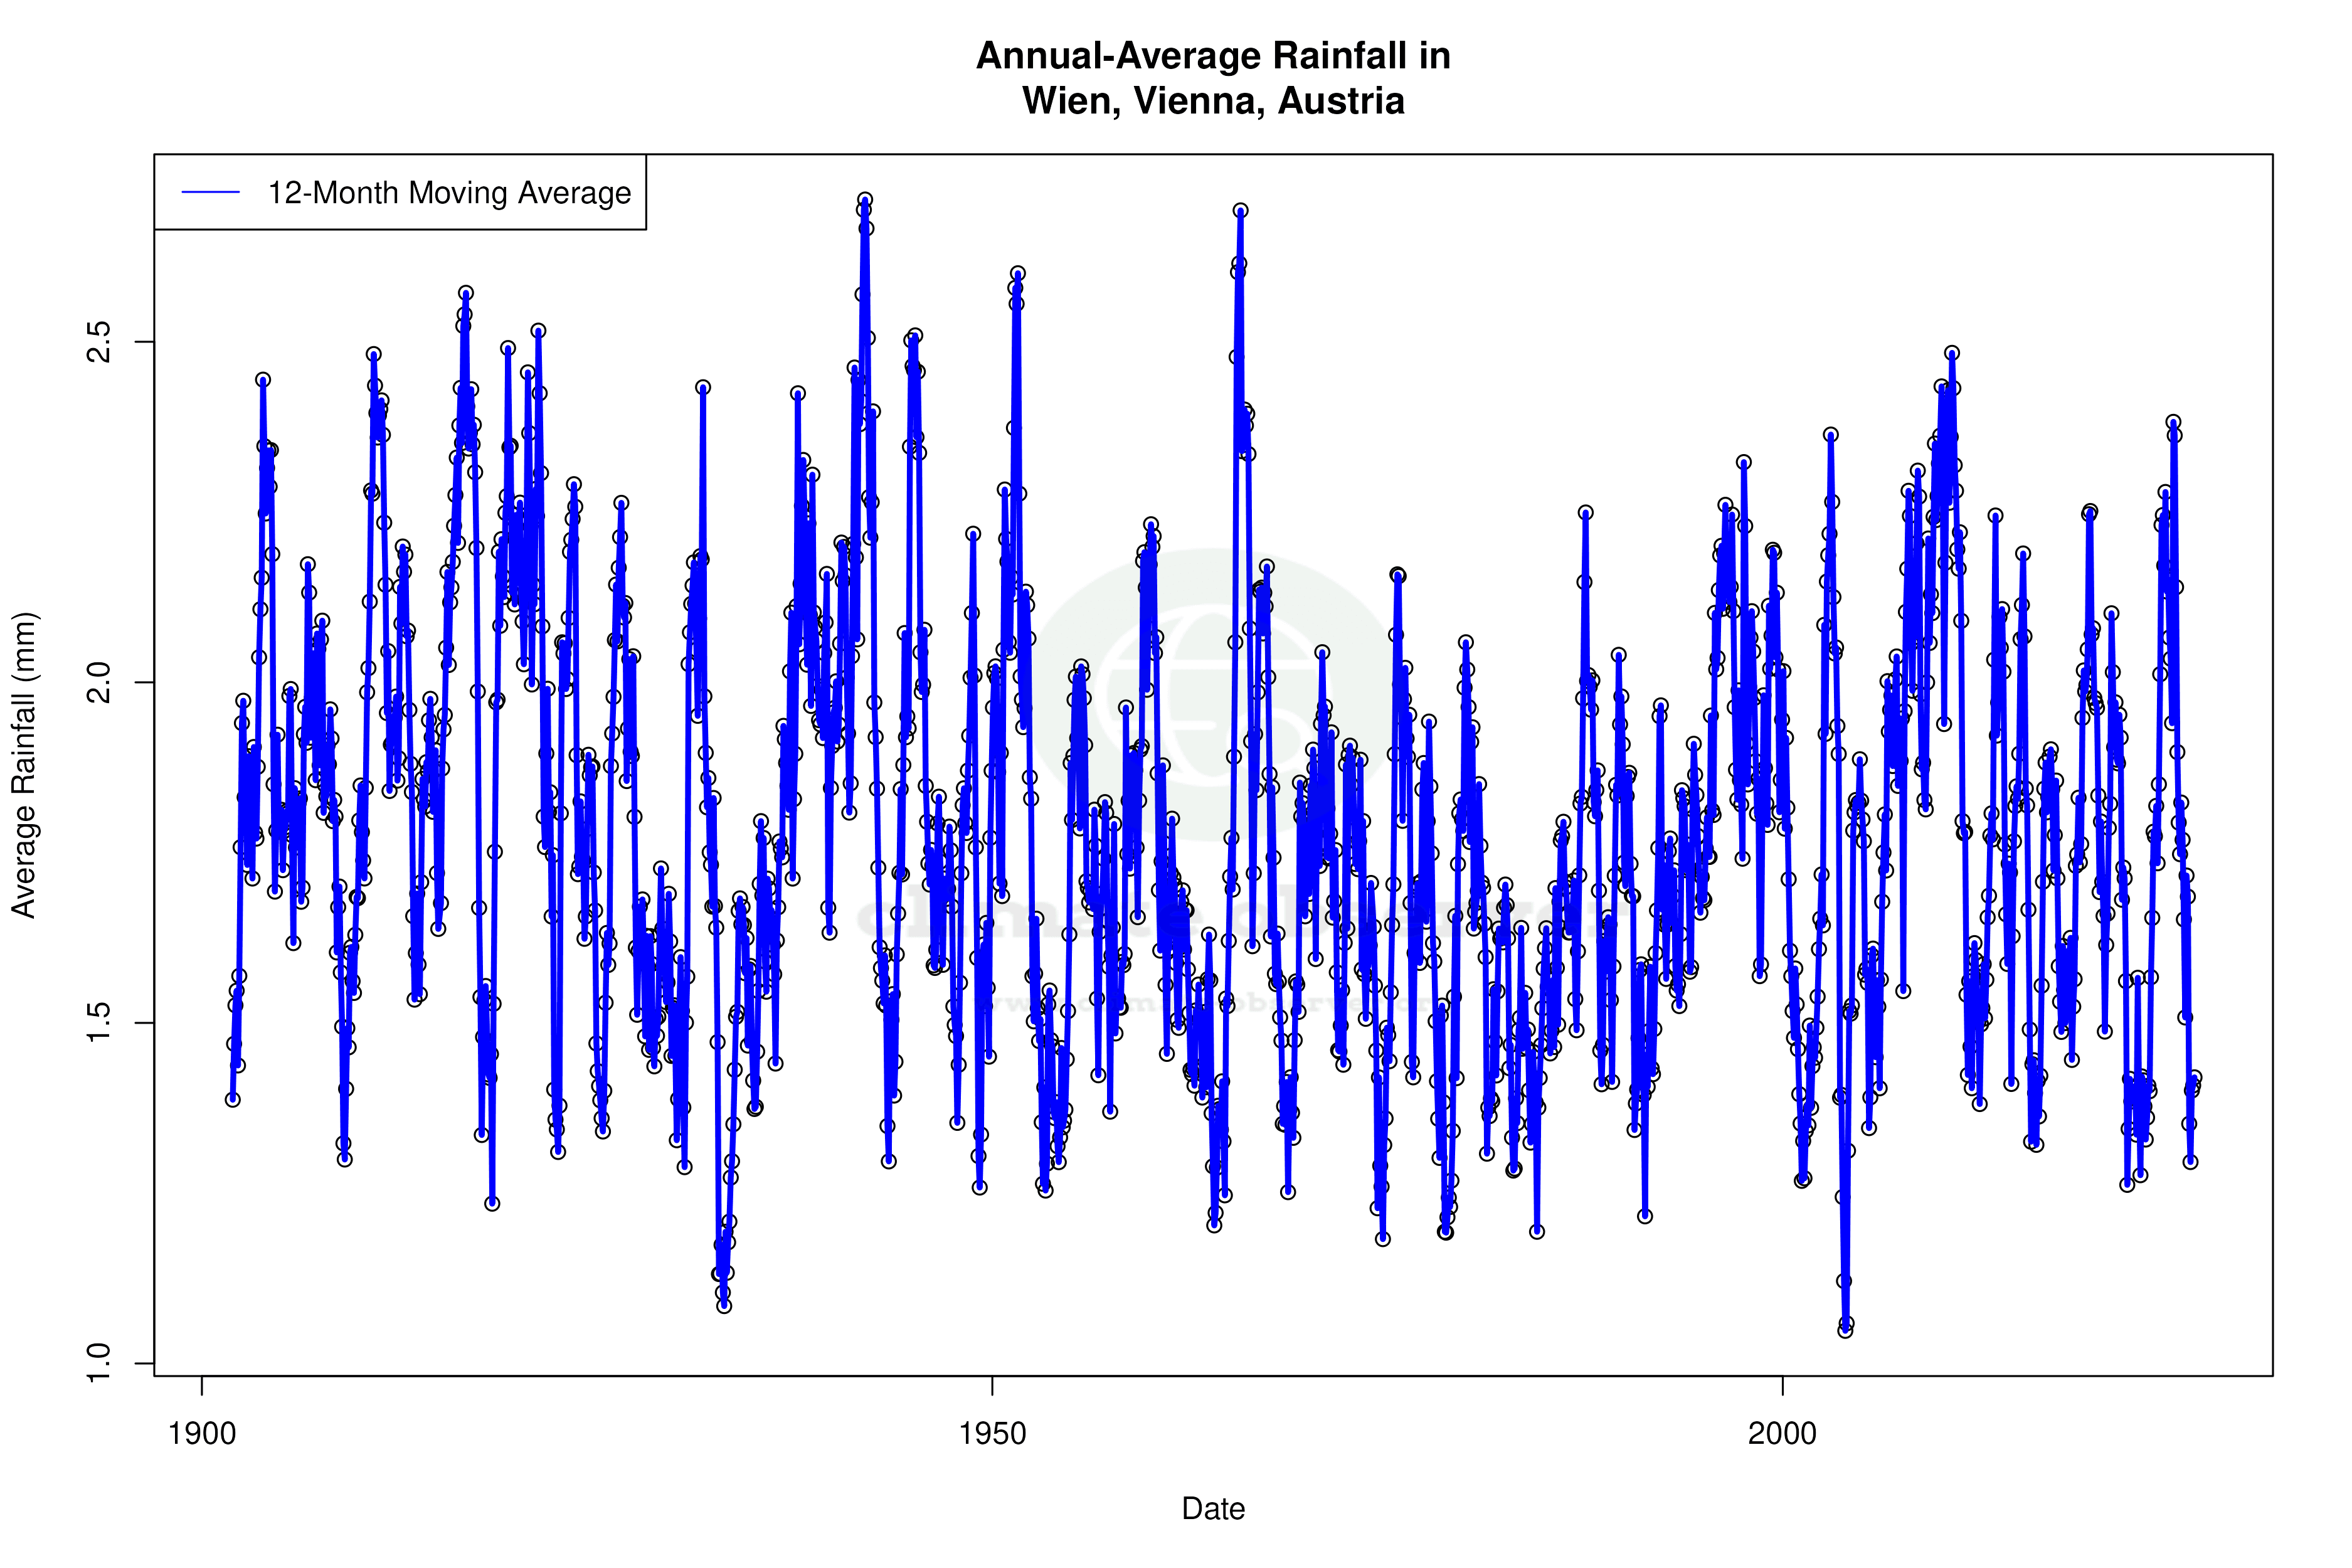


Max Temperature 12-Month MA | 1 of 6
Daily Data Points and Averages Throughout the Year
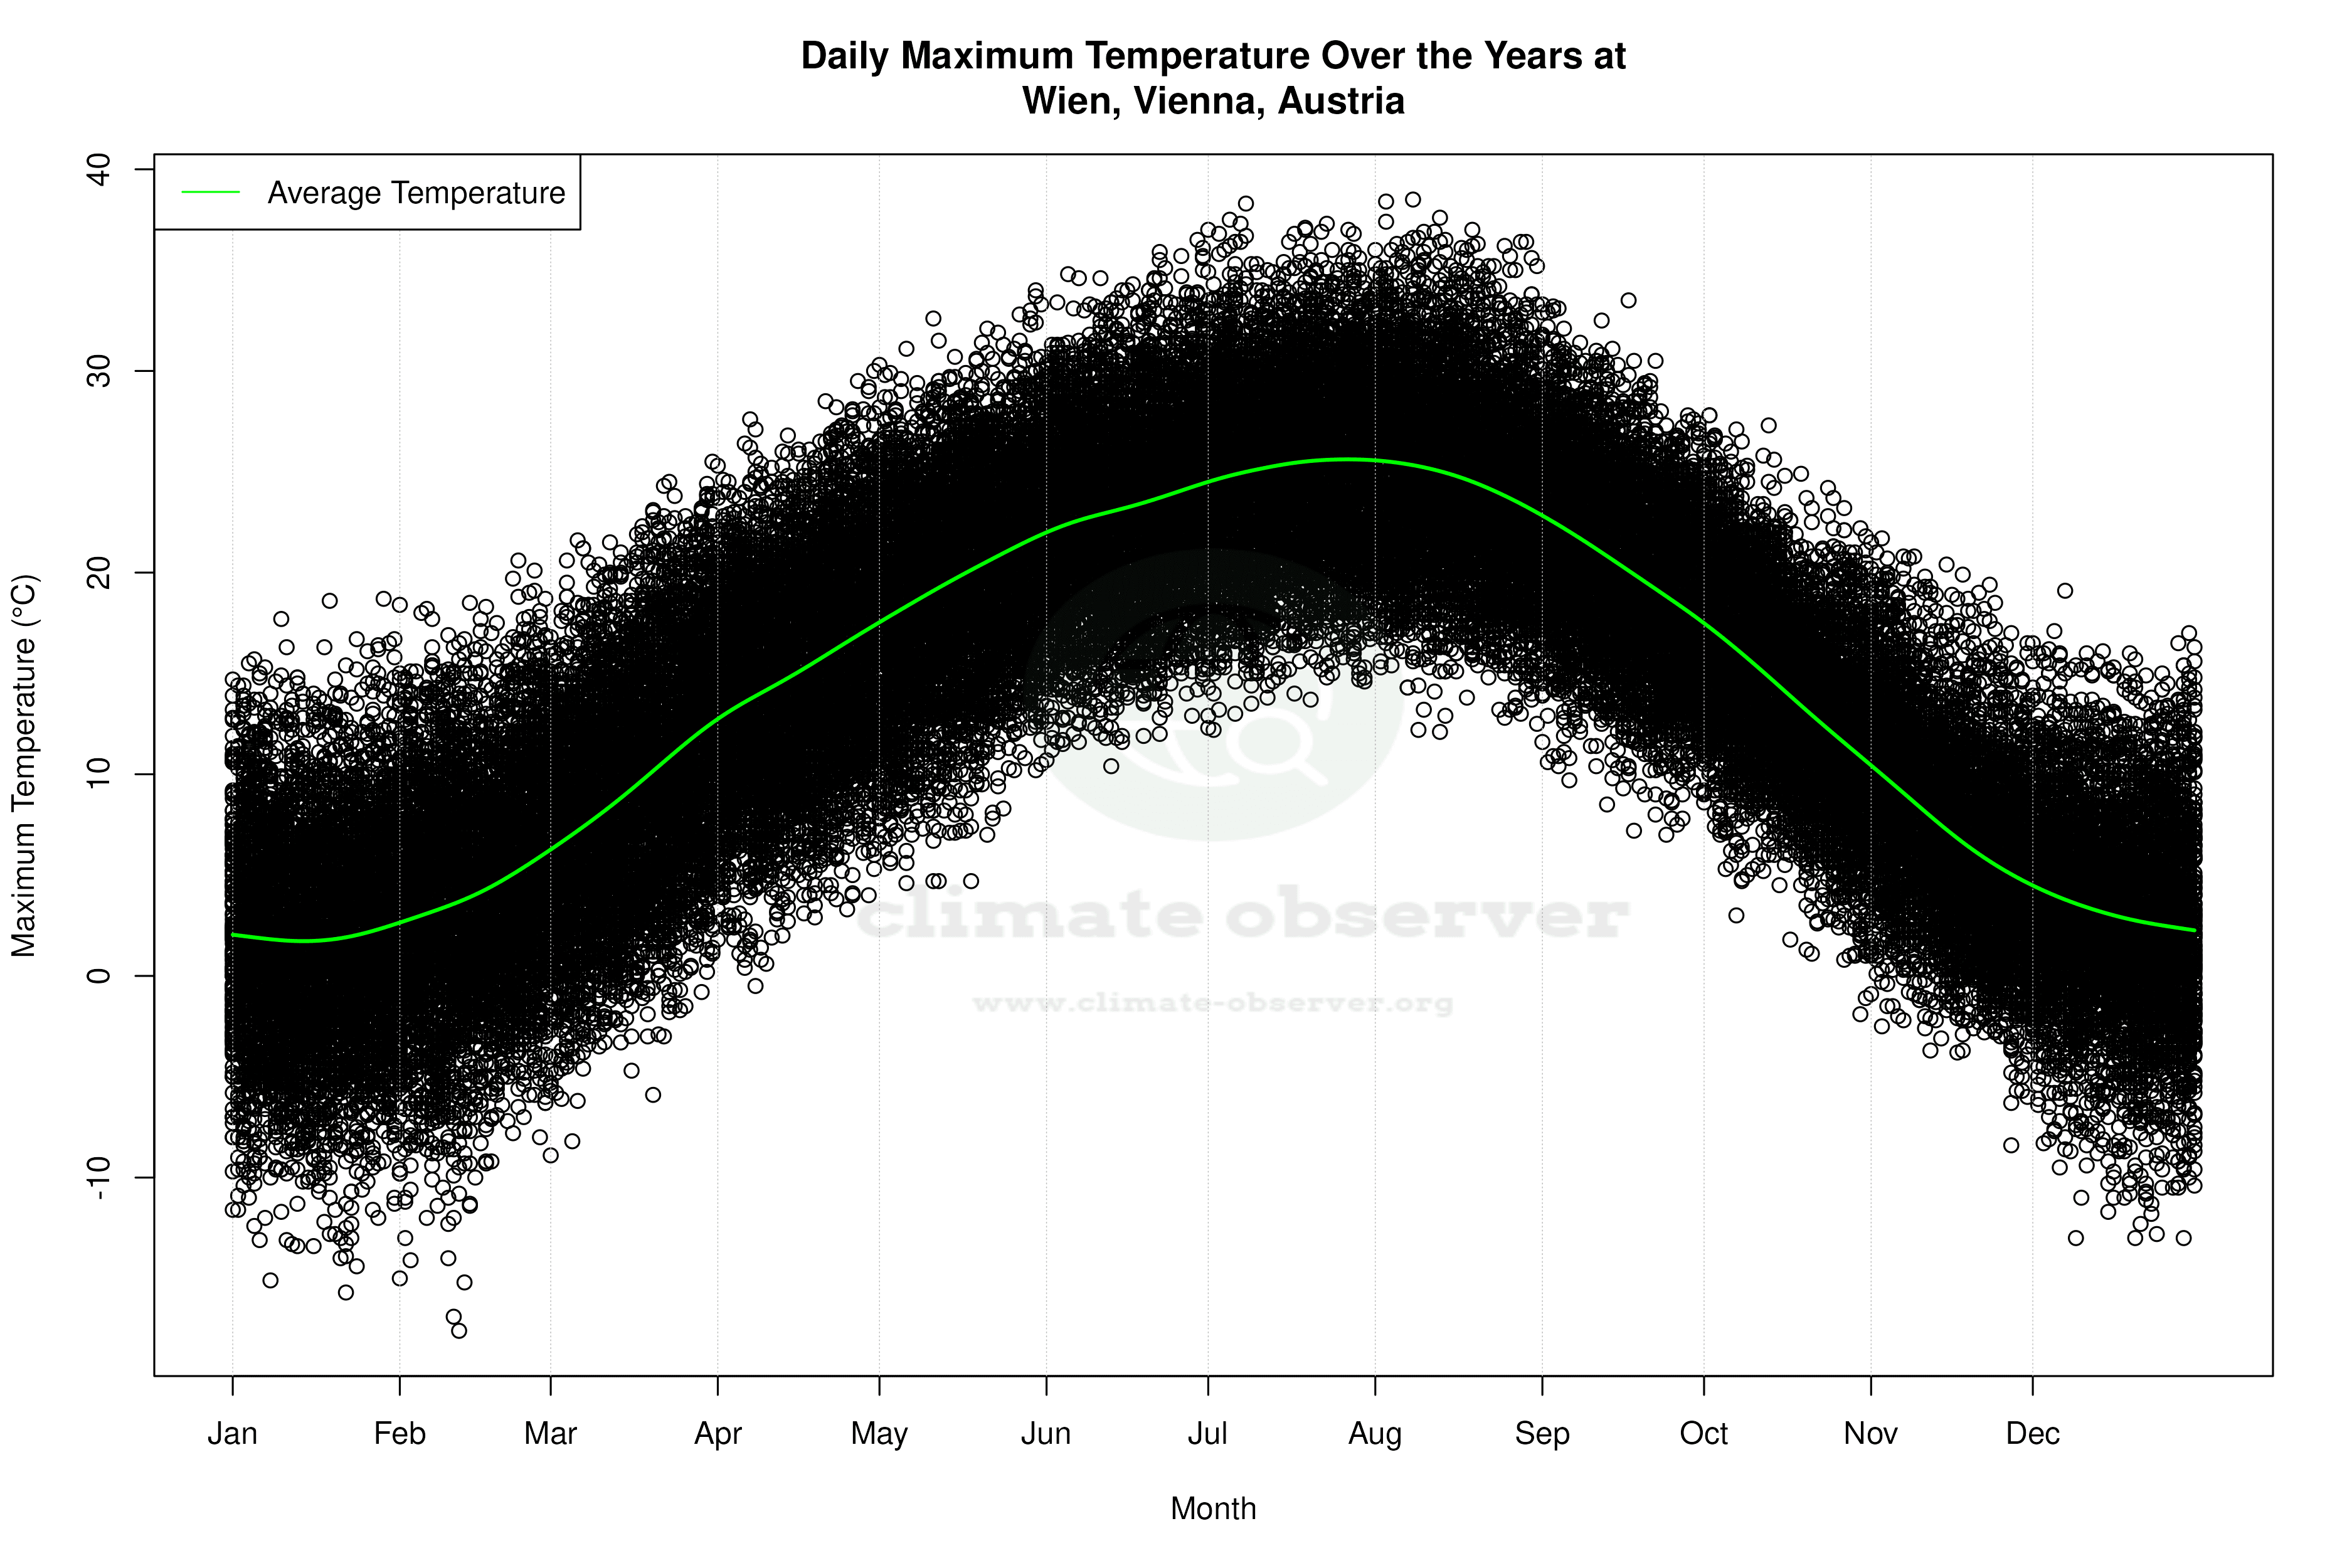

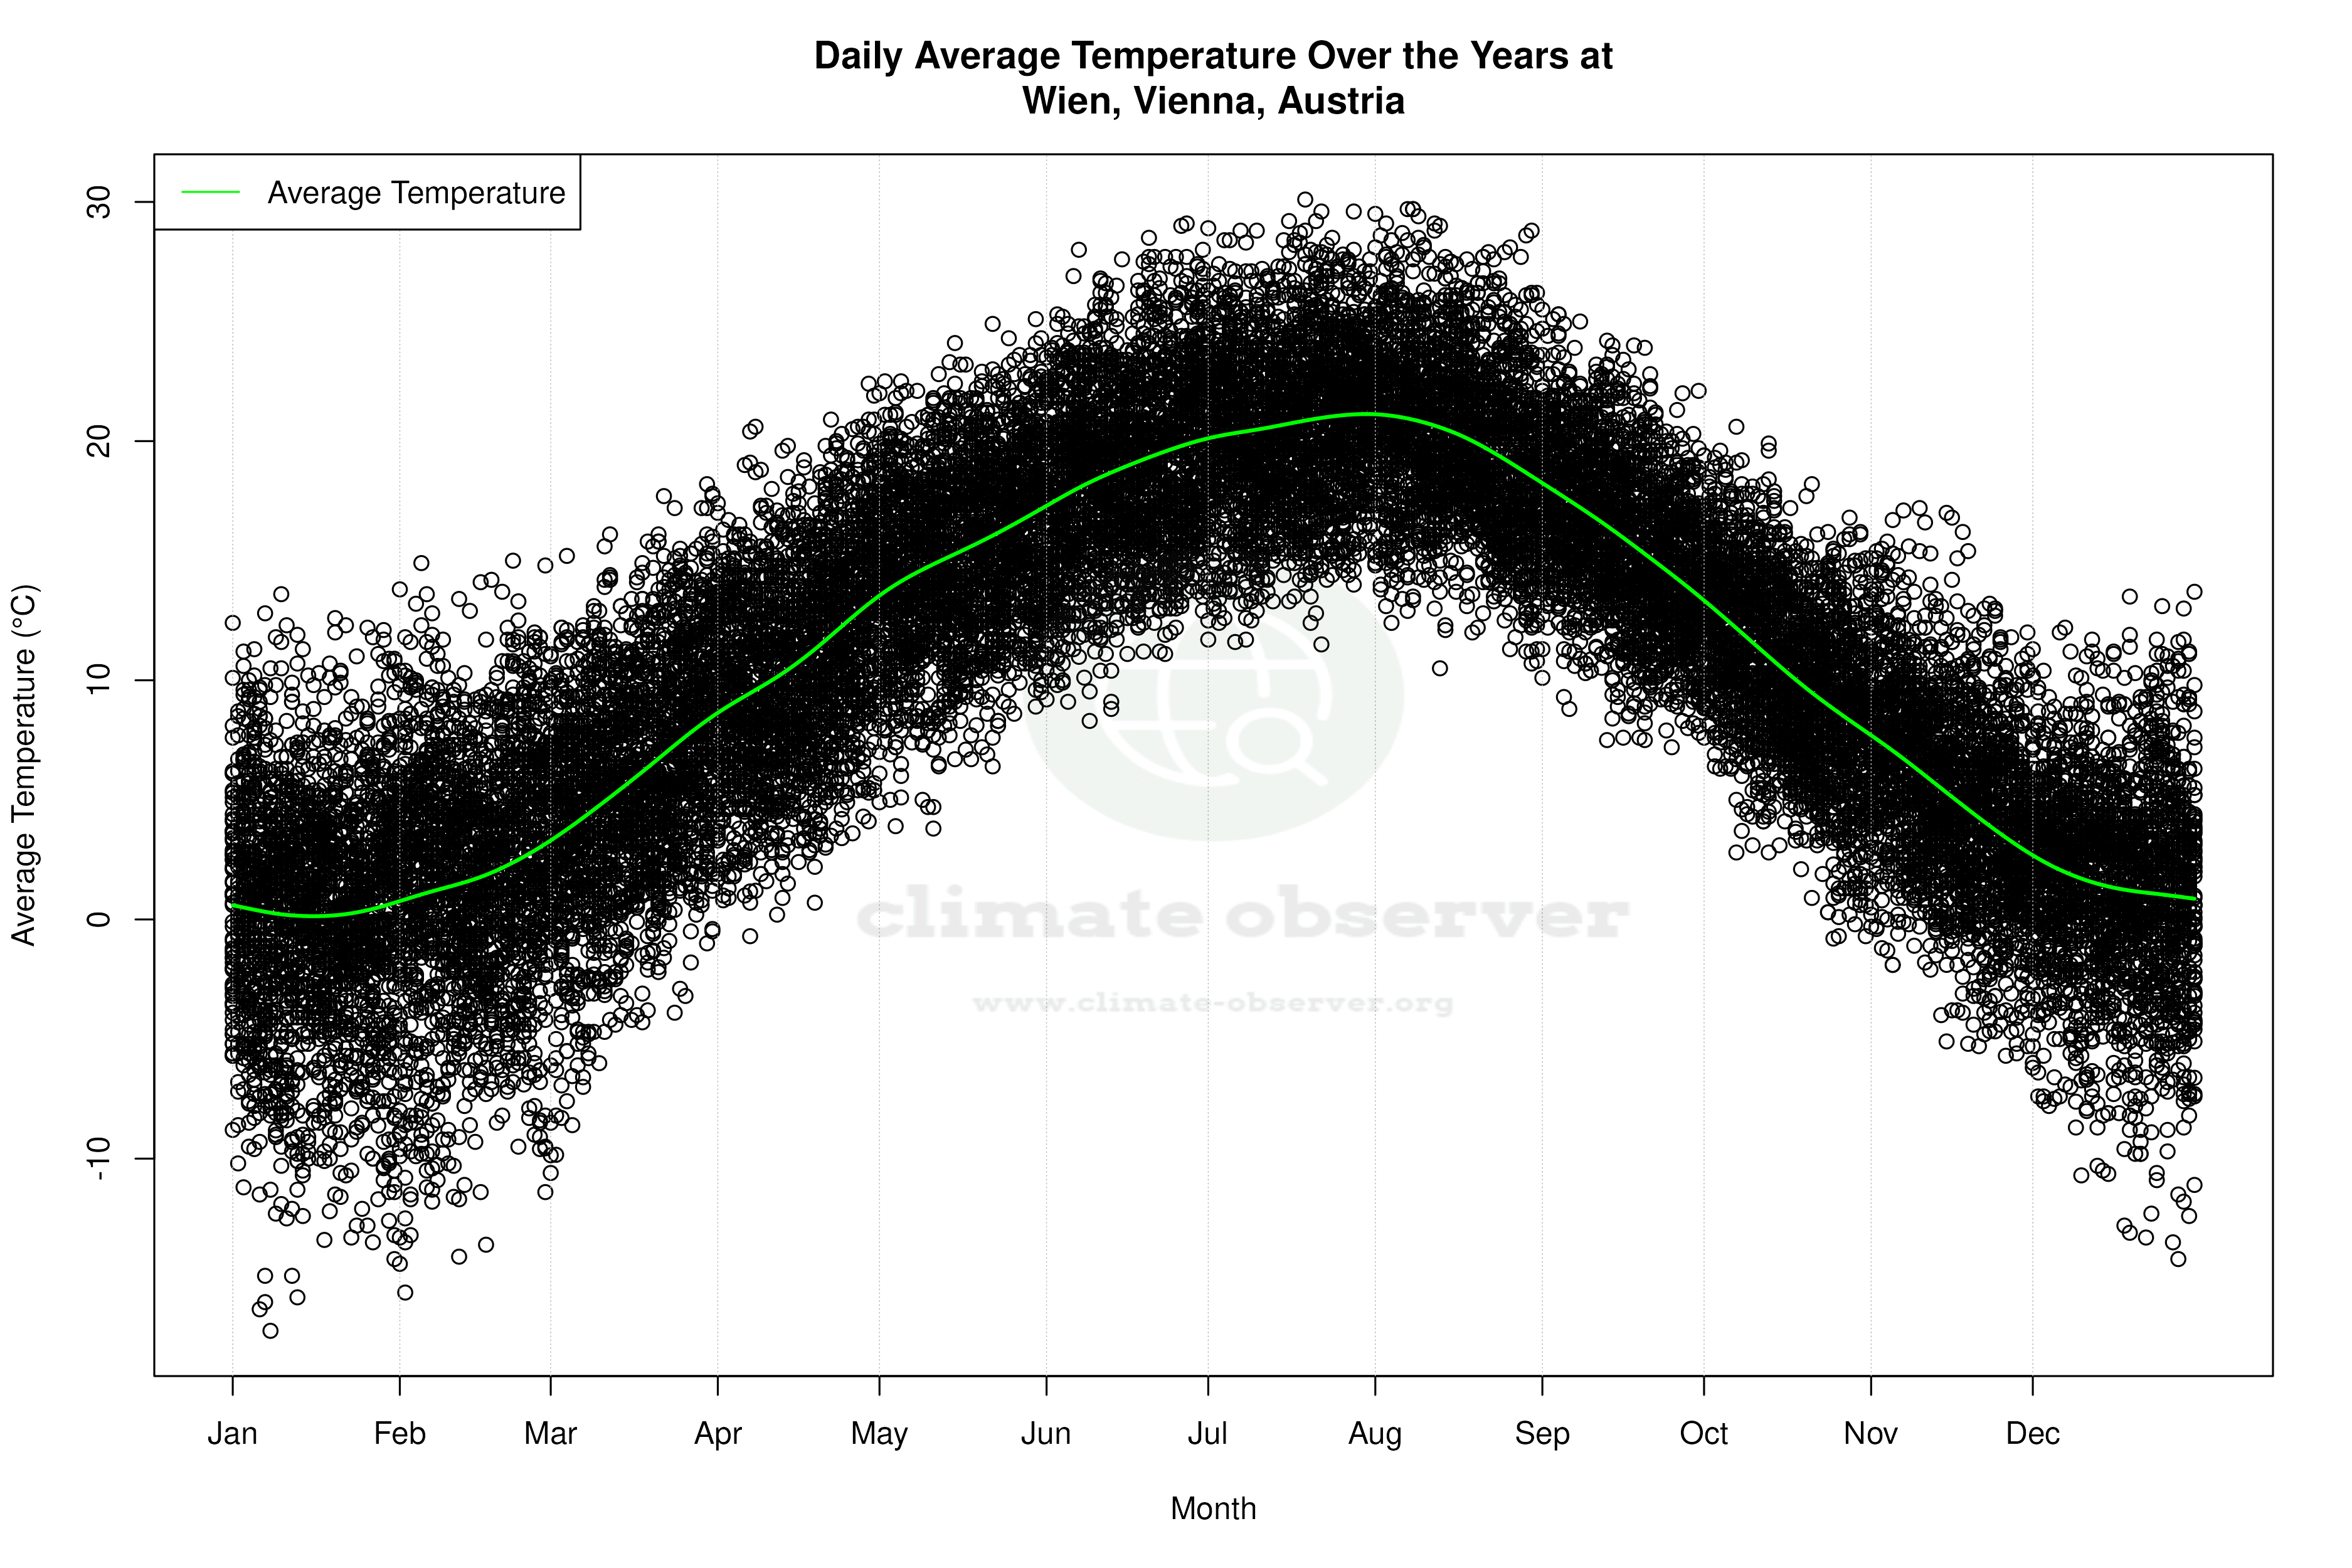


Average Max Temperature Throughout Year | 1 of 5
