Climate for Station: Graz, Styria, Austria
Loading live weather...
Climate Analysis & Overview
Graz, Austria, is experiencing a nuanced climate evolution marked by a slight long-term warming trend in high temperatures and a more pronounced cooling in lows over the last decade. Precipitation is becoming more evenly distributed, reflecting a shift in local weather patterns that could impact regional climate strategies.
Austrian Climate Dynamics
Situated in the southeastern region of Austria, Graz falls under the Köppen climate classification of Cfb, denoting a temperate oceanic climate. The city's location in the Mur Valley, surrounded by the eastern Alps, influences its weather patterns significantly. These geographical features contribute to the moderation of temperatures and precipitation, which are typical of the region.
Temperature Trends in Transition
Examining the temperature trends, Graz has experienced a long-term warming in high temperatures with an increase of 0.31°C (0.56°F). Conversely, the low temperatures have shown a smaller rise of 0.15°C (0.27°F) over the same period. In the past decade, however, a different pattern emerges: high temperatures have slightly cooled by 0.12°C (0.22°F), while low temperatures have seen a more substantial decrease of 1.38°C (2.48°F). These contrasting trends highlight the complexity of local climate dynamics and suggest potential influences from broader climatic shifts or regional factors.
Precipitation Patterns Evolving
The Precipitation Concentration Index (PCI) for Graz has decreased from a baseline of 12.14 to a current value of 10.21. This change indicates that precipitation is becoming more evenly distributed throughout the year. Such a shift could mean fewer extreme rainfall events and a more consistent water supply, which is beneficial for agriculture and water management in the region. The PCI value under 10 suggests a very even distribution, indicating a positive trend towards more stable precipitation patterns.
Extreme Weather Records
Graz's historical weather records reveal a maximum temperature of 38.1°C (100.6°F) and a minimum of -23.7°C (-10.7°F). These extremes underscore the city's capacity for significant temperature variability, influenced by its geographical setting and climatic conditions. Such variability is crucial for understanding potential impacts on local ecosystems and urban infrastructure.
Implications for Regional Climate Goals
Austria's commitment to reducing greenhouse gas emissions and enhancing climate resilience is set against this backdrop of evolving climate dynamics in Graz. The city's trends in temperature and precipitation distribution offer insights into the effectiveness of these strategies and highlight areas for potential adaptation. As the climate continues to shift, monitoring these changes will be vital for aligning regional goals with on-the-ground realities.
Station Statistics
10-Year Trend
High: -0.15 °F/decade
Low: -2.36 °F/decade
Rain: +0.006 in/decade
25-Year Trend
High: +1.53 °F/decade
Low: +0.59 °F/decade
Rain: +0.002 in/decade
50-Year Trend
High: +1.08 °F/decade
Low: +0.58 °F/decade
Rain: +0.001 in/decade
All-Time Trend
High: +0.50 °F/decade
Low: +0.23 °F/decade
Rain: -0.001 in/decade
Percentage Above-Average Days
Last 12 Months: 53.9%
This Year: 56.4%
Precipitation Concentration Index (PCI) ℹ️
Last 12 Months: 12.5
Historical Average: 12.7
Percentile Rank of Last 12 Months ℹ️
High: 83rd percentile
Low: 57th percentile
Rain: 19th percentile
Change in Variance ℹ️
High: -0.8%
Low: +5.8%
Intraday: +12.6%
Data Coverage
85.7%
First Year of Data
1894
Station Location
Historical Weather Records
| Max High | Avg High | Min High | Max Avg | Avg Avg | Min Avg | Max Low | Avg Low | Min Low | Max Precipitation | Avg Precipitation | Max Snow | Avg Snow | |
|---|---|---|---|---|---|---|---|---|---|---|---|---|---|
| Record | 100.58 °F | — | 3.38 °F | 83.12 °F | — | -0.76 °F | 72.14 °F | — | -10.66 °F | 4.13 in | — | — | — |
| January | 69.80 °F | 35.75 °F | 6.80 °F | 49.10 °F | 28.63 °F | -0.76 °F | 44.78 °F | 24.04 °F | -10.66 °F | 1.35 in | 0.03 in | — | — |
| February | 73.04 °F | 40.91 °F | 3.38 °F | 57.02 °F | 32.53 °F | 1.76 °F | 50.00 °F | 26.64 °F | -6.88 °F | 1.62 in | 0.04 in | — | — |
| March | 77.18 °F | 50.10 °F | 21.02 °F | 60.62 °F | 40.86 °F | 2.66 °F | 53.24 °F | 33.23 °F | 1.04 °F | 3.16 in | 0.05 in | — | — |
| April | 84.56 °F | 59.21 °F | 34.88 °F | 67.28 °F | 49.79 °F | 30.92 °F | 61.52 °F | 40.86 °F | 22.10 °F | 1.85 in | 0.07 in | — | — |
| May | 93.38 °F | 67.63 °F | 39.92 °F | 78.08 °F | 58.34 °F | 36.14 °F | 65.30 °F | 48.89 °F | 29.48 °F | 2.31 in | 0.11 in | — | — |
| June | 98.96 °F | 73.84 °F | 51.62 °F | 81.50 °F | 64.88 °F | 46.94 °F | 71.78 °F | 55.01 °F | 34.52 °F | 3.54 in | 0.16 in | — | — |
| July | 100.58 °F | 77.16 °F | 52.88 °F | 83.12 °F | 67.64 °F | 49.46 °F | 72.14 °F | 58.04 °F | 40.46 °F | 4.13 in | 0.16 in | — | — |
| August | 100.58 °F | 75.70 °F | 56.30 °F | 82.76 °F | 66.45 °F | 51.08 °F | 72.14 °F | 57.04 °F | 39.38 °F | 3.24 in | 0.15 in | — | — |
| September | 91.22 °F | 68.17 °F | 44.78 °F | 74.66 °F | 59.05 °F | 41.36 °F | 66.02 °F | 50.99 °F | 31.46 °F | 2.74 in | 0.12 in | — | — |
| October | 80.96 °F | 57.94 °F | 28.04 °F | 66.56 °F | 49.47 °F | 28.22 °F | 60.98 °F | 42.73 °F | 14.72 °F | 2.88 in | 0.09 in | — | — |
| November | 73.40 °F | 45.75 °F | 23.36 °F | 64.94 °F | 38.97 °F | 11.12 °F | 56.48 °F | 34.51 °F | 7.52 °F | 1.95 in | 0.07 in | — | — |
| December | 66.56 °F | 37.40 °F | 10.58 °F | 57.74 °F | 30.63 °F | 3.02 °F | 47.30 °F | 27.25 °F | -3.46 °F | 1.39 in | 0.05 in | — | — |
Data Visualisations
Remove WatermarksCurrent Year Climate Trends vs Historical


Max Temperature this Year | 1 of 6
Climate 12-Month Moving Averages


Max Temperature 12-Month MA | 1 of 6
Daily Data Points and Averages Throughout the Year


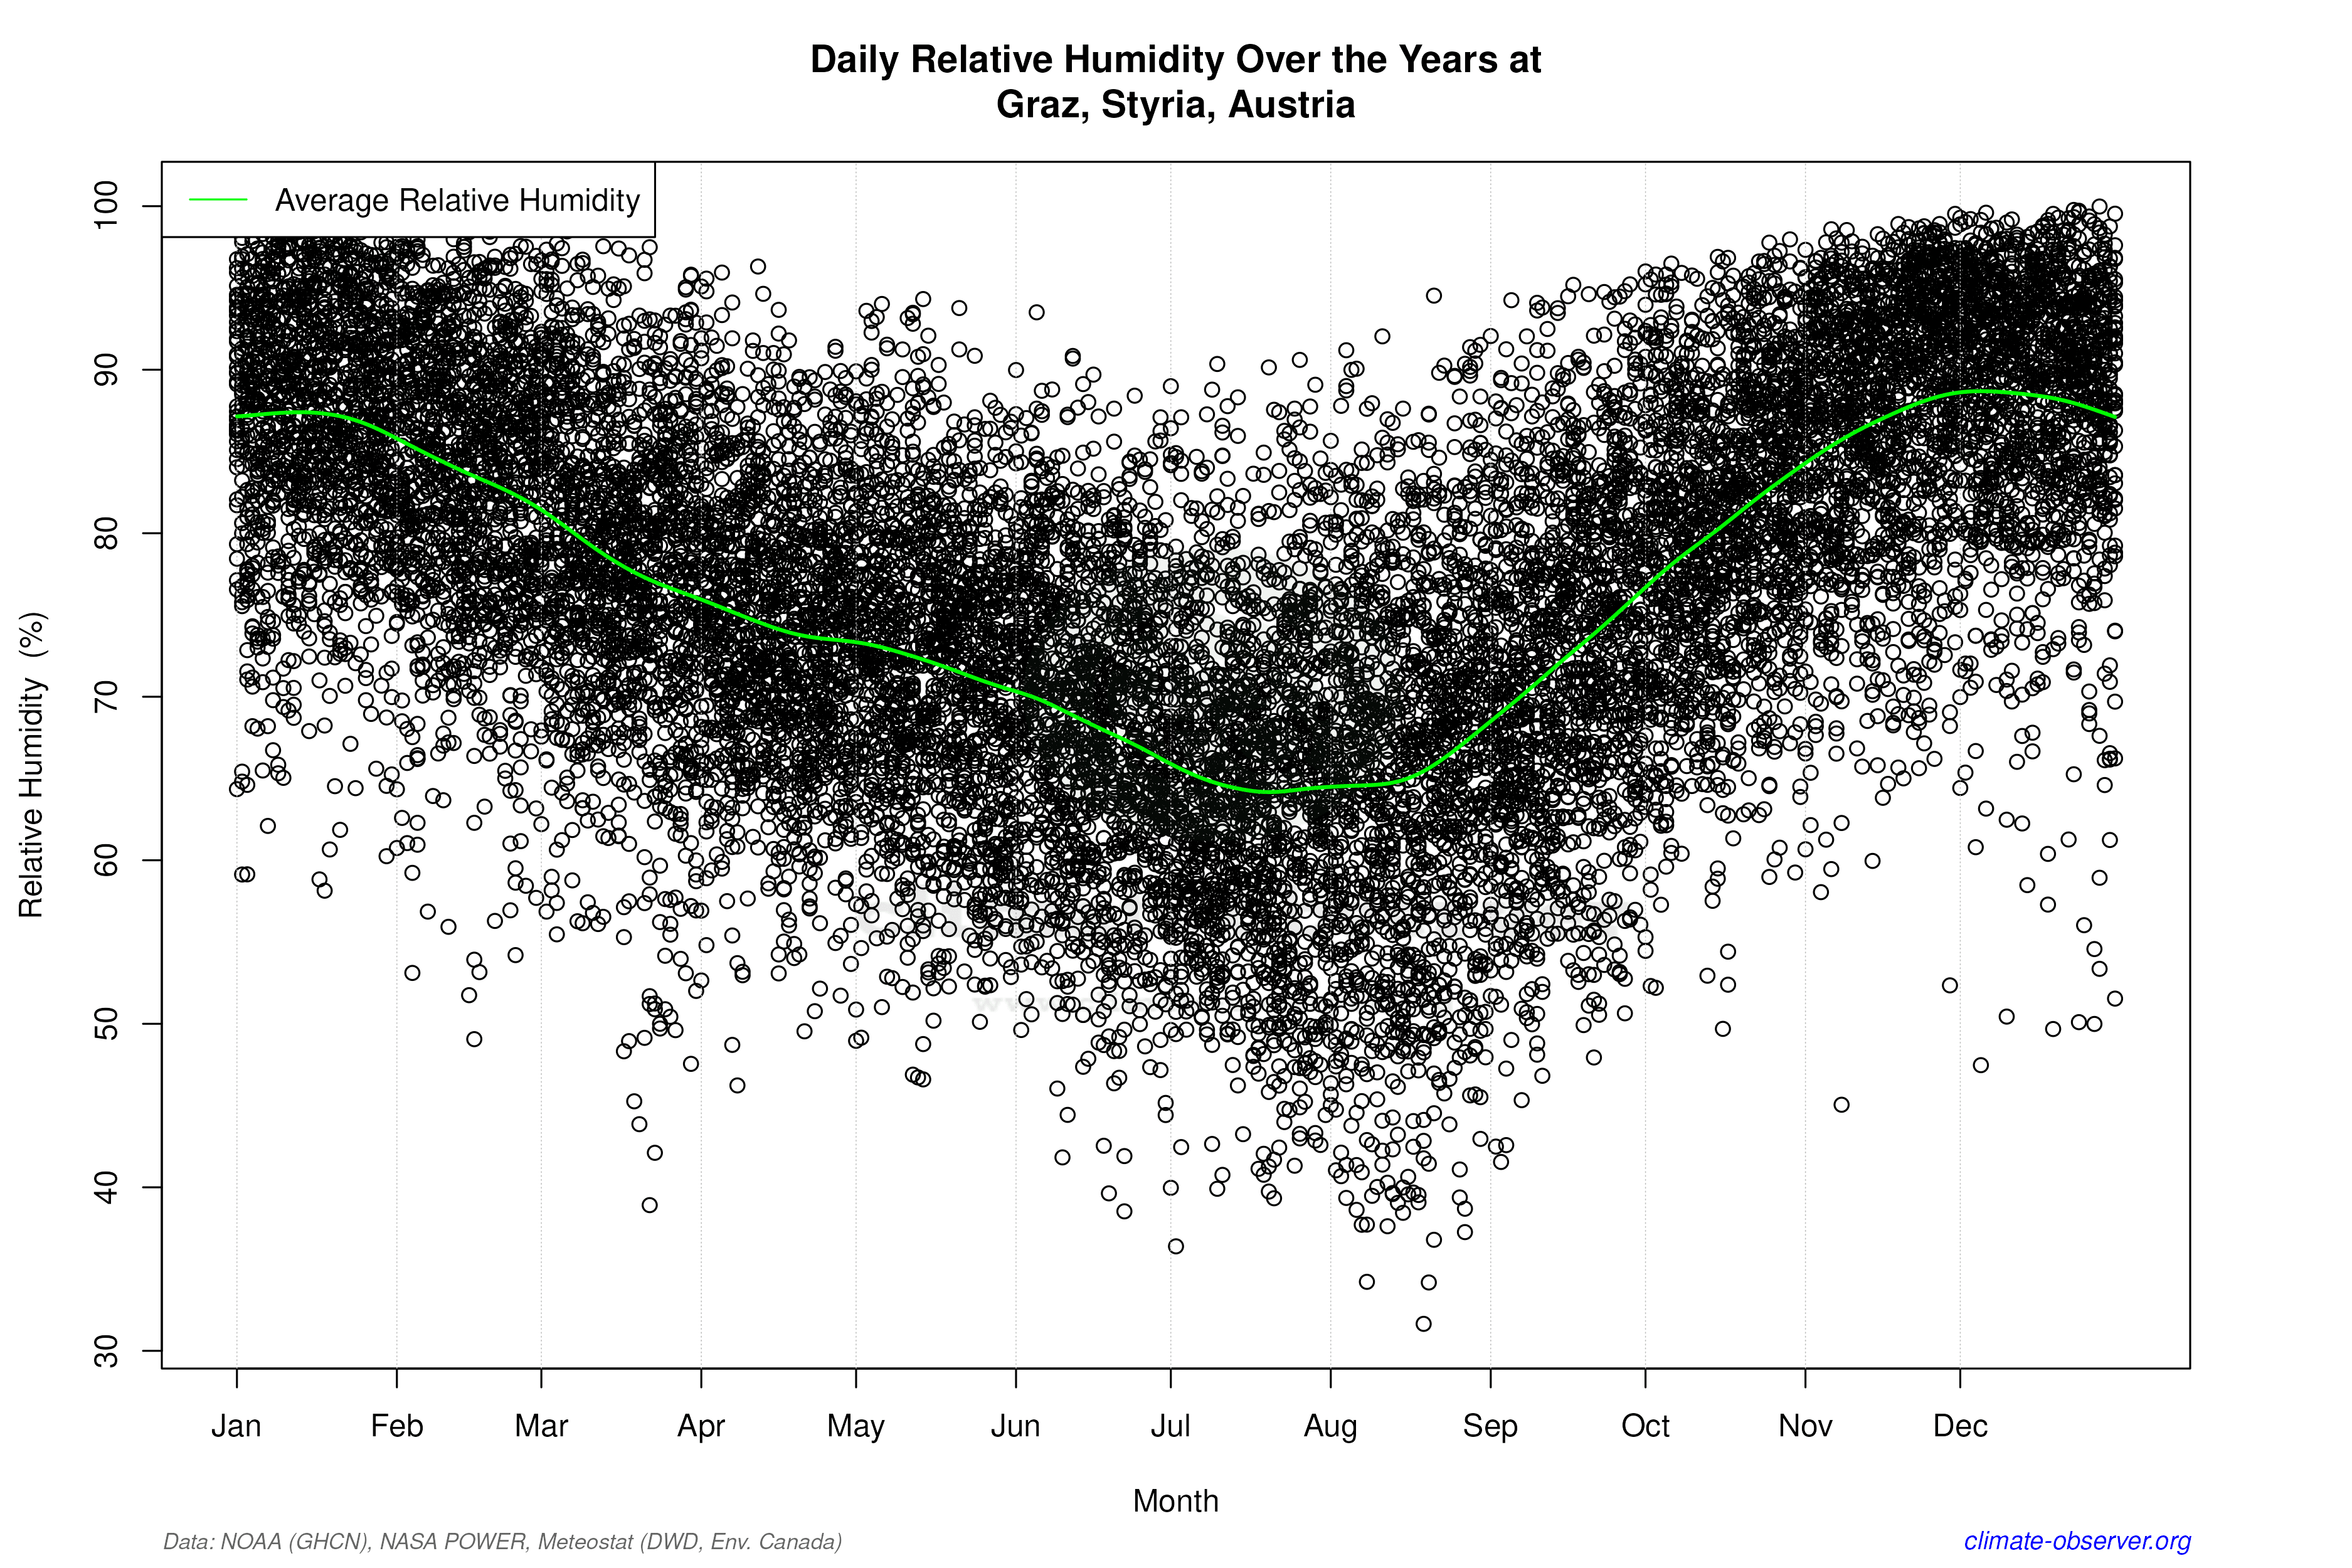

Average Max Temperature Throughout Year | 1 of 5
