Climate for Station: Base Esperanza, Antarctica
Loading live weather...
Climate Analysis & Overview
Base Esperanza is experiencing a warming trend with significant increases in both high and low temperatures over the past decade. The precipitation pattern has become more evenly distributed, indicating a shift in local climate dynamics. These changes align with broader regional climate goals in Antarctica aimed at understanding and adapting to climate variability.
Antarctic Climate Dynamics
Base Esperanza, located at the northern tip of the Antarctic Peninsula, falls under the polar tundra climate classification (ET) according to the Köppen system. This classification is characterised by cold temperatures and limited vegetation. The station's geographical position, surrounded by the Southern Ocean and influenced by the Antarctic Circumpolar Current, plays a crucial role in its climatic conditions. The all-time warming trend shows an increase in high temperatures by 0.33°C (0.59°F) and low temperatures by 0.33°C (0.59°F), indicating a consistent warming pattern over the years.
Decadal Temperature Shifts
In the last decade, Base Esperanza has experienced a pronounced warming trend, with high temperatures rising by 0.25°C (0.45°F) and low temperatures by 1.05°C (1.89°F). This disparity between high and low temperature trends suggests a more significant warming during the colder months, which could impact local ecosystems and ice melt patterns. Such changes are crucial for understanding the broader implications of climate change in polar regions.
Precipitation Patterns and Distribution
The Precipitation Concentration Index (PCI) at Base Esperanza has decreased from a baseline of 10.28 to 8.46, indicating a more even distribution of precipitation events over time. This shift suggests that precipitation is now spread more uniformly throughout the year, rather than being concentrated in fewer, more intense events. Such a change can affect local hydrology and the availability of freshwater resources, which are critical for both human and ecological systems in this remote region.
Temperature Extremes and Records
The station has recorded an absolute maximum temperature of 18.4°C (65.1°F) and a minimum of -38.4°C (-37.1°F). These extremes highlight the variability and harshness of the Antarctic climate. Understanding these records is vital for preparing for potential future extremes as climate patterns continue to evolve.
Regional Climate Goals and Adaptation
The observed climatic changes at Base Esperanza are part of a broader effort to monitor and adapt to climate variability in Antarctica. Recent initiatives focus on enhancing the understanding of regional climate dynamics and developing strategies to mitigate the impacts of warming temperatures and changing precipitation patterns. These efforts are crucial for ensuring the resilience of both human and natural systems in one of the most sensitive regions on Earth.
Station Statistics
10-Year Trend
High: -0.29 °F/decade
Low: +2.30 °F/decade
Rain: +0.058 in/decade
25-Year Trend
High: +0.95 °F/decade
Low: +0.62 °F/decade
Rain: -0.259 in/decade
50-Year Trend
High: +0.44 °F/decade
Low: +0.50 °F/decade
Rain: -0.022 in/decade
All-Time Trend
High: +0.59 °F/decade
Low: +0.61 °F/decade
Rain: -0.022 in/decade
Percentage Above-Average Days
Last 12 Months: 60.0%
This Year: 31.7%
Precipitation Concentration Index (PCI) ℹ️
Last 12 Months: 11.2
Historical Average: 12.7
Percentile Rank of Last 12 Months ℹ️
High: 67th percentile
Low: 99th percentile
Rain: 70th percentile
Change in Variance ℹ️
High: -30.1%
Low: -11.4%
Intraday: +10.7%
Data Coverage
84.3%
First Year of Data
1961
Station Location
Historical Weather Records
| Max High | Avg High | Min High | Max Avg | Avg Avg | Min Avg | Max Low | Avg Low | Min Low | Max Precipitation | Avg Precipitation | Max Snow | Avg Snow | |
|---|---|---|---|---|---|---|---|---|---|---|---|---|---|
| Record | 65.12 °F | — | -19.66 °F | 58.46 °F | — | -24.52 °F | 42.98 °F | — | -37.12 °F | 5.94 in | — | — | — |
| January | 58.64 °F | 38.41 °F | 25.70 °F | 49.64 °F | 34.24 °F | 23.54 °F | 42.44 °F | 29.65 °F | 16.70 °F | 4.09 in | 0.17 in | — | — |
| February | 65.12 °F | 37.49 °F | 19.40 °F | 48.74 °F | 33.28 °F | 15.80 °F | 42.98 °F | 27.95 °F | 8.24 °F | 1.81 in | 0.07 in | — | — |
| March | 64.40 °F | 34.07 °F | 6.08 °F | 49.10 °F | 28.68 °F | -0.58 °F | 40.28 °F | 22.26 °F | -5.62 °F | 2.56 in | 0.09 in | — | — |
| April | 62.78 °F | 28.32 °F | -5.98 °F | 45.86 °F | 22.41 °F | -8.32 °F | 42.26 °F | 14.90 °F | -14.80 °F | 5.94 in | 0.18 in | — | — |
| May | 62.96 °F | 24.92 °F | -14.44 °F | 58.46 °F | 18.62 °F | -18.04 °F | 40.28 °F | 10.70 °F | -21.28 °F | 5.51 in | 0.20 in | — | — |
| June | 55.94 °F | 21.32 °F | -19.66 °F | 44.06 °F | 14.57 °F | -21.69 °F | 34.16 °F | 6.54 °F | -23.13 °F | 4.06 in | 0.17 in | — | — |
| July | 57.20 °F | 21.00 °F | -19.30 °F | 43.34 °F | 13.51 °F | -24.52 °F | 35.78 °F | 5.43 °F | -37.12 °F | 3.94 in | 0.19 in | — | — |
| August | 55.40 °F | 22.46 °F | -19.12 °F | 43.70 °F | 15.17 °F | -18.76 °F | 36.86 °F | 6.78 °F | -23.98 °F | 4.02 in | 0.20 in | — | — |
| September | 52.52 °F | 27.27 °F | -10.30 °F | 44.24 °F | 19.92 °F | -11.56 °F | 37.94 °F | 12.34 °F | -26.68 °F | 5.91 in | 0.27 in | — | — |
| October | 62.60 °F | 31.85 °F | -2.92 °F | 52.16 °F | 24.77 °F | -5.44 °F | 41.36 °F | 18.45 °F | -9.76 °F | 4.76 in | 0.32 in | — | — |
| November | 57.74 °F | 34.91 °F | 9.32 °F | 50.36 °F | 29.92 °F | 5.36 °F | 40.10 °F | 24.62 °F | -0.04 °F | 4.33 in | 0.32 in | — | — |
| December | 58.28 °F | 37.77 °F | 23.00 °F | 51.08 °F | 33.41 °F | 20.66 °F | 41.72 °F | 28.63 °F | 12.20 °F | 4.21 in | 0.34 in | — | — |
Data Visualisations
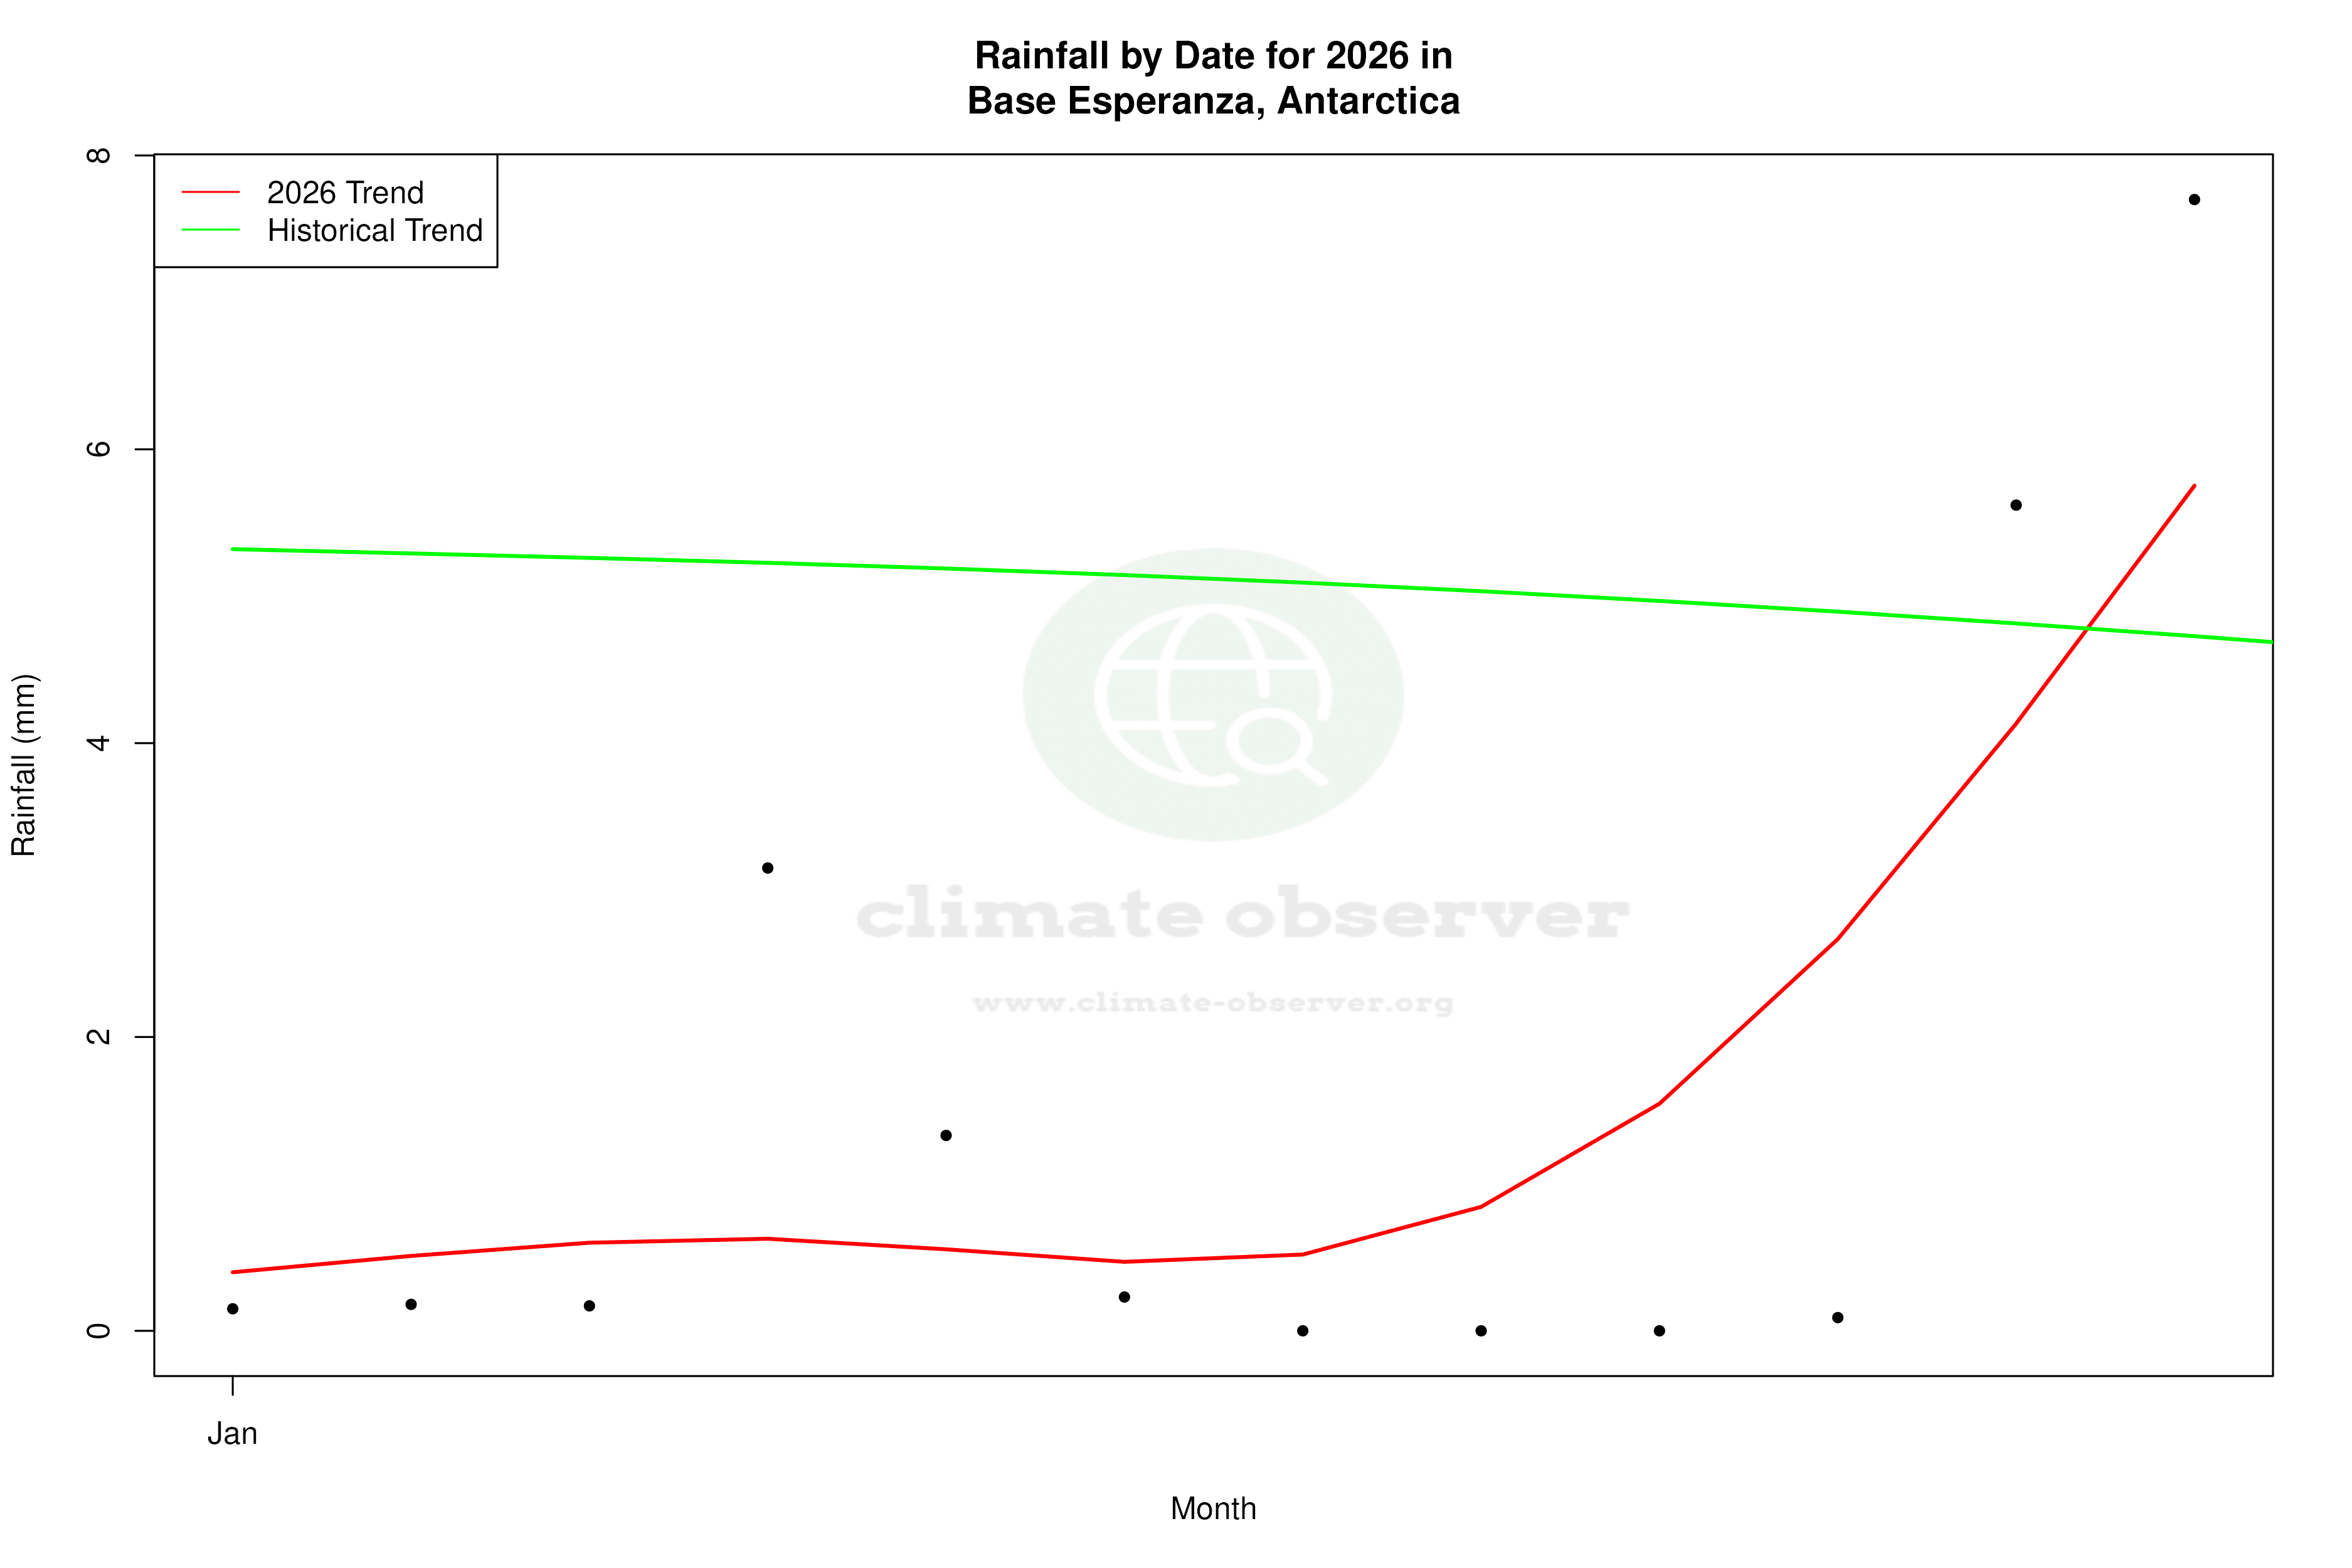
Remove WatermarksCurrent Year Climate Trends vs Historical
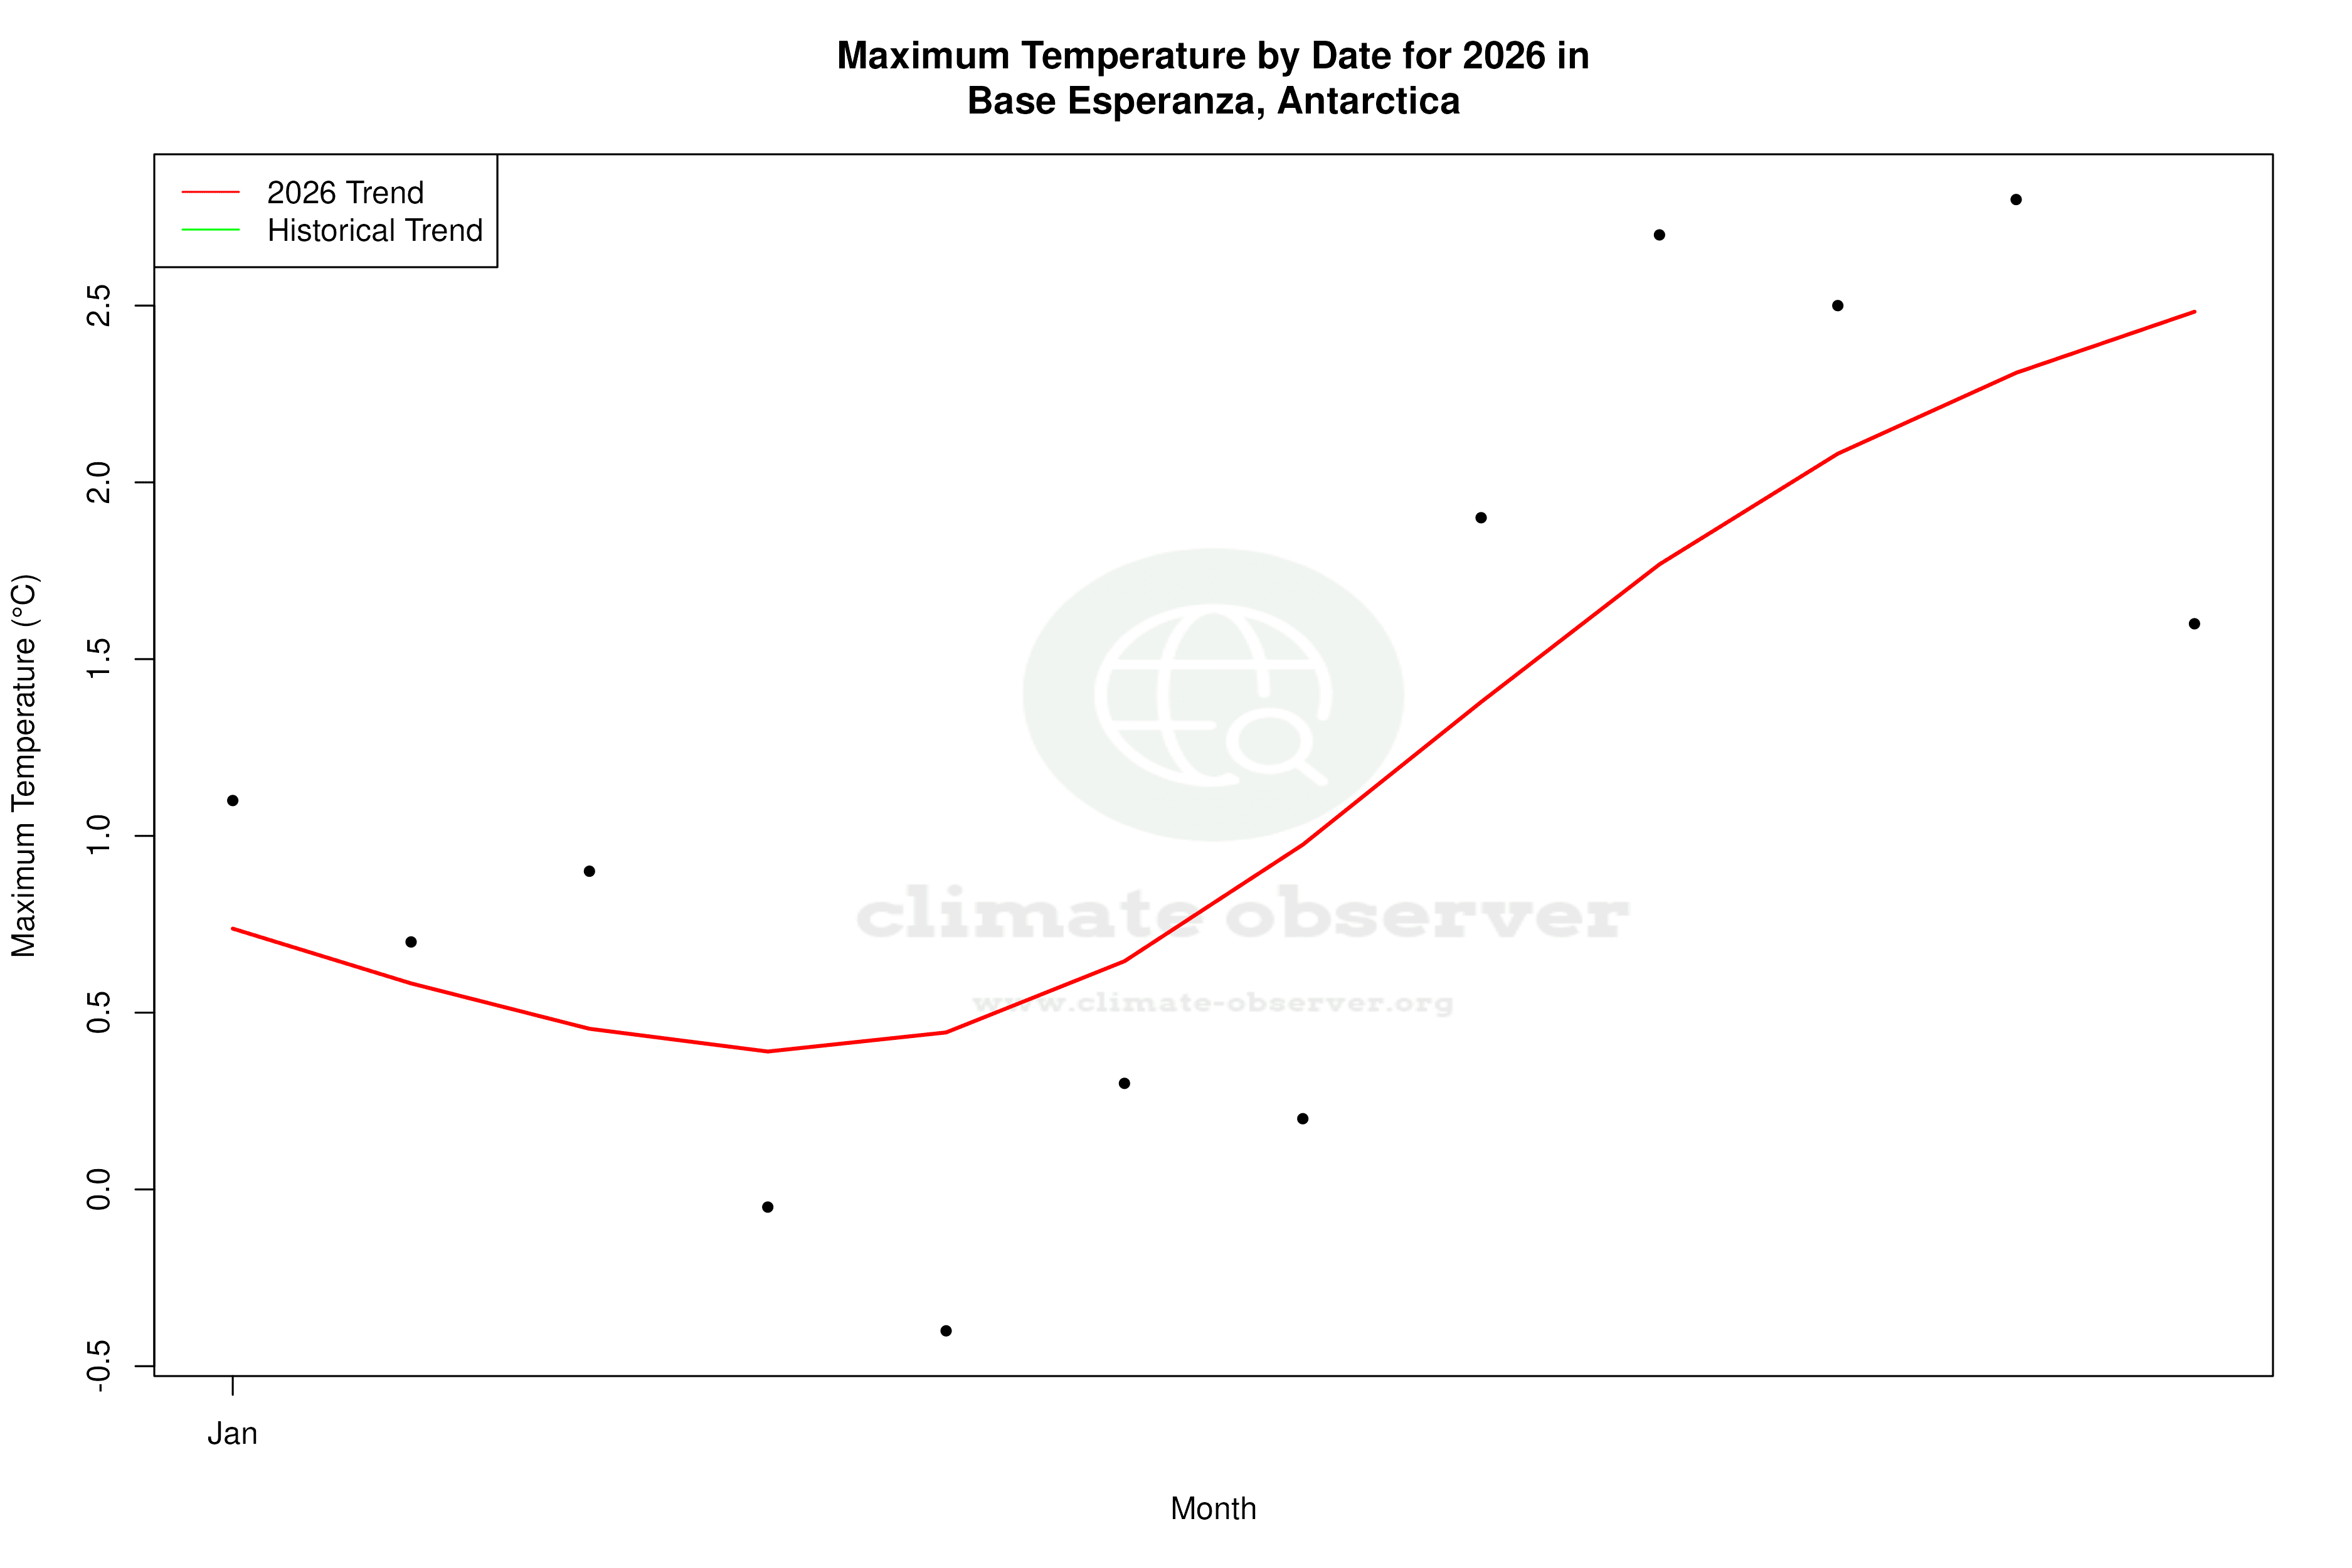


Max Temperature this Year | 1 of 6
Climate 12-Month Moving Averages


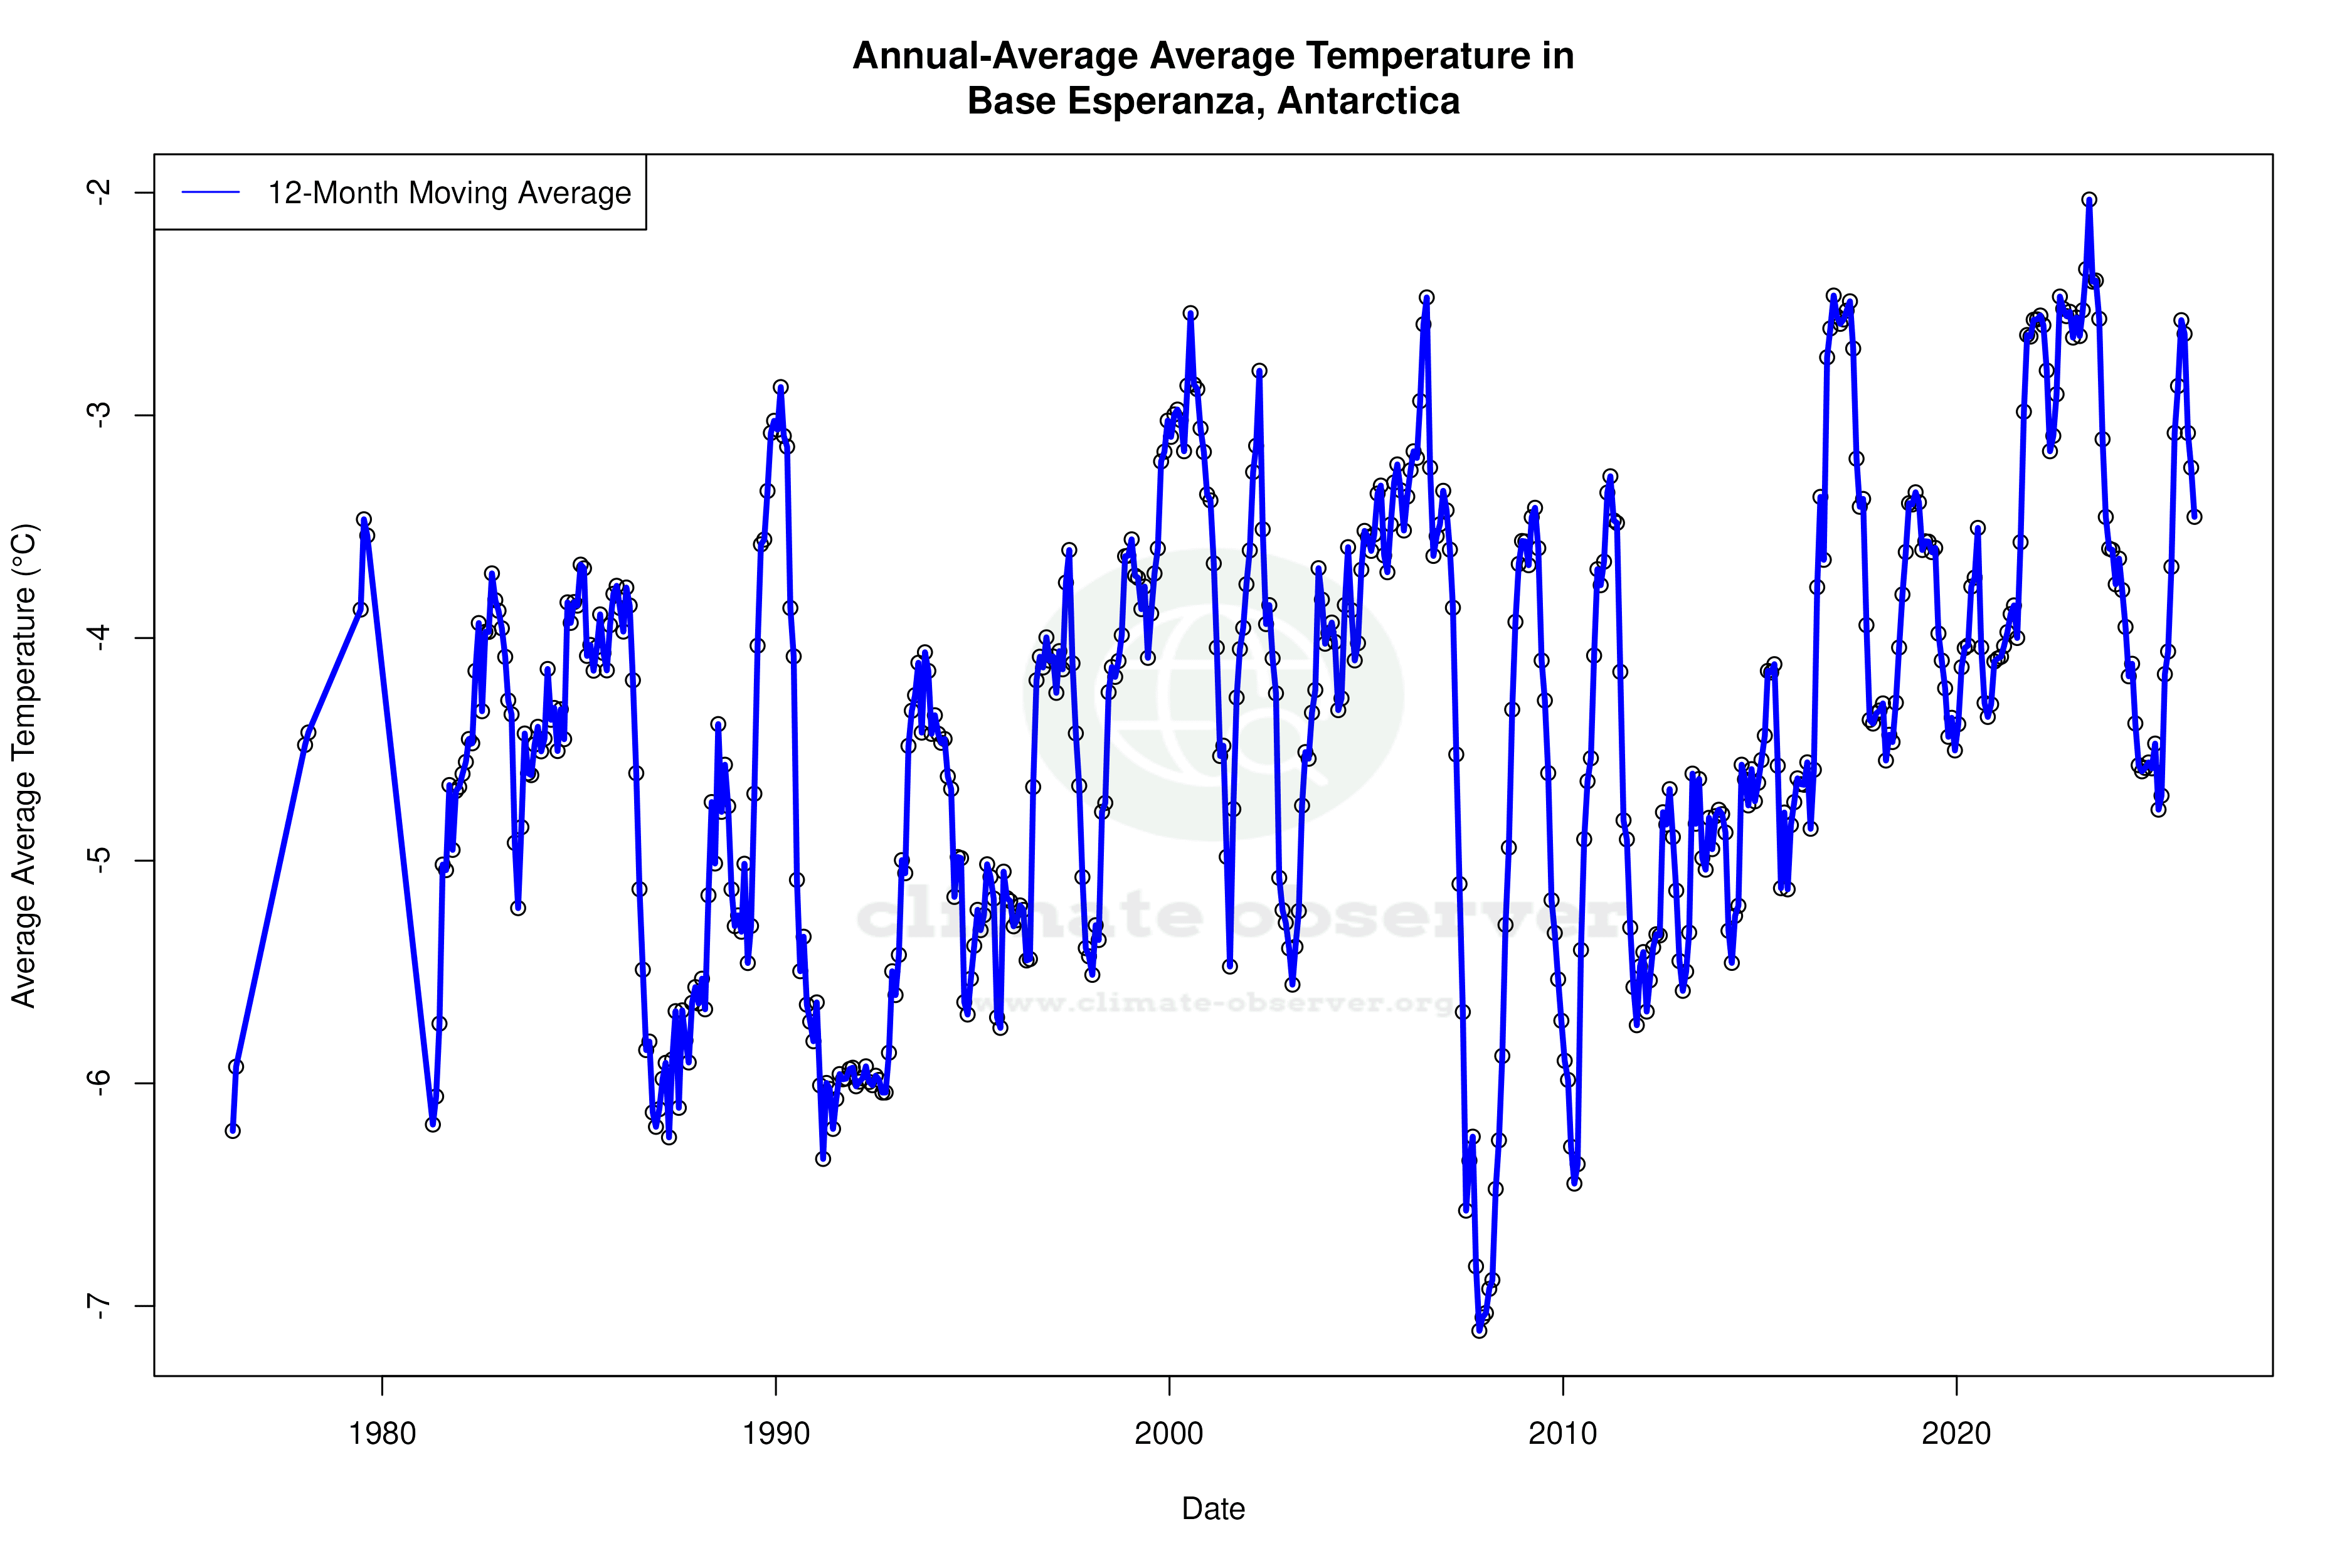


Max Temperature 12-Month MA | 1 of 6
Daily Data Points and Averages Throughout the Year


Average Max Temperature Throughout Year | 1 of 5