Climate for Station: Nassau Airport New, Nassau, Bahamas, The
Loading live weather...
Climate Analysis & Overview
Nassau Airport New, located in the subtropical paradise of The Bahamas, is experiencing nuanced climate dynamics. While long-term data indicates a slight warming trend, recent years have shown a cooling pattern, particularly in high temperatures. Precipitation patterns are becoming more concentrated, suggesting shifts in rainfall events.
Subtropical Climate Context
Situated at 25.05°N, -77.467°W on New Providence Island, Nassau Airport New is influenced by its subtropical climate, classified under the Köppen system as Aw, or tropical savanna. This classification is characterised by warm temperatures year-round and distinct wet and dry seasons, heavily influenced by the surrounding Atlantic Ocean. The island's flat topography means that elevation plays little role in temperature variation, but the proximity to the ocean moderates temperature extremes.
Temperature Trends: A Tale of Two Scales
The long-term temperature trends at Nassau Airport New reveal a modest warming. Highs have increased by 0.28°C (0.50°F), while lows have risen by 0.50°C (0.90°F) over the station's history. However, the past decade tells a different story, with a cooling trend observed. Highs have decreased by 1.11°C (2.00°F), and lows by 0.73°C (1.32°F). This divergence suggests recent climatic variability, potentially influenced by regional weather patterns or broader climate oscillations.
Precipitation Patterns: Increasing Concentration
The Precipitation Concentration Index (PCI) has shown a notable increase from a baseline of 14.1 to a current value of 17.9. This indicates that rainfall in Nassau is becoming more concentrated in fewer, more intense events. While not yet reaching the threshold of high concentration (PCI > 20), this shift suggests a move towards less frequent but heavier rainfall, which could impact water management and agricultural practices on the island.
Temperature Extremes: Historical Benchmarks
Nassau Airport New has recorded an all-time high of 37.8°C (100.0°F) and a low of 5.2°C (41.4°F). These extremes highlight the potential for significant temperature variability, even within a subtropical climate. Such variability underscores the importance of ongoing monitoring and adaptation strategies, particularly as The Bahamas continues to pursue climate resilience in the face of global climate change.
Regional Implications and Considerations
As The Bahamas navigates its climate goals, understanding these nuanced trends is crucial. The observed cooling in recent years may offer temporary relief from long-term warming, but the increasing concentration of precipitation events could pose challenges. These insights are vital for policymakers and stakeholders aiming to enhance the region's climate resilience and sustainability efforts.
Station Statistics
10-Year Trend
High: -2.38 °F/decade
Low: -1.03 °F/decade
Rain: +0.014 in/decade
25-Year Trend
High: +0.92 °F/decade
Low: +0.04 °F/decade
Rain: -0.025 in/decade
50-Year Trend
High: +0.48 °F/decade
Low: +1.22 °F/decade
Rain: -0.006 in/decade
All-Time Trend
High: +0.48 °F/decade
Low: +0.90 °F/decade
Rain: -0.006 in/decade
Percentage Above-Average Days
Last 12 Months: 41.4%
This Year: 22.8%
Precipitation Concentration Index (PCI) ℹ️
Last 12 Months: 13.7
Historical Average: 13.5
Percentile Rank of Last 12 Months ℹ️
High: 54th percentile
Low: 80th percentile
Rain: 25th percentile
Change in Variance ℹ️
High: -12.2%
Low: -17.6%
Intraday: -18.0%
Data Coverage
88.4%
First Year of Data
1961
Station Location
Historical Weather Records
| Max High | Avg High | Min High | Max Avg | Avg Avg | Min Avg | Max Low | Avg Low | Min Low | Max Precipitation | Avg Precipitation | Max Snow | Avg Snow | |
|---|---|---|---|---|---|---|---|---|---|---|---|---|---|
| Record | 100.04 °F | — | 59.36 °F | 91.76 °F | — | 54.86 °F | 85.64 °F | — | 41.36 °F | 10.08 in | — | — | — |
| January | 89.78 °F | 78.22 °F | 59.36 °F | 79.88 °F | 71.52 °F | 54.86 °F | 77.18 °F | 64.28 °F | 41.36 °F | 1.95 in | 0.06 in | — | — |
| February | 91.40 °F | 78.80 °F | 62.60 °F | 84.02 °F | 72.09 °F | 55.04 °F | 76.69 °F | 64.63 °F | 45.86 °F | 2.09 in | 0.06 in | — | — |
| March | 91.40 °F | 80.53 °F | 64.94 °F | 84.38 °F | 73.65 °F | 59.00 °F | 79.20 °F | 65.97 °F | 44.60 °F | 10.08 in | 0.08 in | — | — |
| April | 93.20 °F | 82.69 °F | 71.96 °F | 84.38 °F | 75.99 °F | 62.06 °F | 80.83 °F | 68.60 °F | 48.56 °F | 4.53 in | 0.08 in | — | — |
| May | 95.54 °F | 85.41 °F | 73.90 °F | 86.90 °F | 79.03 °F | 69.26 °F | 82.40 °F | 71.75 °F | 52.70 °F | 10.04 in | 0.16 in | — | — |
| June | 97.70 °F | 88.03 °F | 77.18 °F | 88.70 °F | 82.13 °F | 72.68 °F | 84.11 °F | 74.84 °F | 59.00 °F | 7.56 in | 0.25 in | — | — |
| July | 96.80 °F | 89.77 °F | 81.07 °F | 91.40 °F | 83.77 °F | 75.56 °F | 84.63 °F | 76.29 °F | 64.22 °F | 4.61 in | 0.19 in | — | — |
| August | 100.04 °F | 90.05 °F | 80.24 °F | 91.76 °F | 83.83 °F | 75.38 °F | 85.64 °F | 76.39 °F | 64.40 °F | 5.86 in | 0.25 in | — | — |
| September | 95.72 °F | 88.98 °F | 78.98 °F | 88.70 °F | 82.76 °F | 75.74 °F | 85.35 °F | 75.71 °F | 64.22 °F | 10.08 in | 0.23 in | — | — |
| October | 95.00 °F | 86.26 °F | 73.09 °F | 88.16 °F | 80.34 °F | 70.70 °F | 83.61 °F | 73.75 °F | 59.00 °F | 7.72 in | 0.18 in | — | — |
| November | 92.12 °F | 82.47 °F | 68.72 °F | 83.66 °F | 76.68 °F | 64.94 °F | 81.09 °F | 69.74 °F | 51.98 °F | 6.77 in | 0.09 in | — | — |
| December | 89.60 °F | 79.55 °F | 64.04 °F | 81.86 °F | 73.47 °F | 57.74 °F | 79.07 °F | 66.30 °F | 45.68 °F | 4.72 in | 0.06 in | — | — |
Data Visualisations
Remove WatermarksCurrent Year Climate Trends vs Historical


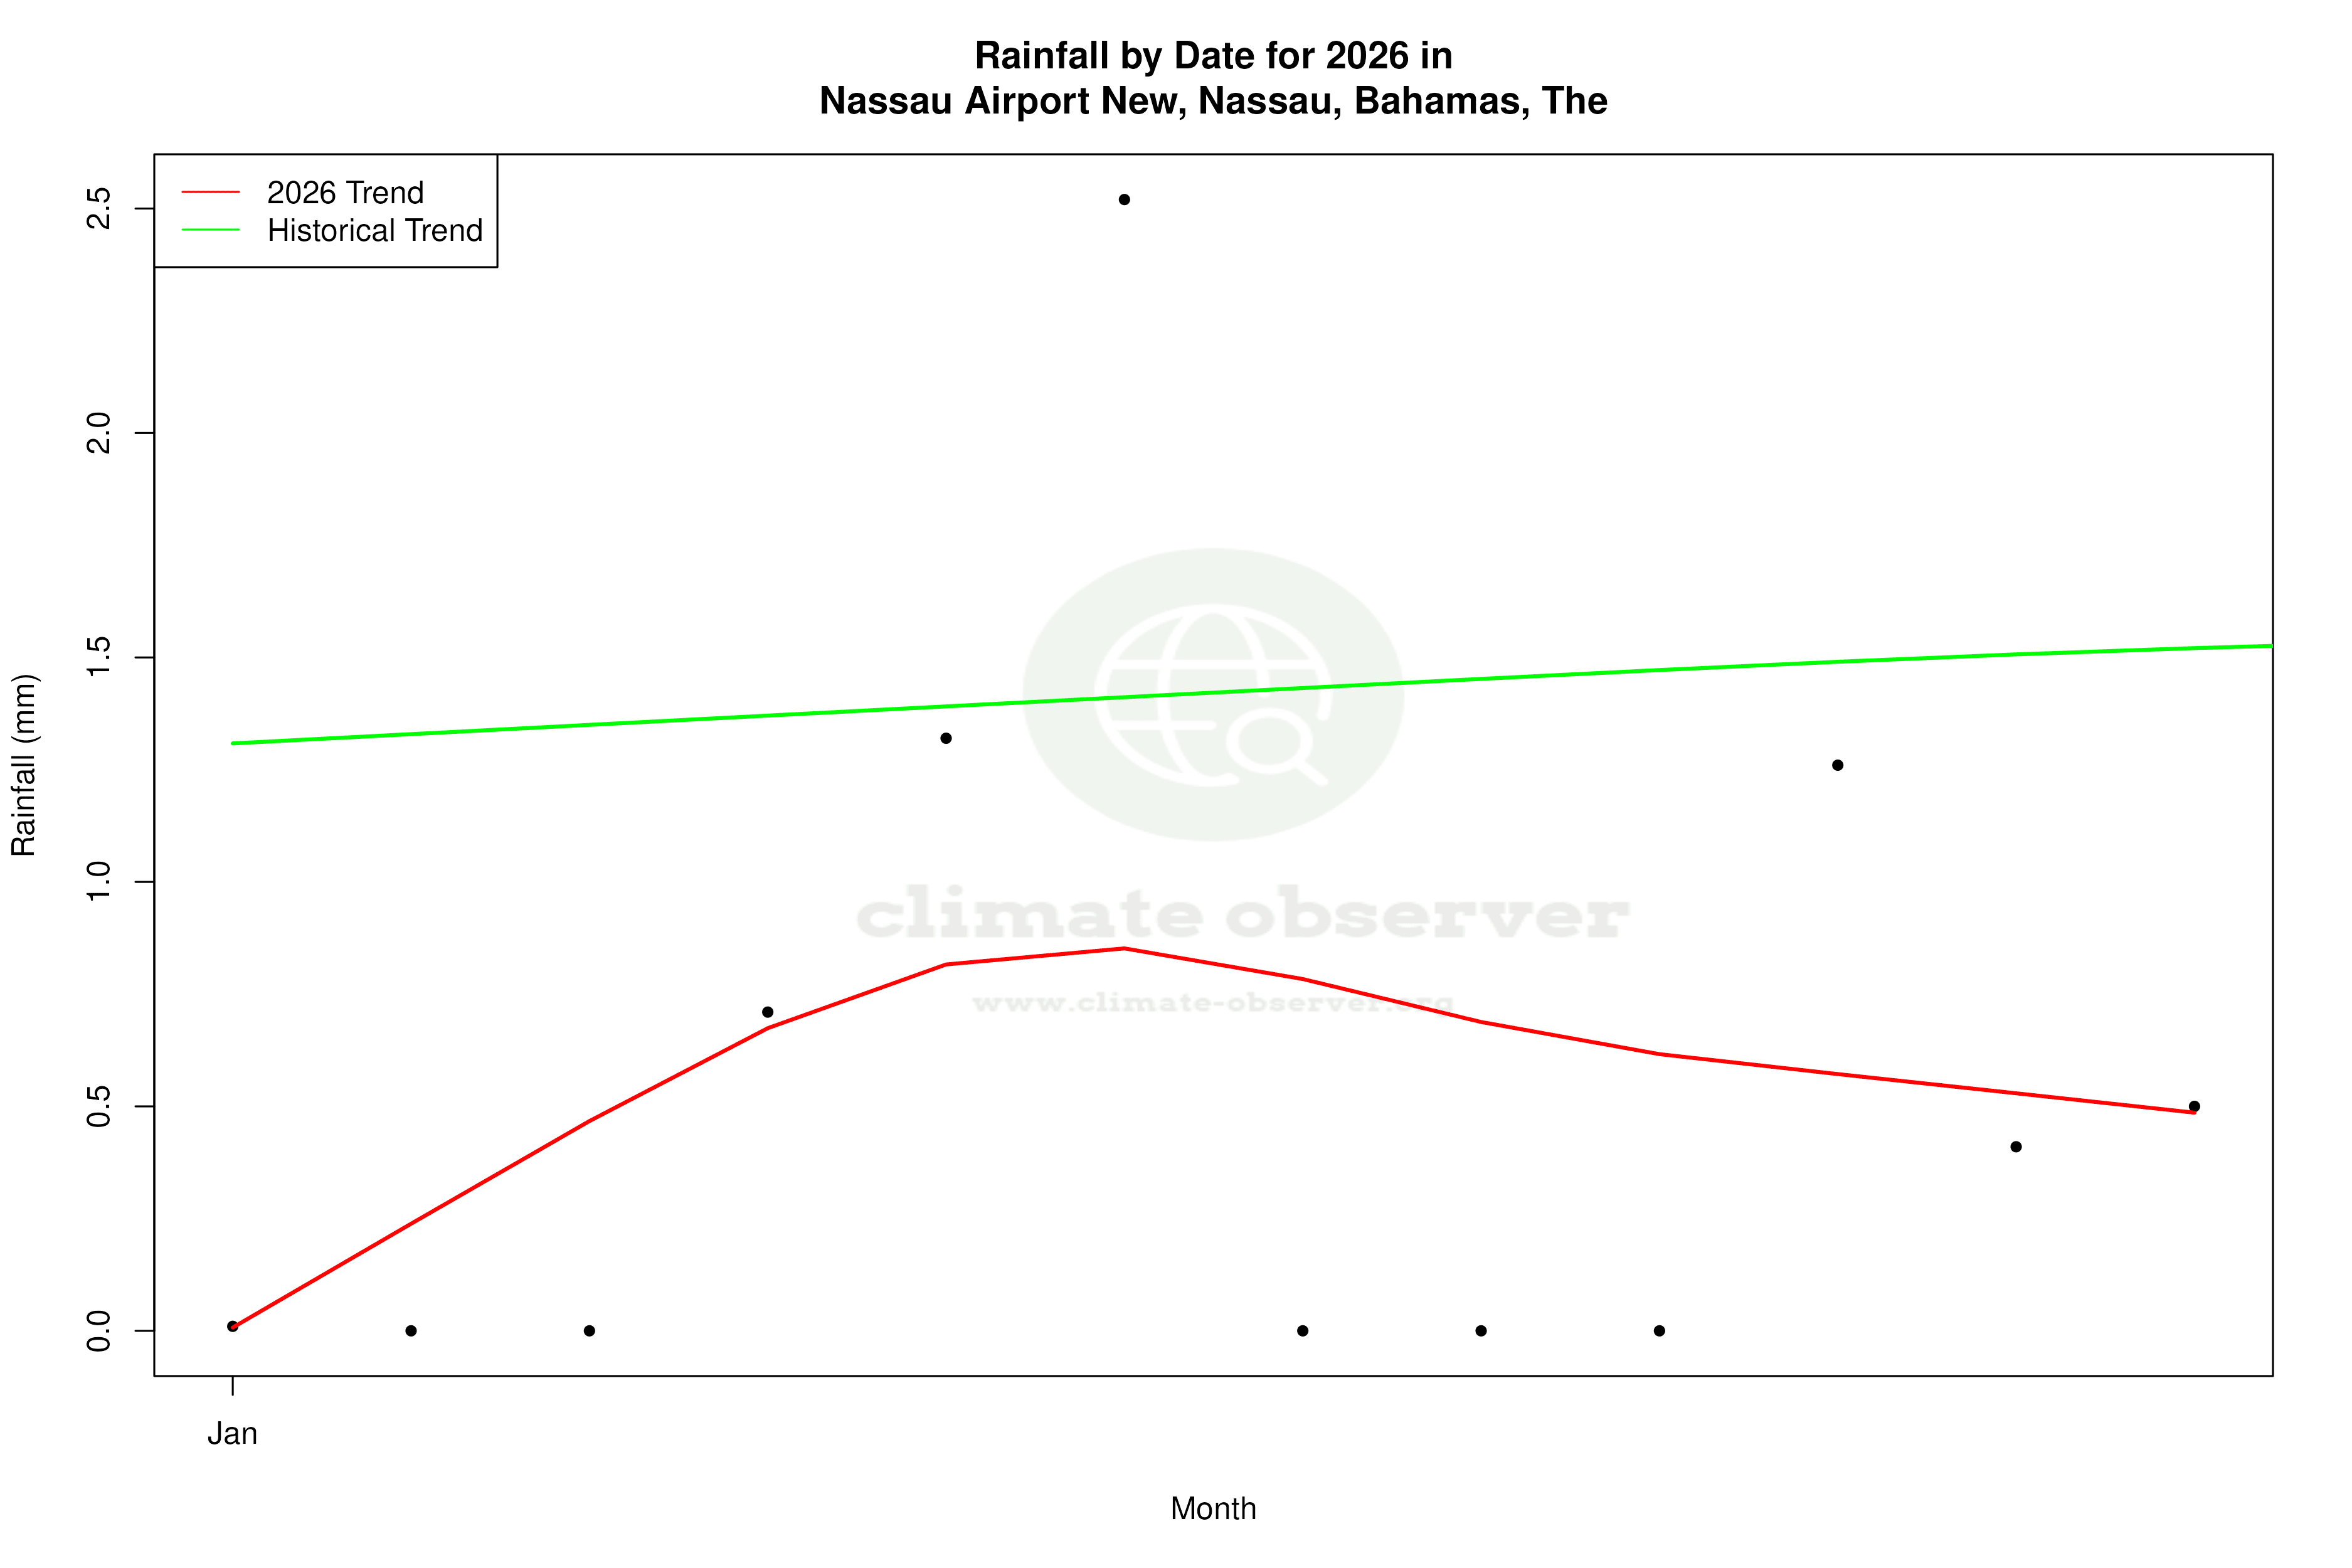


Max Temperature this Year | 1 of 6
Climate 12-Month Moving Averages


Max Temperature 12-Month MA | 1 of 6
Daily Data Points and Averages Throughout the Year
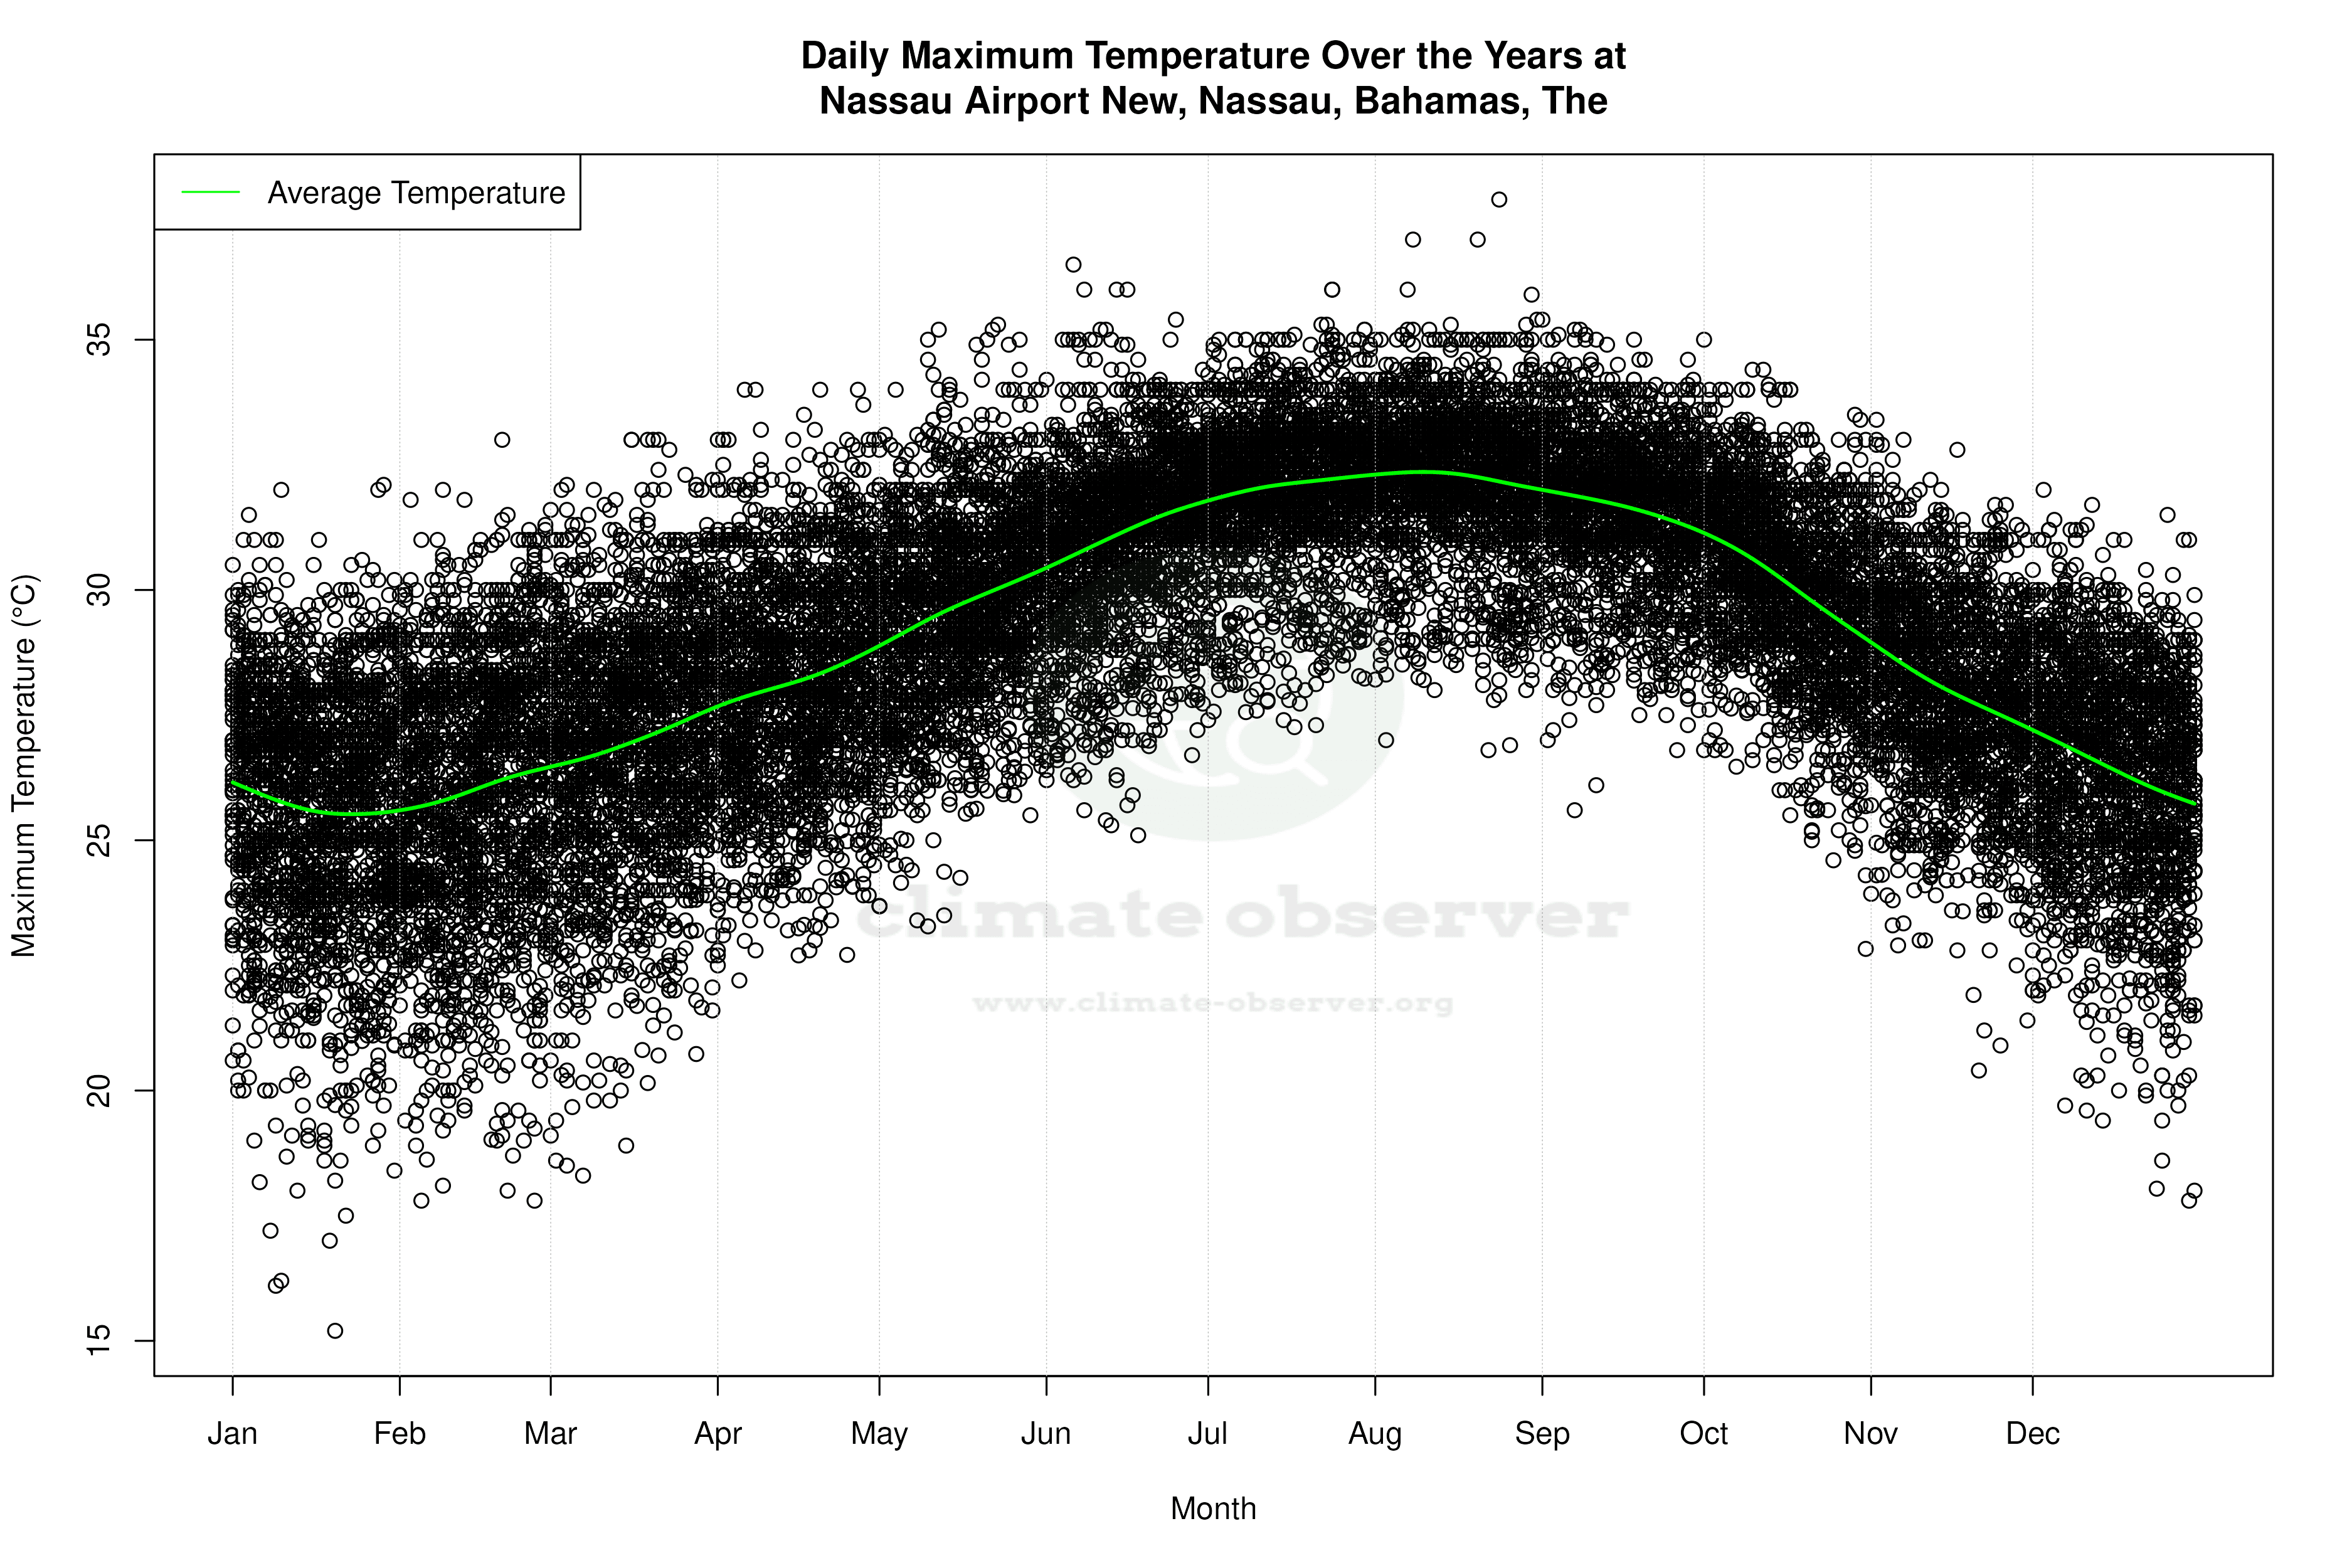


Average Max Temperature Throughout Year | 1 of 5
