Climate for Station: Alta Floresta Aero, Mato Grosso, Brazil
Loading live weather...
Climate Analysis & Overview
Alta Floresta Aero, situated in Brazil's Mato Grosso region, exhibits a warming trend with both highs and lows increasing over the past decade. The precipitation is becoming slightly more evenly distributed, a subtle shift in the local climate dynamics.
Warming Trends in Alta Floresta
Alta Floresta Aero, located at -9.867, -56.1, falls under the Tropical Monsoon climate classification (Am) according to the Köppen system. This region is characterised by a pronounced wet season and a short dry season. Over the last decade, the station has recorded significant warming, with high temperatures rising by 3.69°C (6.64°F) and low temperatures increasing by 3.47°C (6.25°F). This recent warming is more pronounced than the all-time trends, which show a rise of 1.08°C (1.94°F) in highs and 0.56°C (1.01°F) in lows. Such trends suggest a notable shift in temperature dynamics, likely influenced by broader regional climate changes and deforestation activities in the Amazon basin.
Temperature Extremes and Records
The absolute temperature records at Alta Floresta Aero highlight the region's capacity for thermal extremes. The highest recorded temperature is 43.0°C (109.4°F), while the lowest is 9.7°C (49.5°F). These extremes underscore the variability within this tropical climate, where intense heat can be punctuated by cooler periods, particularly during the dry season.
Precipitation Patterns and PCI
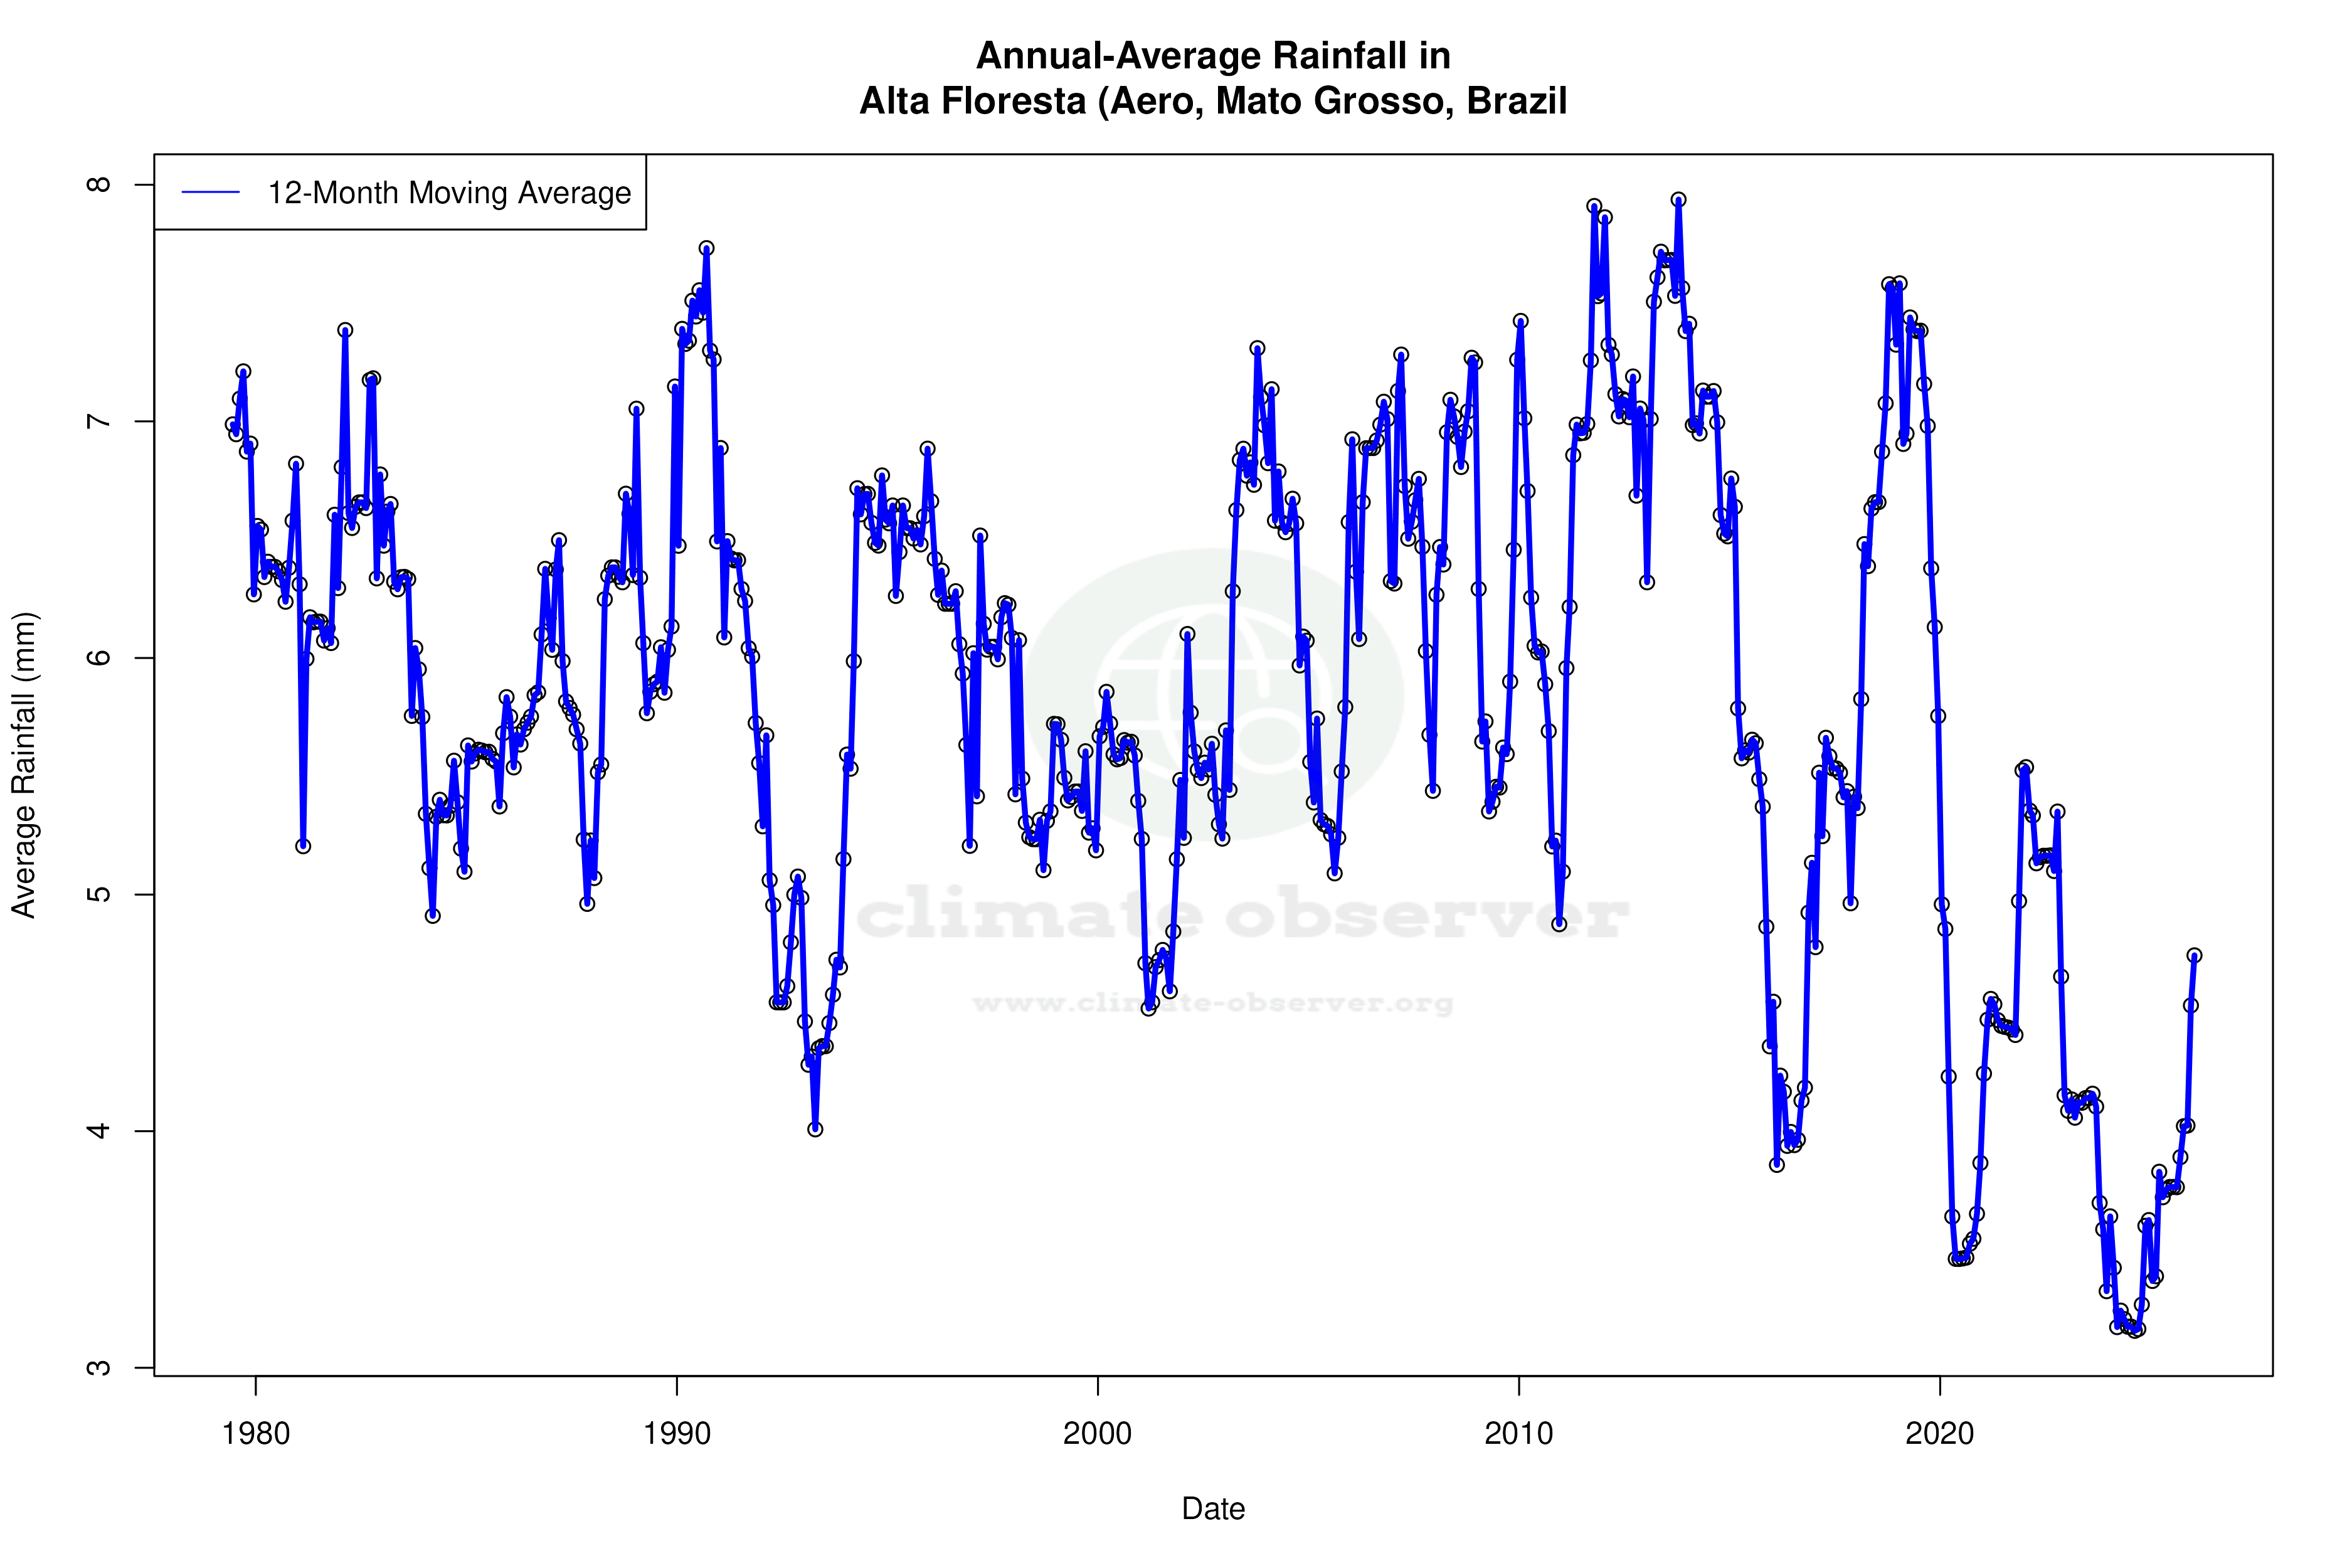
The Precipitation Concentration Index (PCI) at Alta Floresta Aero has seen a slight decrease from a baseline of 14.39 to a current value of 13.87. The PCI measures how precipitation is distributed over time, with lower values indicating a more even distribution. This marginal change suggests that rainfall events are becoming slightly more evenly spread throughout the year, possibly reducing the intensity and frequency of extreme precipitation events. This shift could have implications for local agriculture and water management strategies, aligning with Brazil's regional climate goals to enhance resilience against climate variability.
Geographical Influences on Climate
Alta Floresta's climate is heavily influenced by its geographical setting in the central-western part of Brazil. The region's proximity to the Amazon rainforest plays a crucial role in its weather patterns, contributing to high humidity and significant rainfall during the wet season. The surrounding topography, with its mix of forested areas and open land, can amplify temperature variations and influence localised weather phenomena. This interplay between geography and climate is critical in understanding the observed trends and their potential impacts on the local ecosystem and human activities.
Station Statistics
10-Year Trend
High: +6.31 °F/decade
Low: +5.81 °F/decade
Rain: -0.098 in/decade
25-Year Trend
High: +3.34 °F/decade
Low: +2.68 °F/decade
Rain: -0.038 in/decade
50-Year Trend
High: +1.94 °F/decade
Low: +1.00 °F/decade
Rain: -0.010 in/decade
All-Time Trend
High: +1.94 °F/decade
Low: +1.00 °F/decade
Rain: -0.010 in/decade
Percentage Above-Average Days
Last 12 Months: 60.5%
This Year: 63.3%
Precipitation Concentration Index (PCI) ℹ️
Last 12 Months: 12.9
Historical Average: 14.1
Percentile Rank of Last 12 Months ℹ️
High: 95th percentile
Low: 91st percentile
Rain: 7th percentile
Change in Variance ℹ️
High: -10.0%
Low: +32.4%
Intraday: -25.0%
Data Coverage
96.1%
First Year of Data
1978
Station Location
Historical Weather Records
| Max High | Avg High | Min High | Max Avg | Avg Avg | Min Avg | Max Low | Avg Low | Min Low | Max Precipitation | Avg Precipitation | Max Snow | Avg Snow | |
|---|---|---|---|---|---|---|---|---|---|---|---|---|---|
| Record | 109.40 °F | — | 63.70 °F | 101.66 °F | — | 58.51 °F | 84.02 °F | — | 49.46 °F | 7.17 in | — | — | — |
| January | 96.80 °F | 83.08 °F | 73.58 °F | 92.48 °F | 79.08 °F | 70.16 °F | 77.36 °F | 71.55 °F | 60.80 °F | 7.17 in | 0.41 in | — | — |
| February | 98.60 °F | 83.12 °F | 73.58 °F | 93.56 °F | 78.89 °F | 70.90 °F | 78.44 °F | 71.67 °F | 66.02 °F | 6.42 in | 0.46 in | — | — |
| March | 102.20 °F | 83.25 °F | 74.68 °F | 94.46 °F | 79.58 °F | 71.24 °F | 79.34 °F | 71.87 °F | 64.85 °F | 5.28 in | 0.40 in | — | — |
| April | 104.00 °F | 83.87 °F | 75.51 °F | 96.44 °F | 80.63 °F | 71.60 °F | 78.62 °F | 71.80 °F | 61.16 °F | 5.79 in | 0.26 in | — | — |
| May | 98.60 °F | 83.99 °F | 71.15 °F | 94.64 °F | 81.01 °F | 67.10 °F | 79.88 °F | 70.49 °F | 58.10 °F | 3.42 in | 0.09 in | — | — |
| June | 107.60 °F | 85.10 °F | 63.70 °F | 98.60 °F | 81.00 °F | 58.51 °F | 78.08 °F | 67.52 °F | 50.40 °F | 0.82 in | 0.01 in | — | — |
| July | 109.40 °F | 89.50 °F | 71.89 °F | 101.66 °F | 81.80 °F | 59.54 °F | 78.62 °F | 65.83 °F | 49.46 °F | 1.58 in | 0.01 in | — | — |
| August | 104.18 °F | 95.27 °F | 68.79 °F | 99.86 °F | 84.28 °F | 63.66 °F | 80.60 °F | 68.36 °F | 50.00 °F | 1.62 in | 0.02 in | — | — |
| September | 105.60 °F | 95.13 °F | 76.69 °F | 99.32 °F | 84.13 °F | 70.16 °F | 83.62 °F | 71.48 °F | 56.12 °F | 2.60 in | 0.13 in | — | — |
| October | 105.71 °F | 90.52 °F | 75.18 °F | 97.52 °F | 82.20 °F | 71.24 °F | 84.02 °F | 72.13 °F | 64.76 °F | 3.91 in | 0.25 in | — | — |
| November | 103.28 °F | 86.00 °F | 75.85 °F | 98.60 °F | 80.78 °F | 66.74 °F | 82.76 °F | 72.09 °F | 64.40 °F | 4.65 in | 0.32 in | — | — |
| December | 98.60 °F | 83.64 °F | 74.23 °F | 94.46 °F | 79.51 °F | 70.88 °F | 78.98 °F | 71.90 °F | 64.40 °F | 4.94 in | 0.38 in | — | — |
Data Visualisations
Remove WatermarksCurrent Year Climate Trends vs Historical


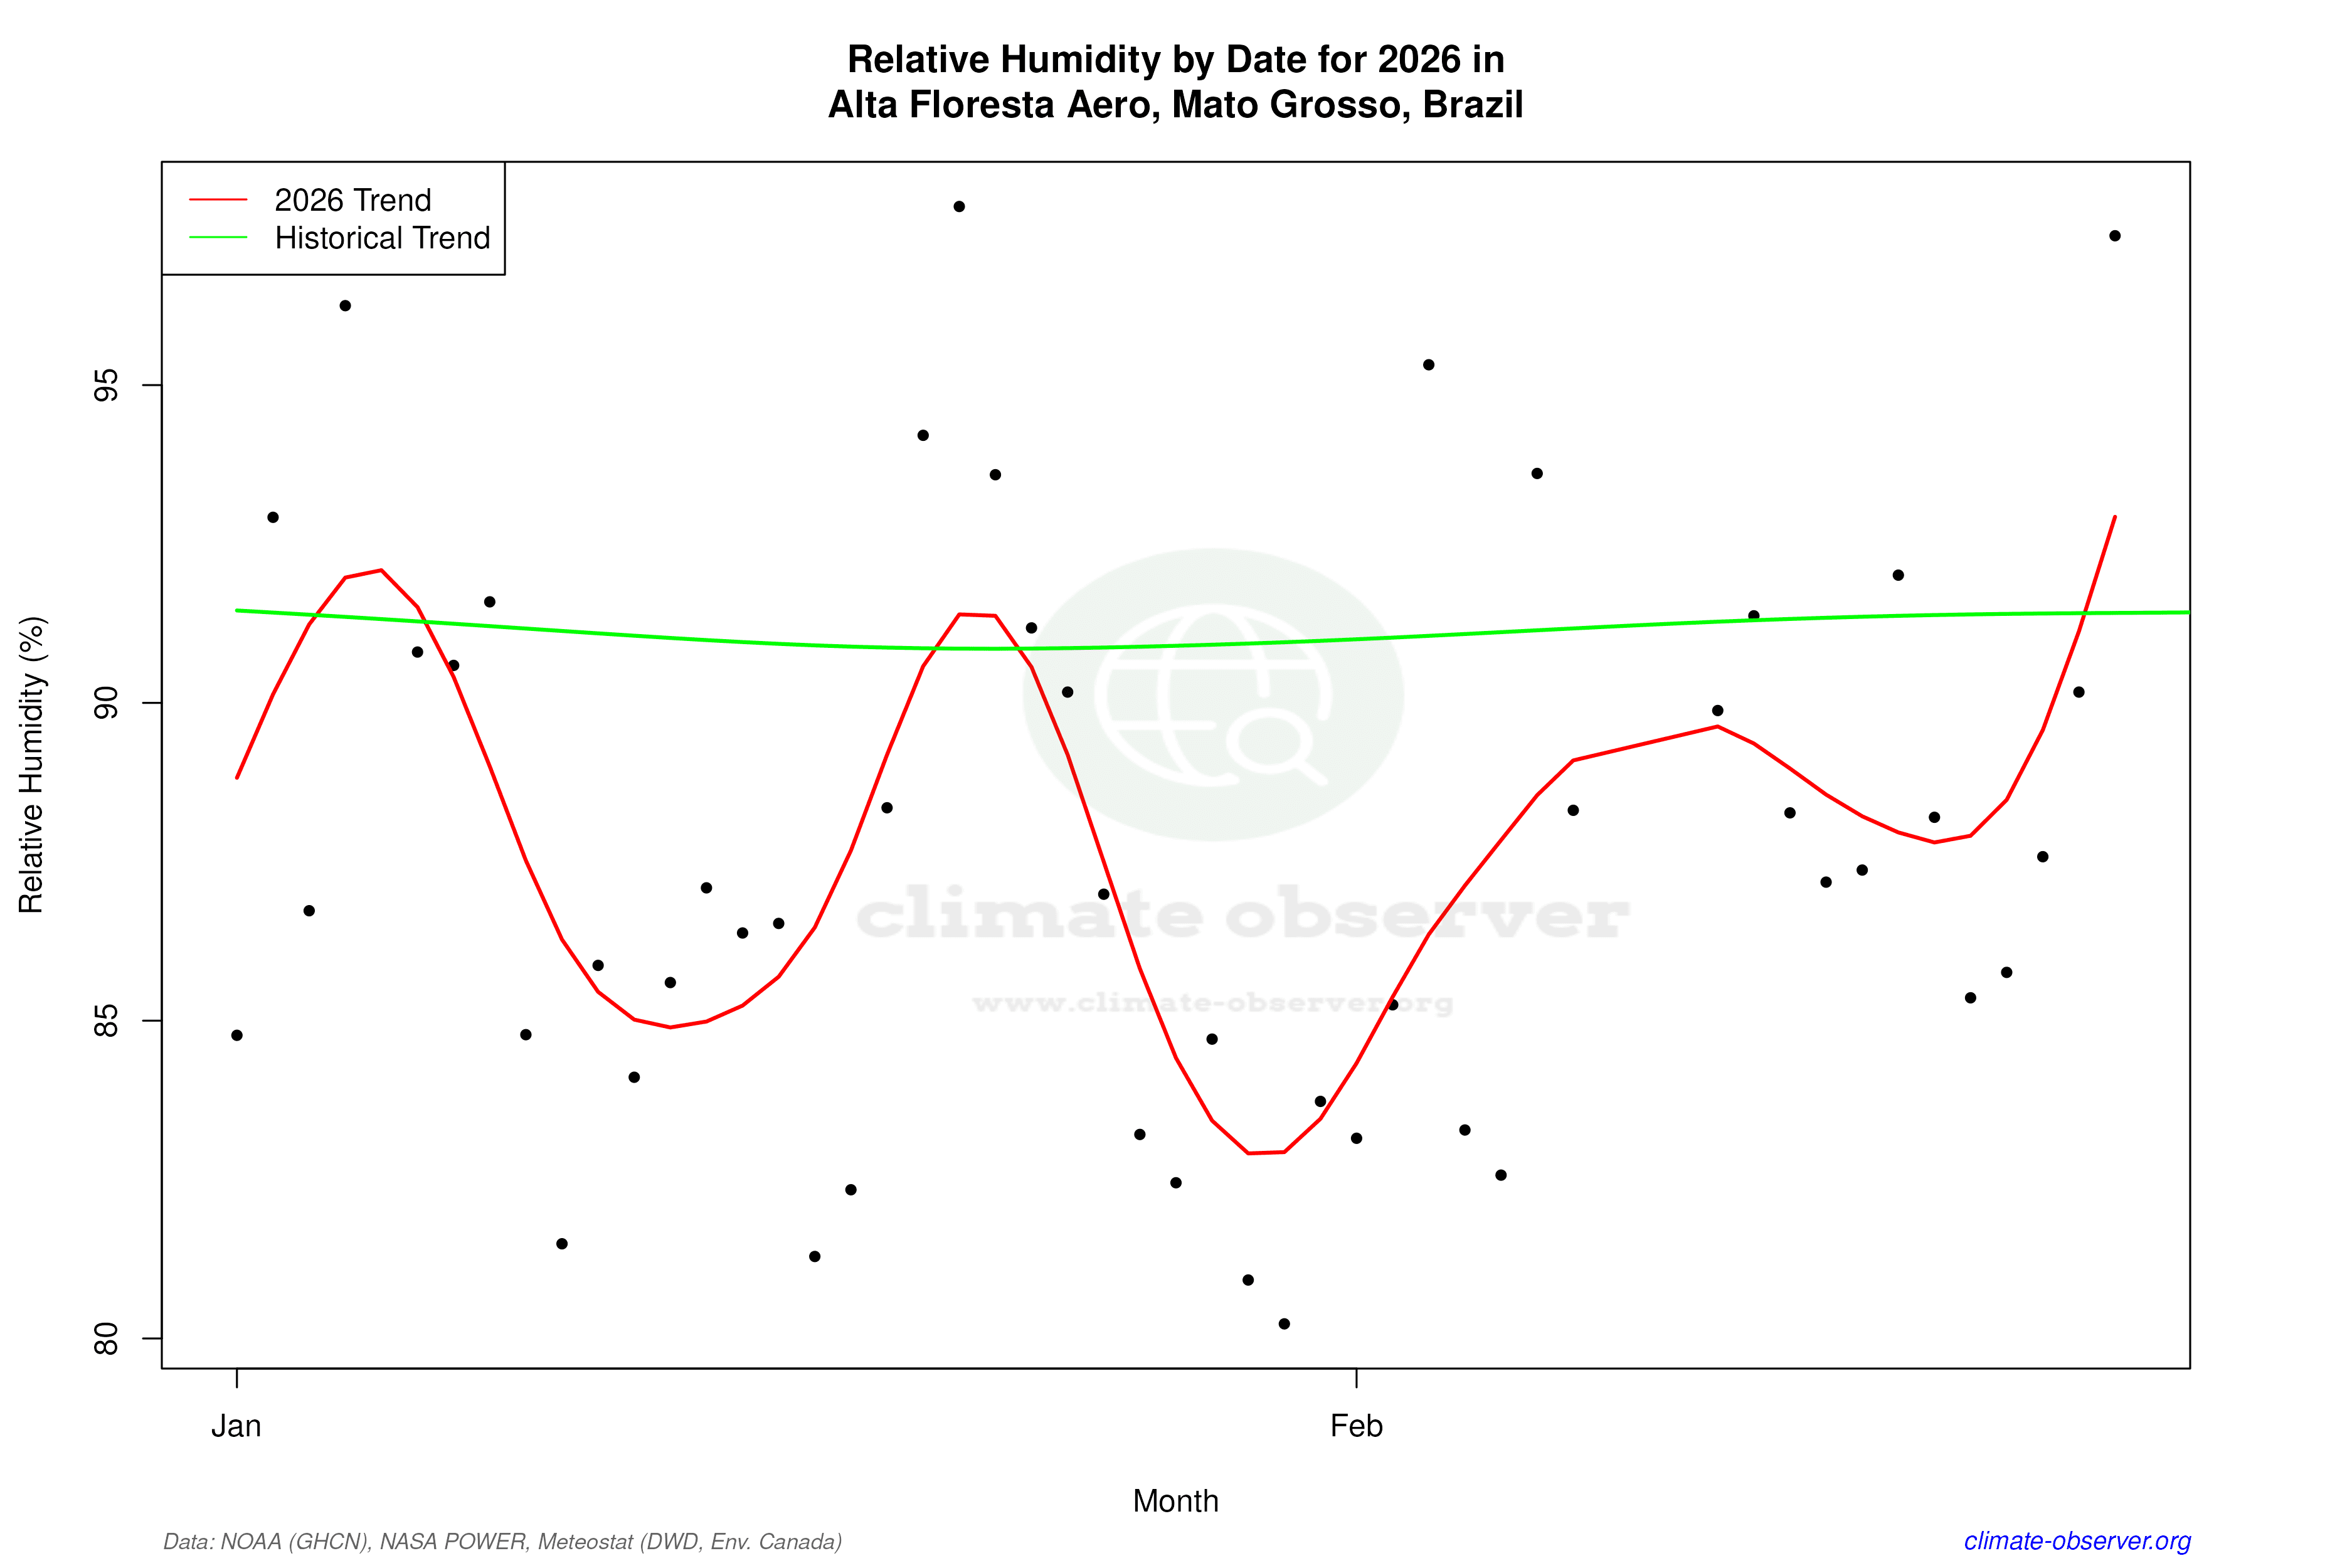

Max Temperature this Year | 1 of 6
Climate 12-Month Moving Averages

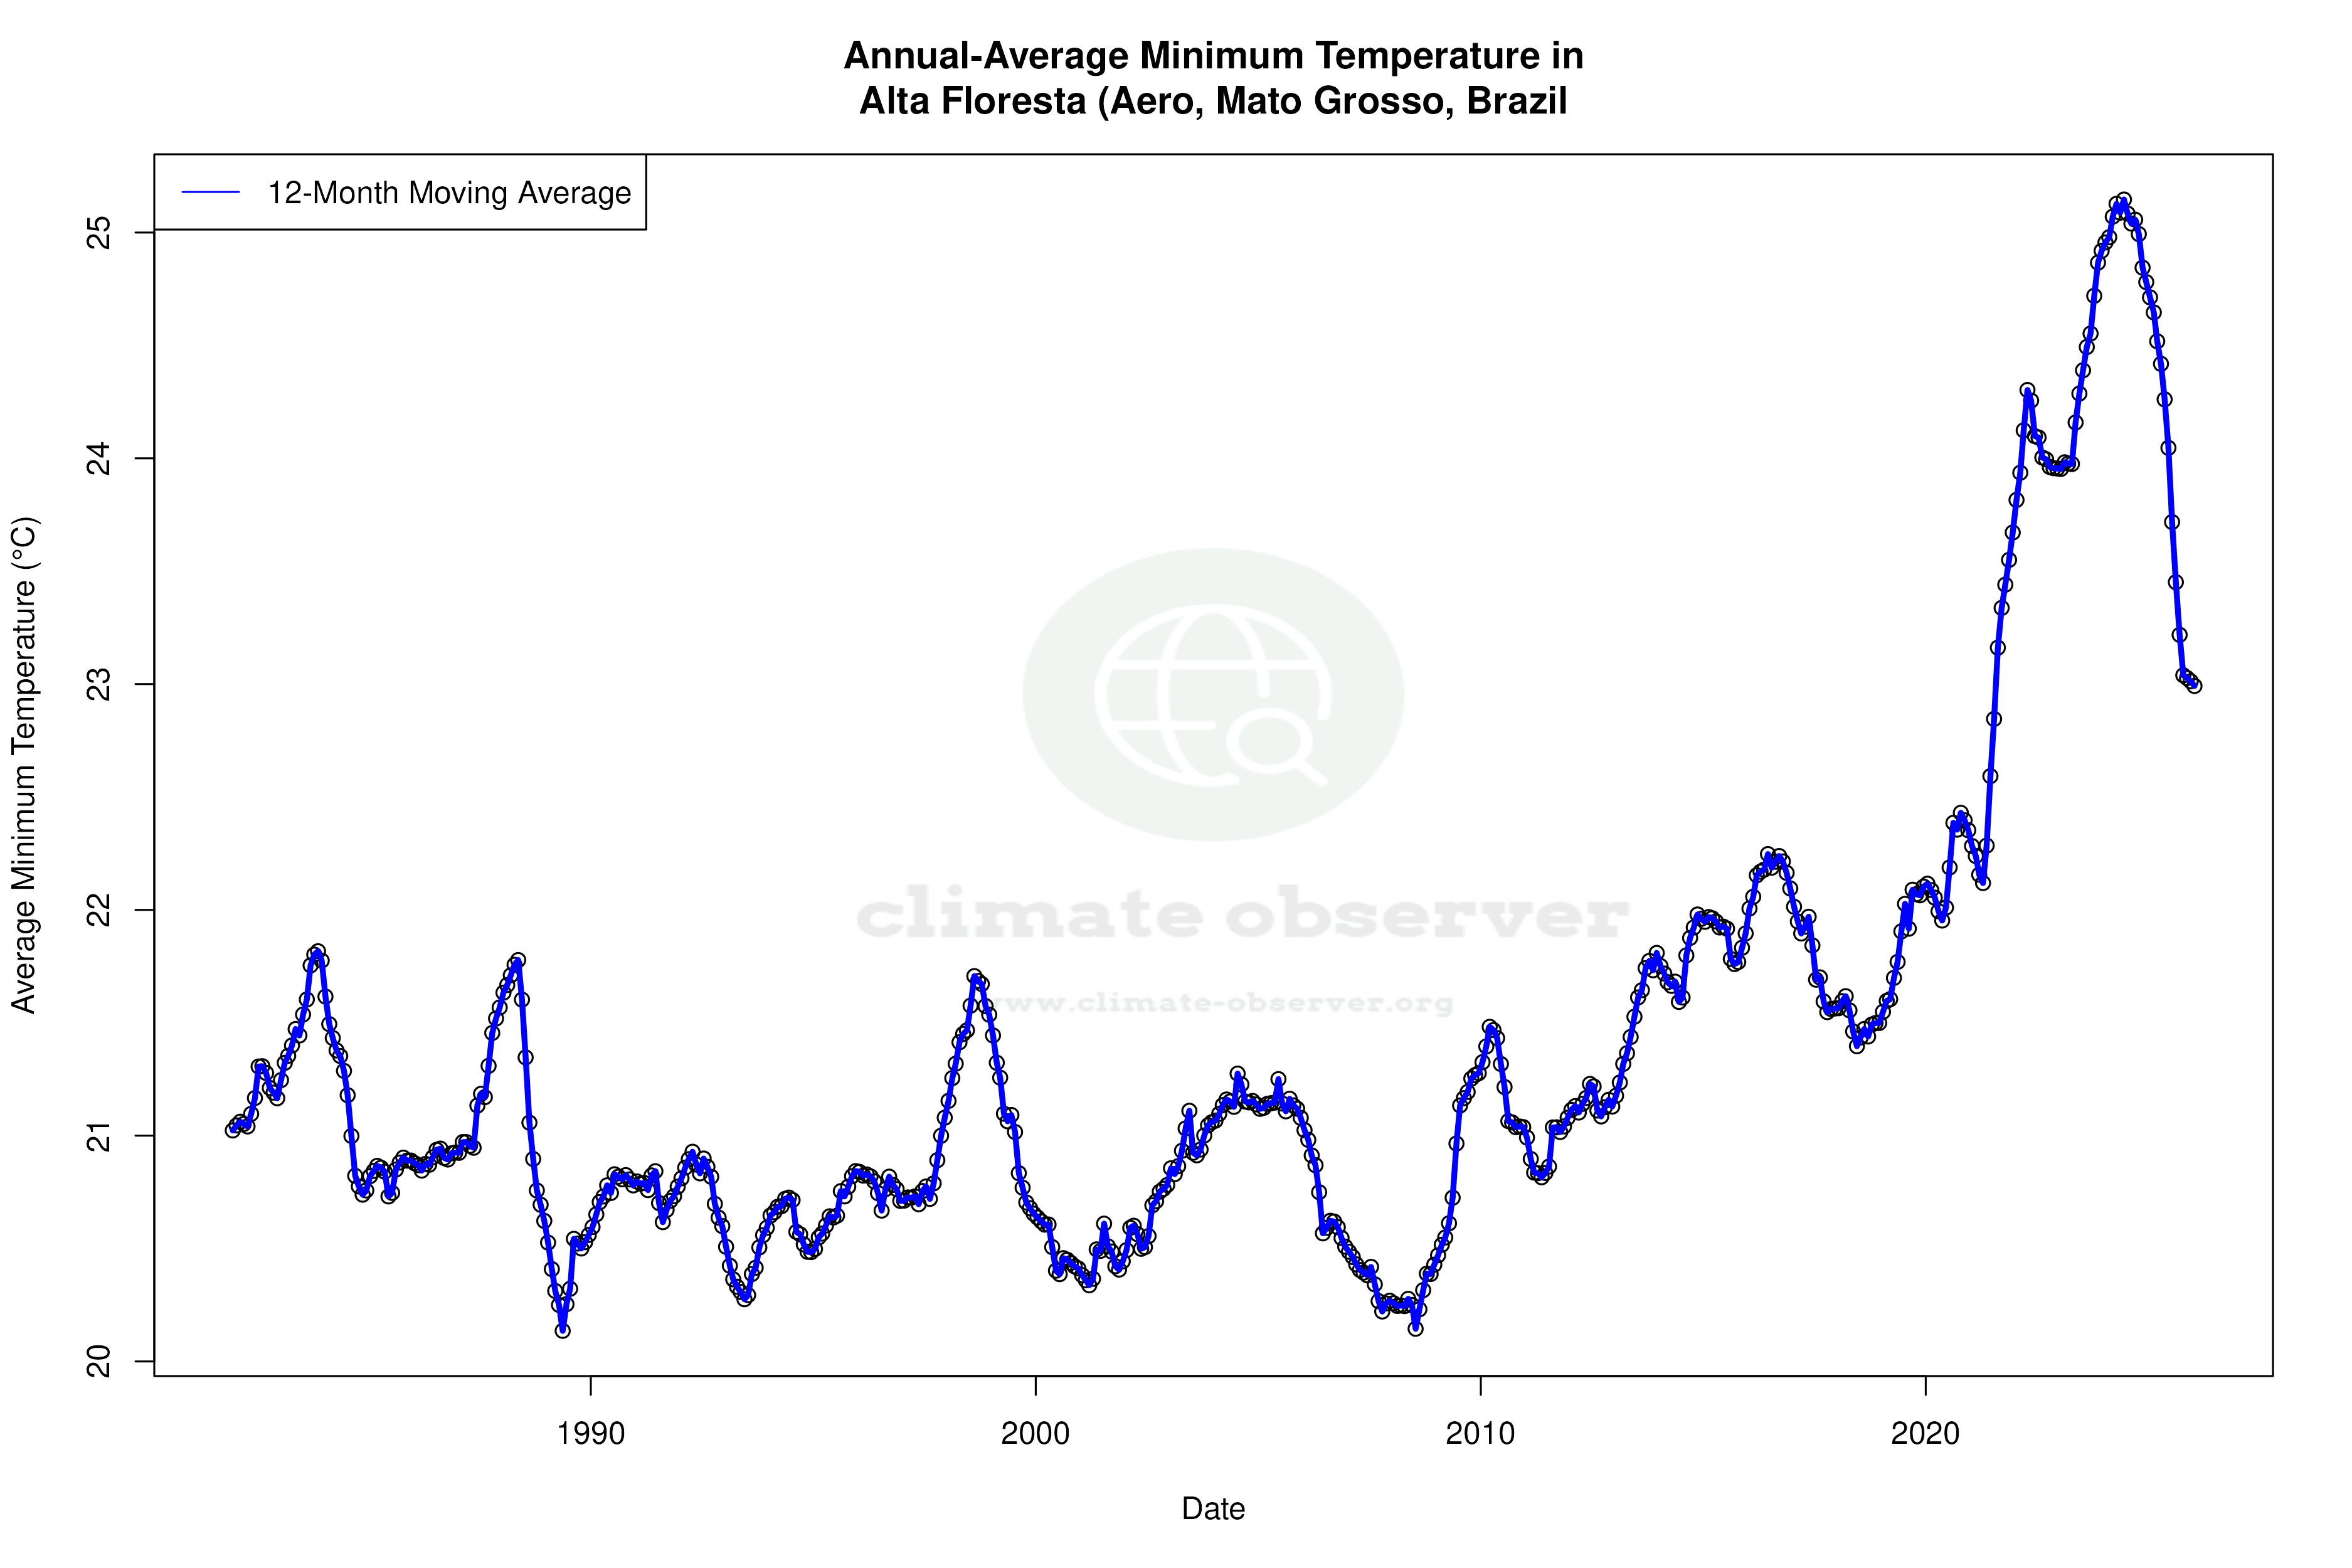


Max Temperature 12-Month MA | 1 of 6
Daily Data Points and Averages Throughout the Year

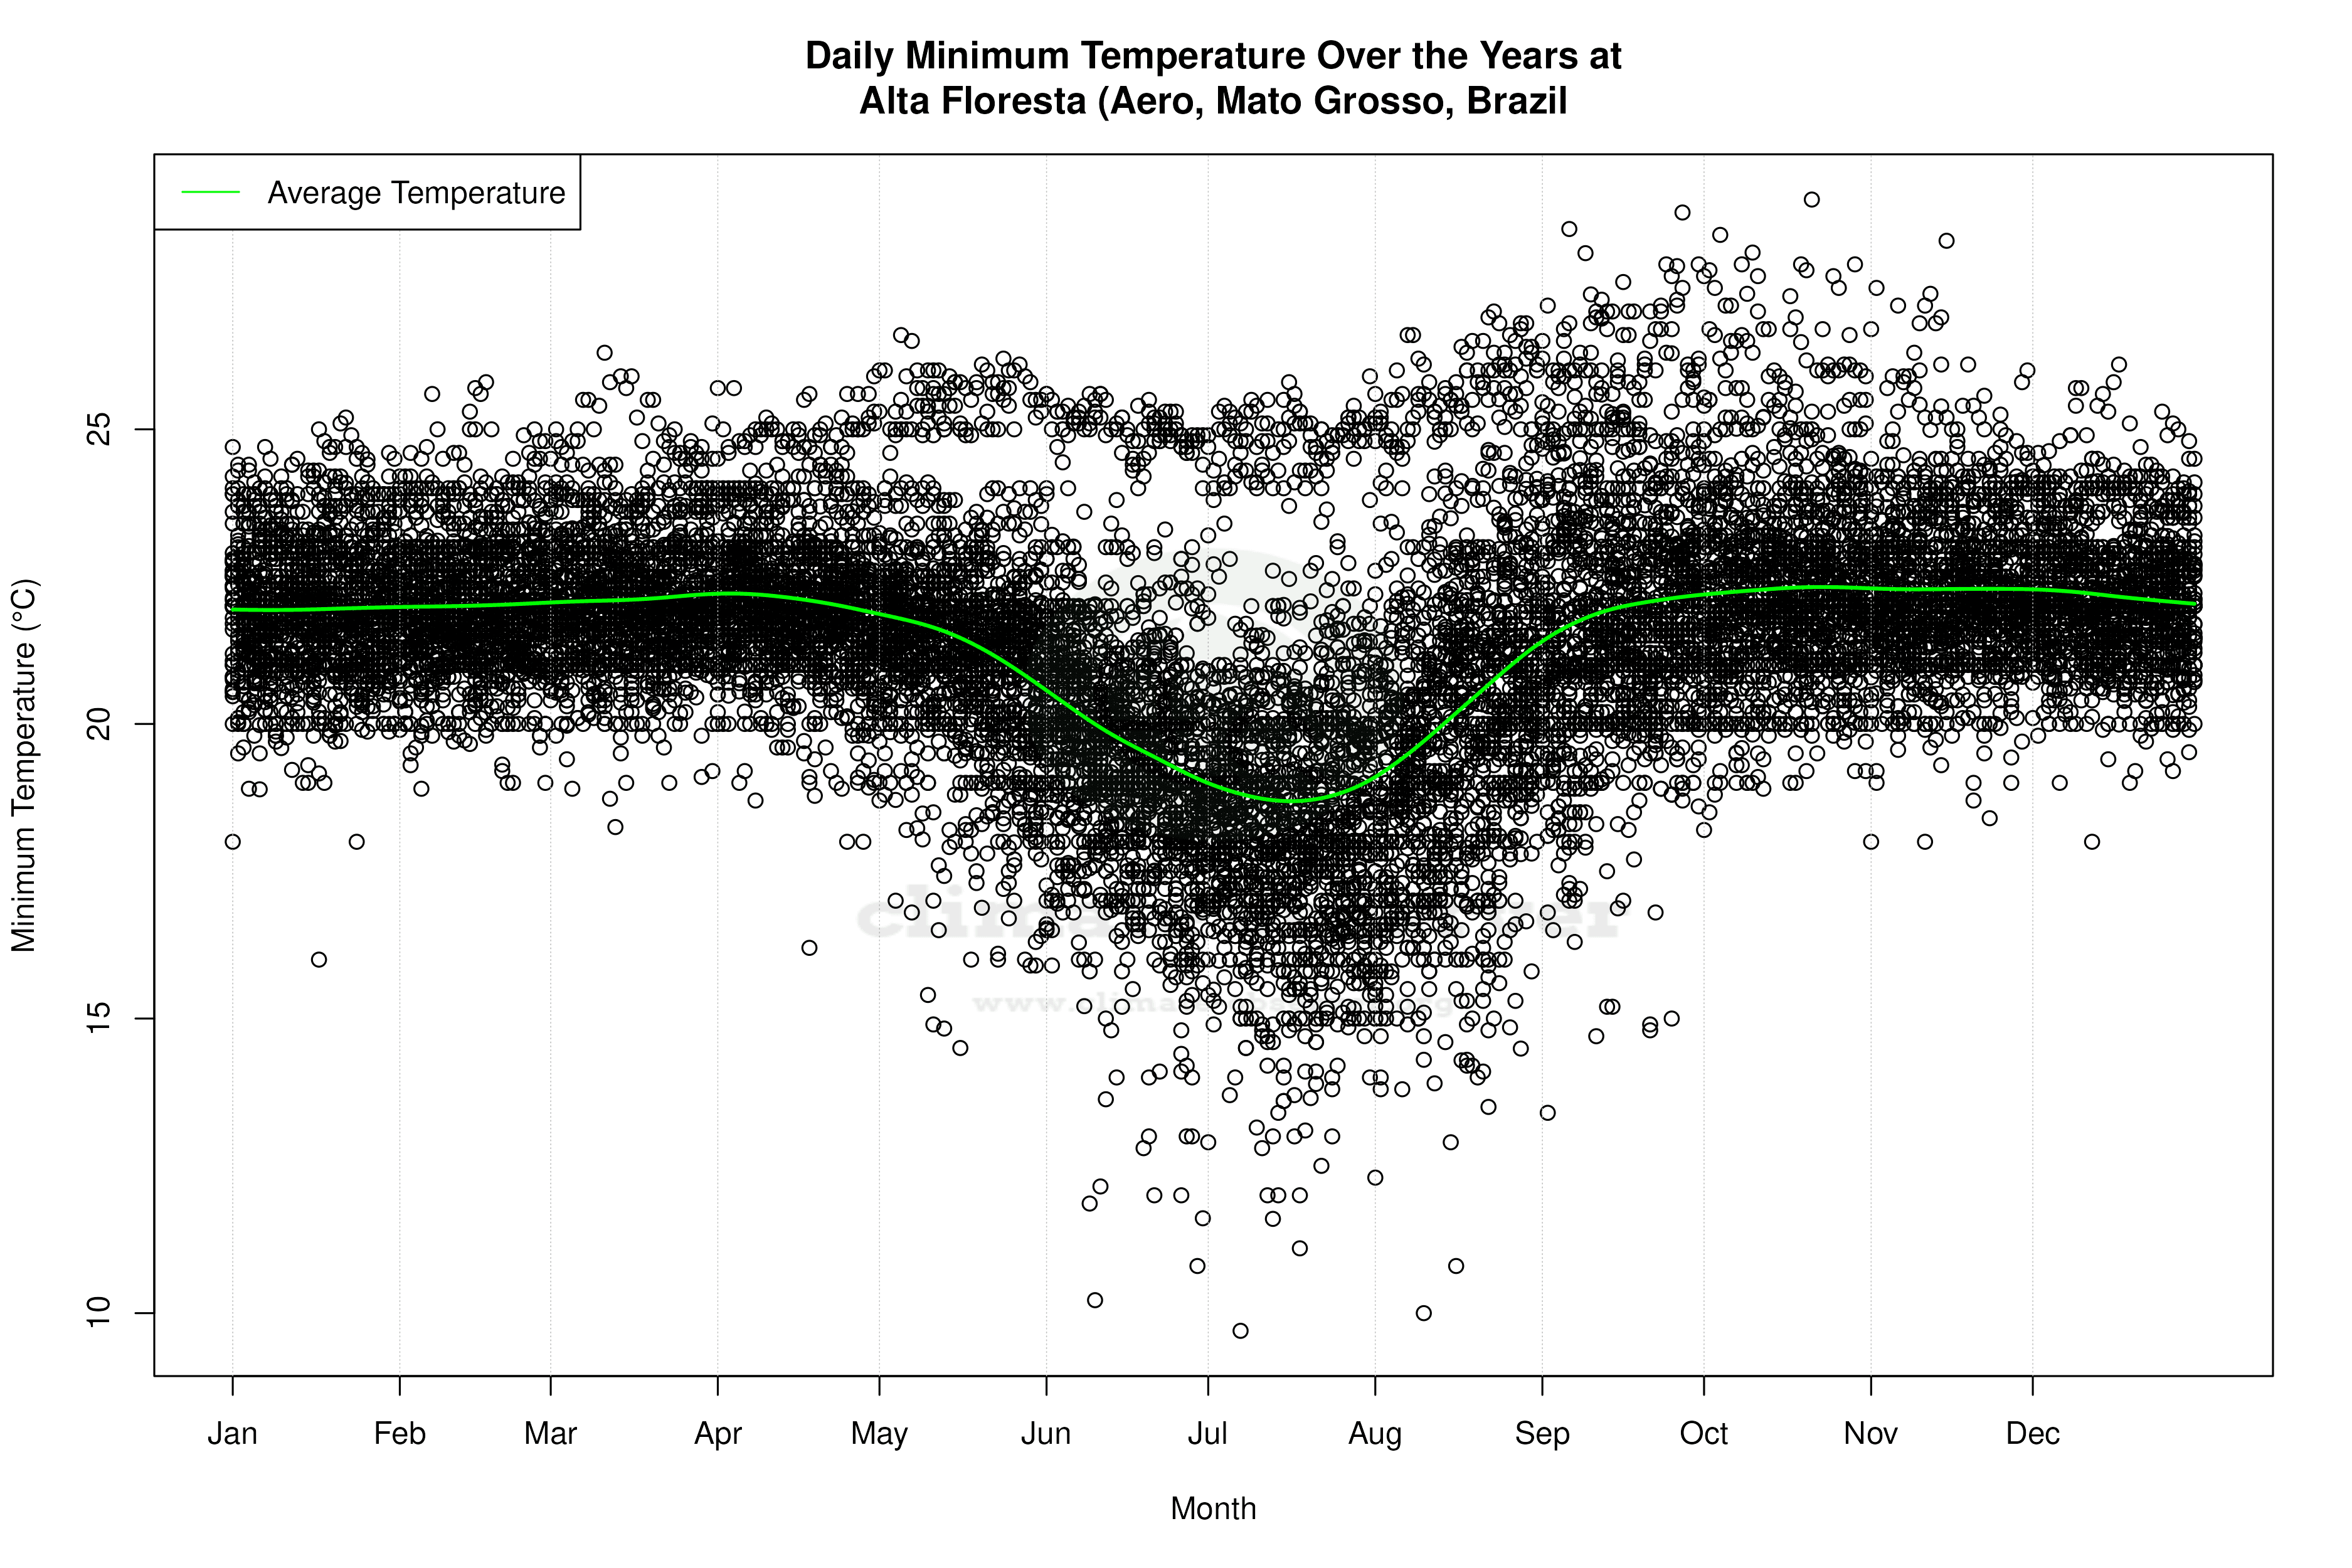


Average Max Temperature Throughout Year | 1 of 5
