Climate for Station: Iguazu Aero, Misiones, Brazil
Loading live weather...
Climate Analysis & Overview
Iguazu Aero is experiencing a warming trend, with both high and low temperatures rising over the past decade. The precipitation pattern has become more evenly distributed, reflecting a shift in the local climate dynamics. This aligns with regional climate goals to mitigate extreme weather events.
Tropical Climate Dynamics
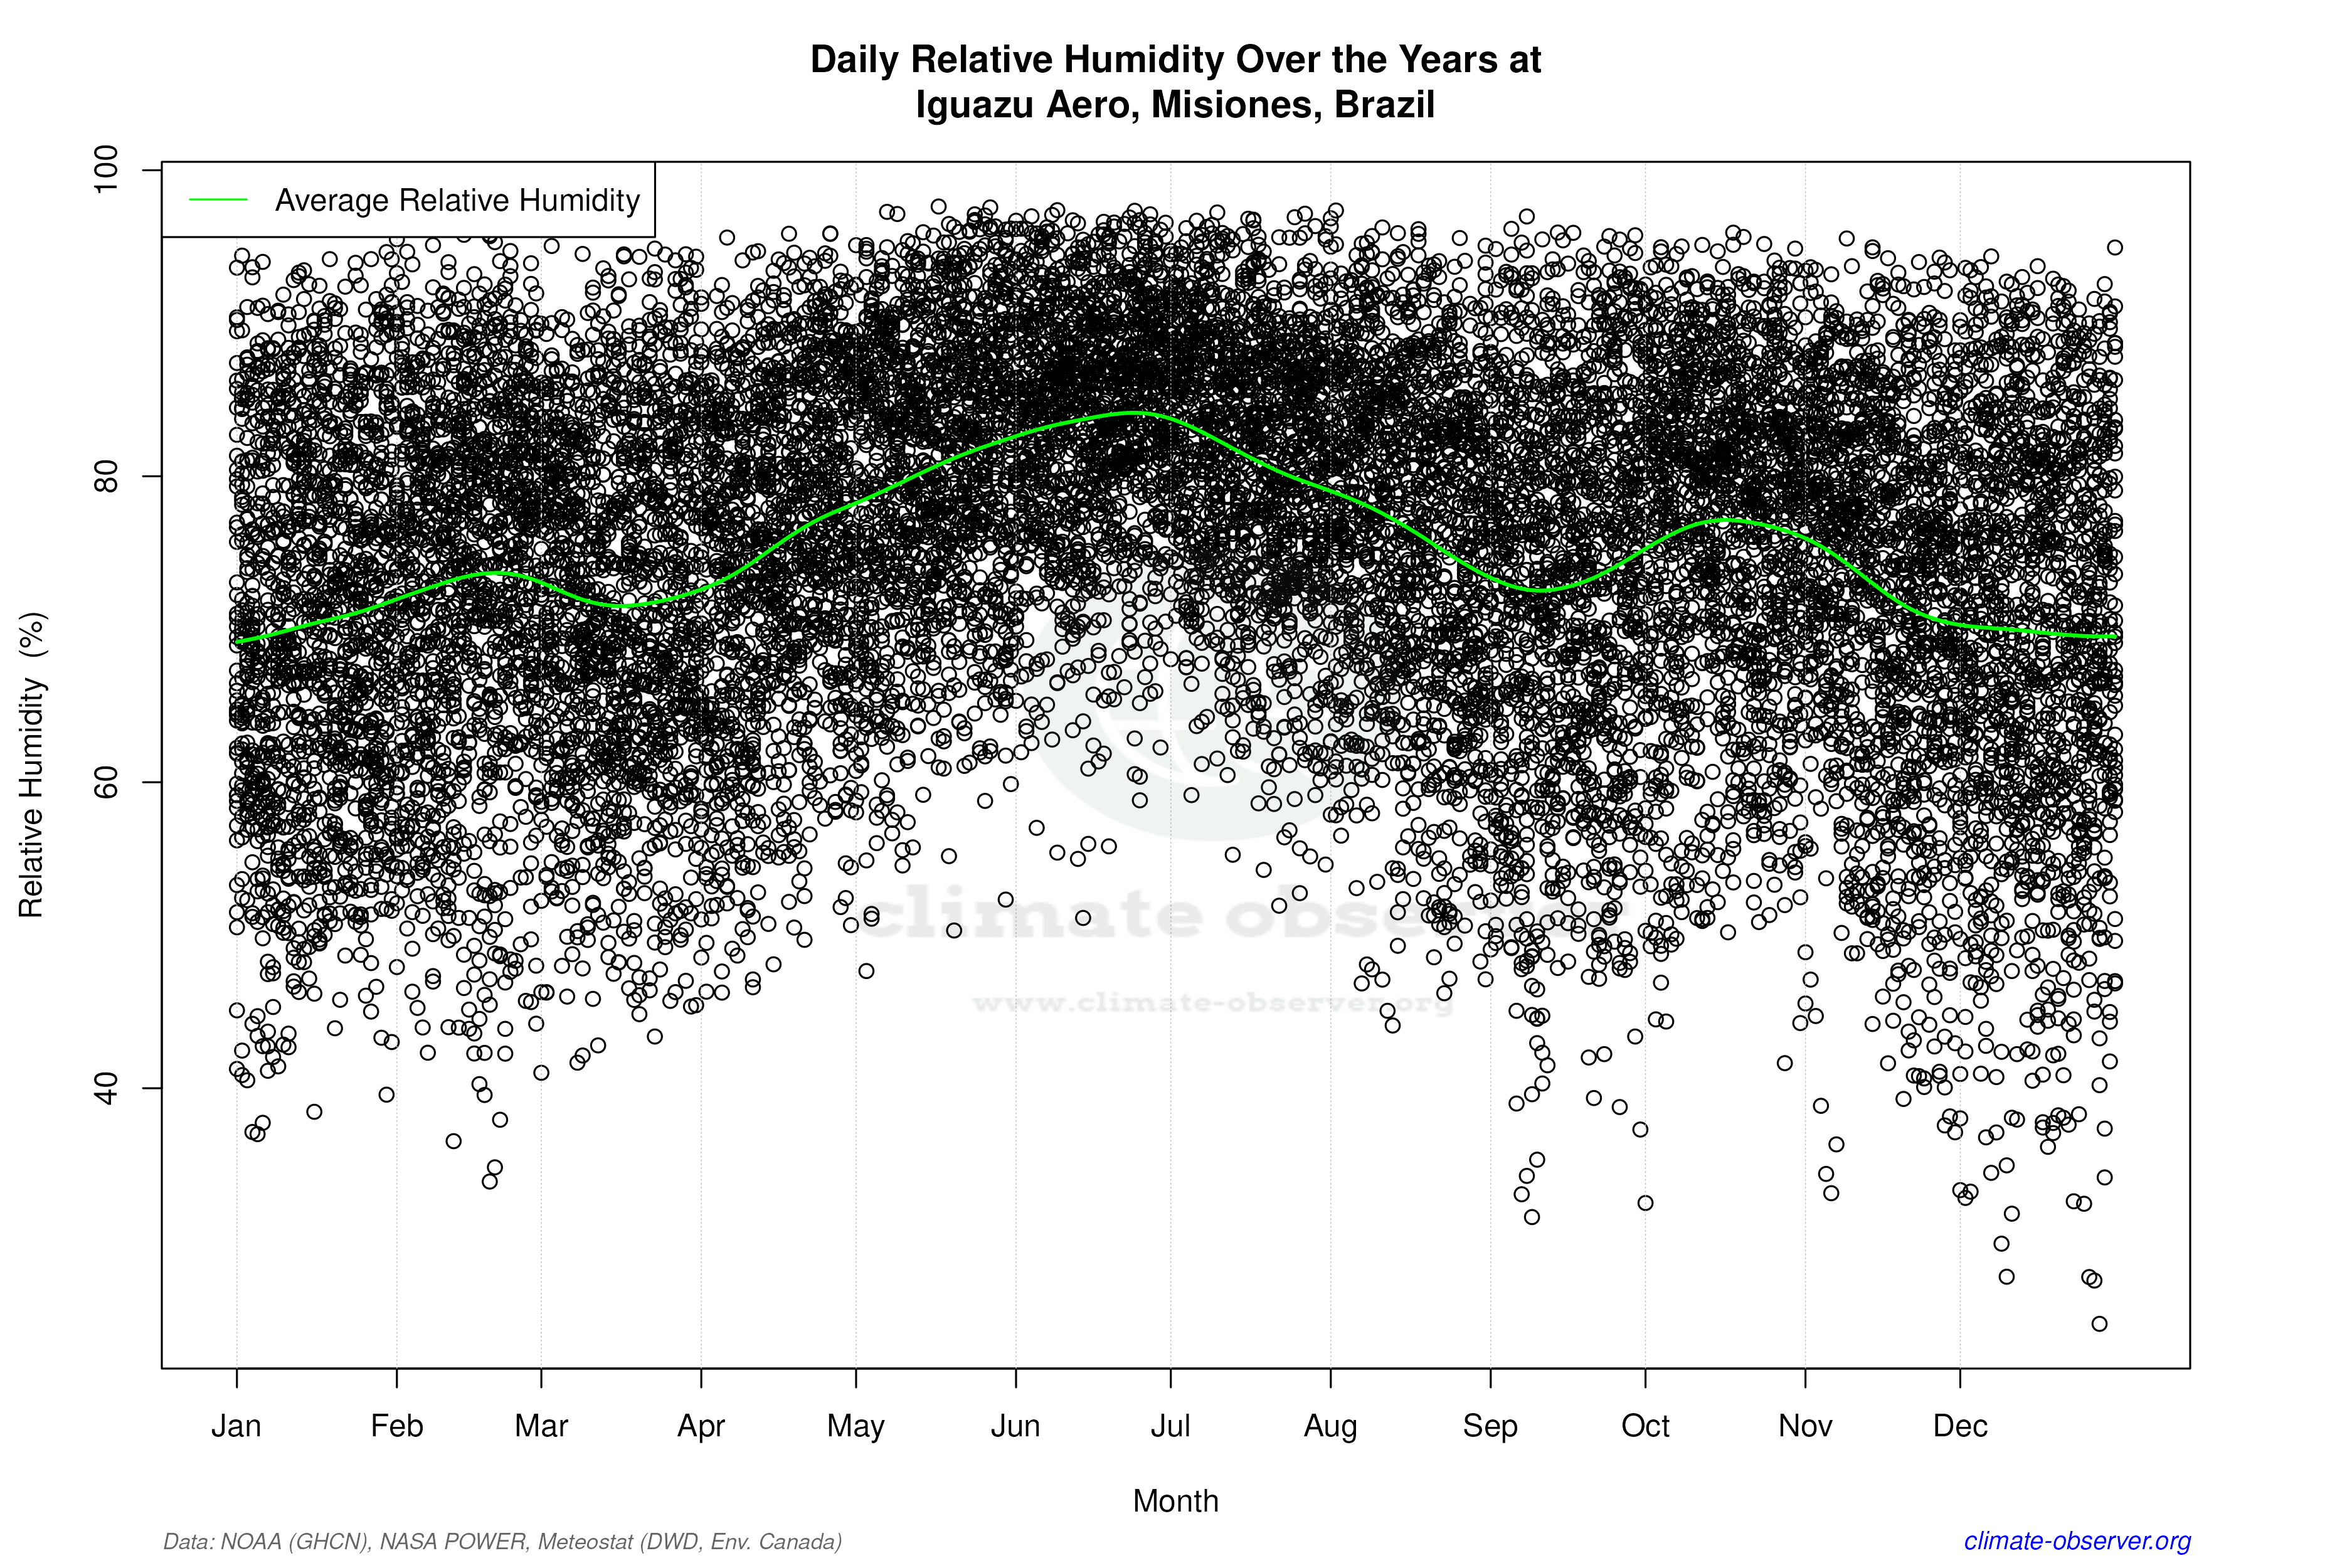
Iguazu Aero, located in Puerto Iguazú, Argentina, falls under the Köppen climate classification of Cfa, indicating a humid subtropical climate. This area is characterised by hot summers and no dry season, influenced by its proximity to the Iguazu River and the surrounding lush rainforest. The geographical positioning plays a significant role in the local climate, with the river and forest acting as moderating influences on temperature and precipitation patterns.
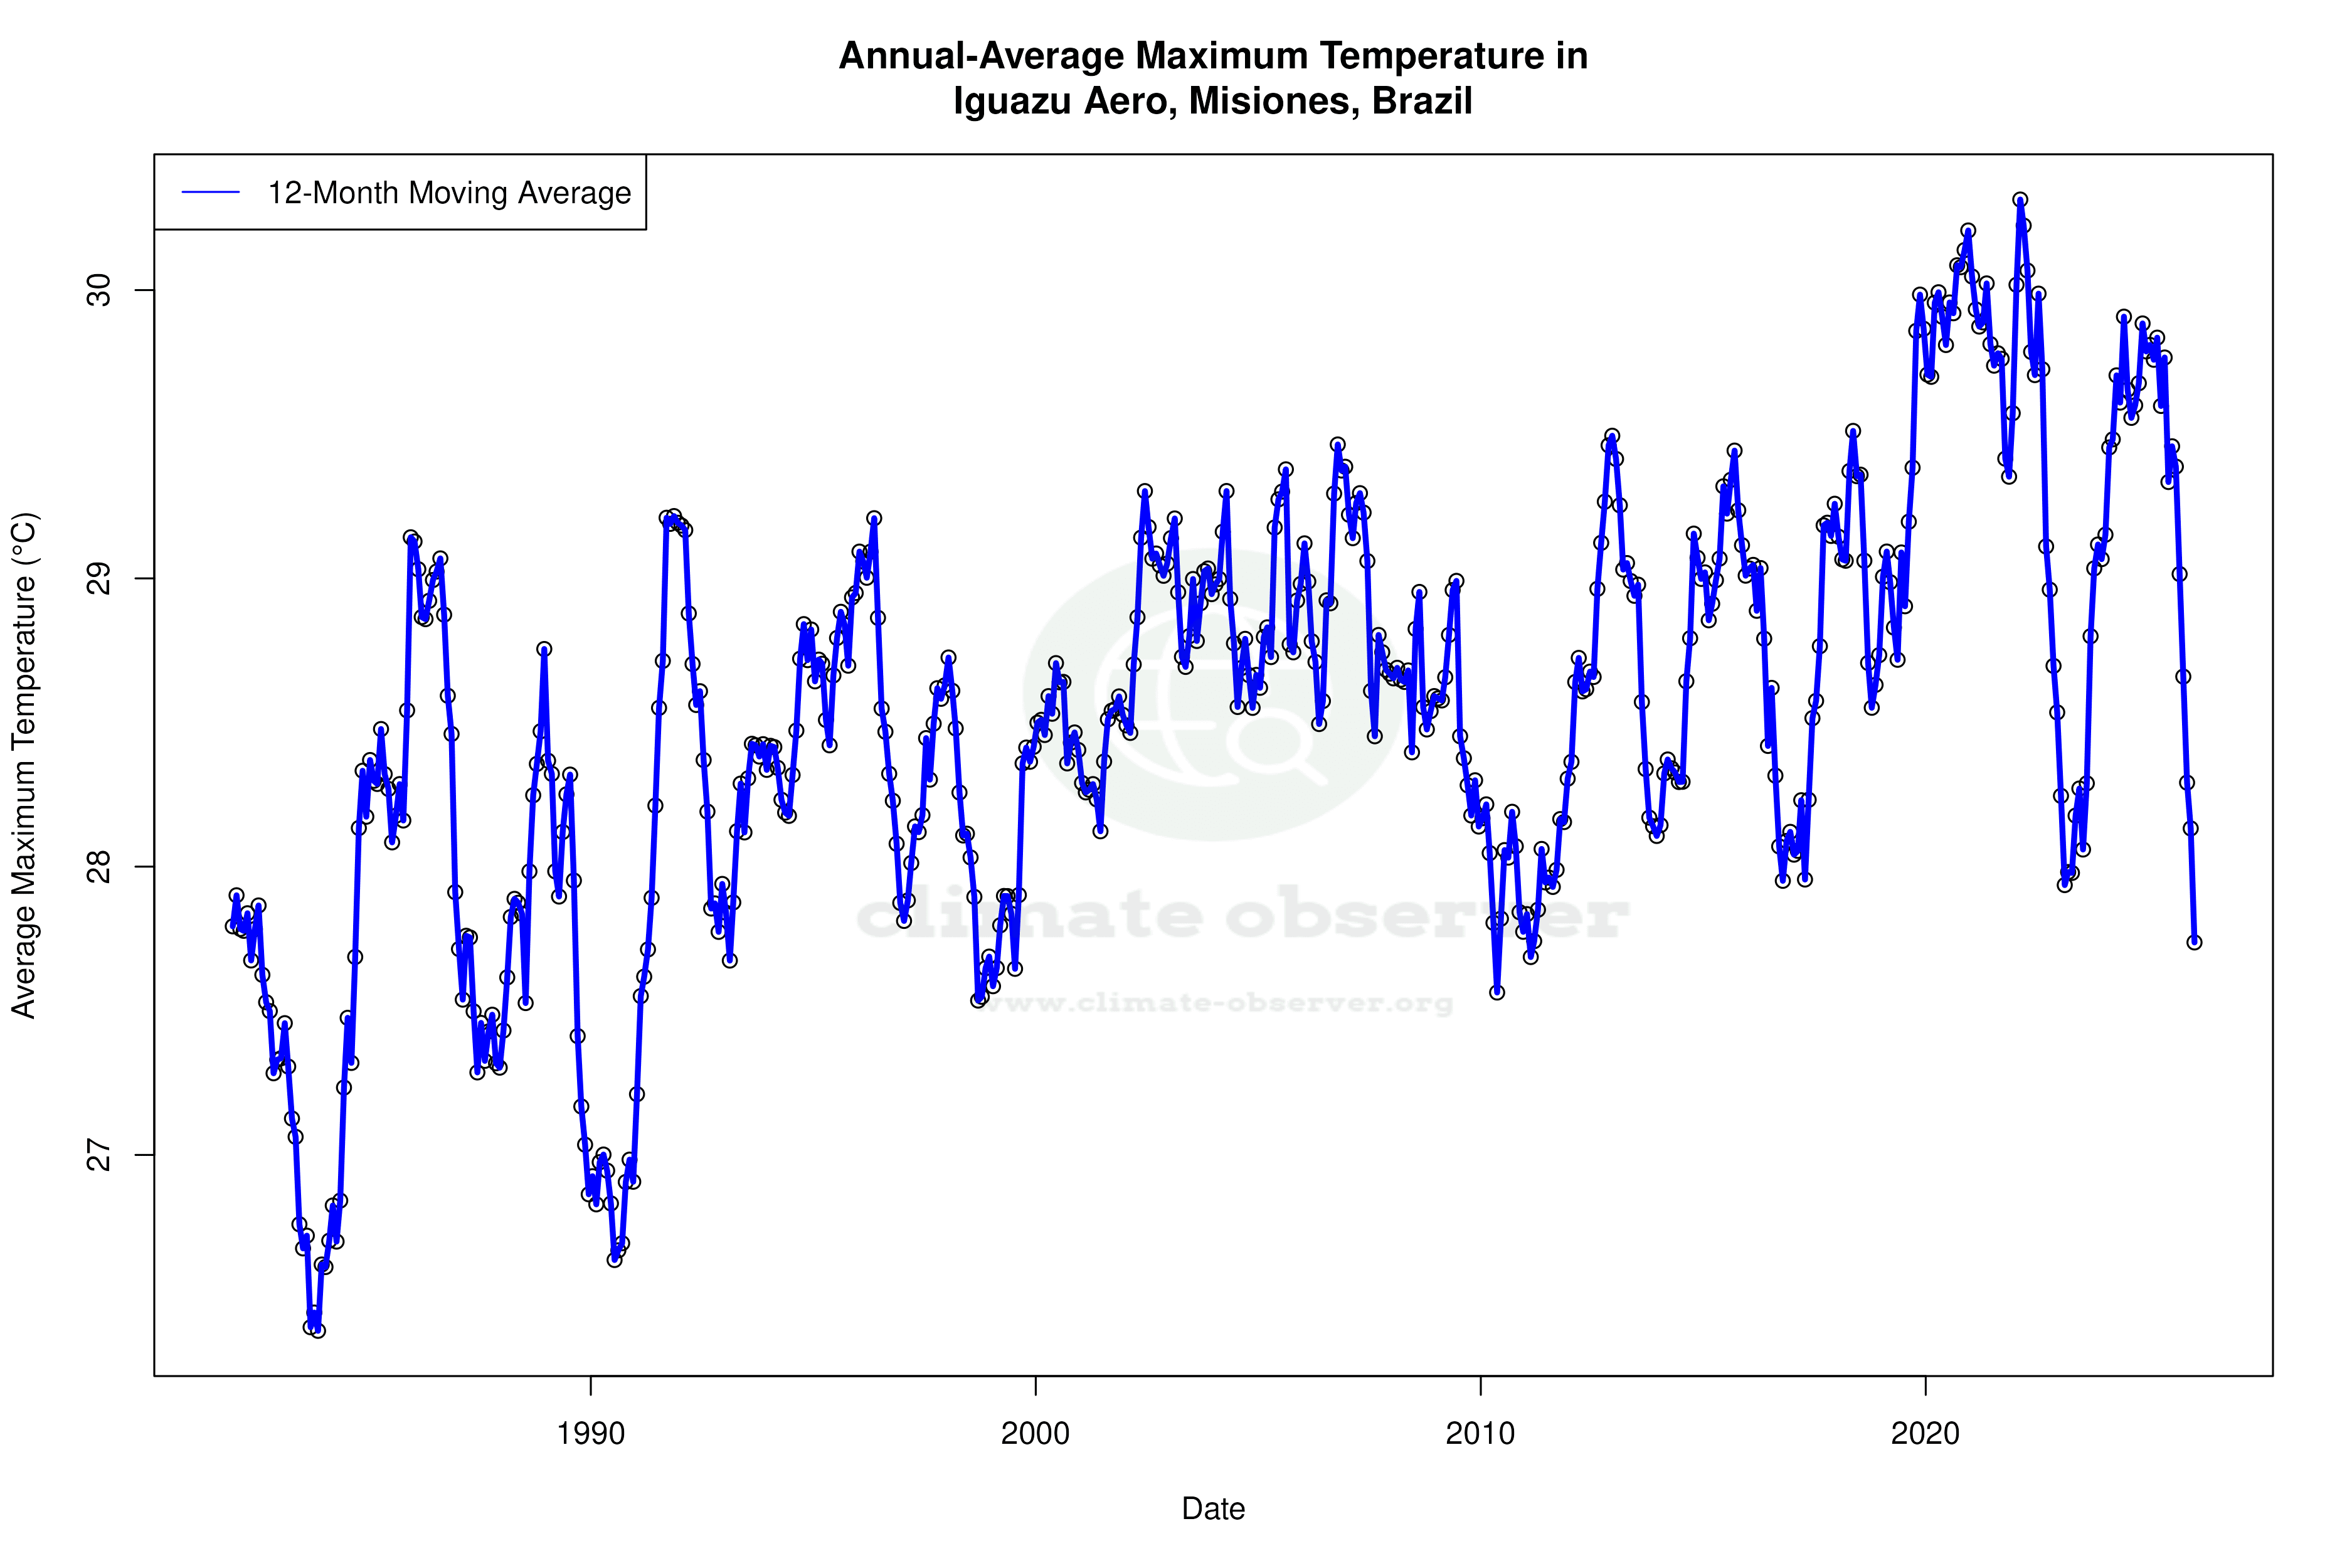
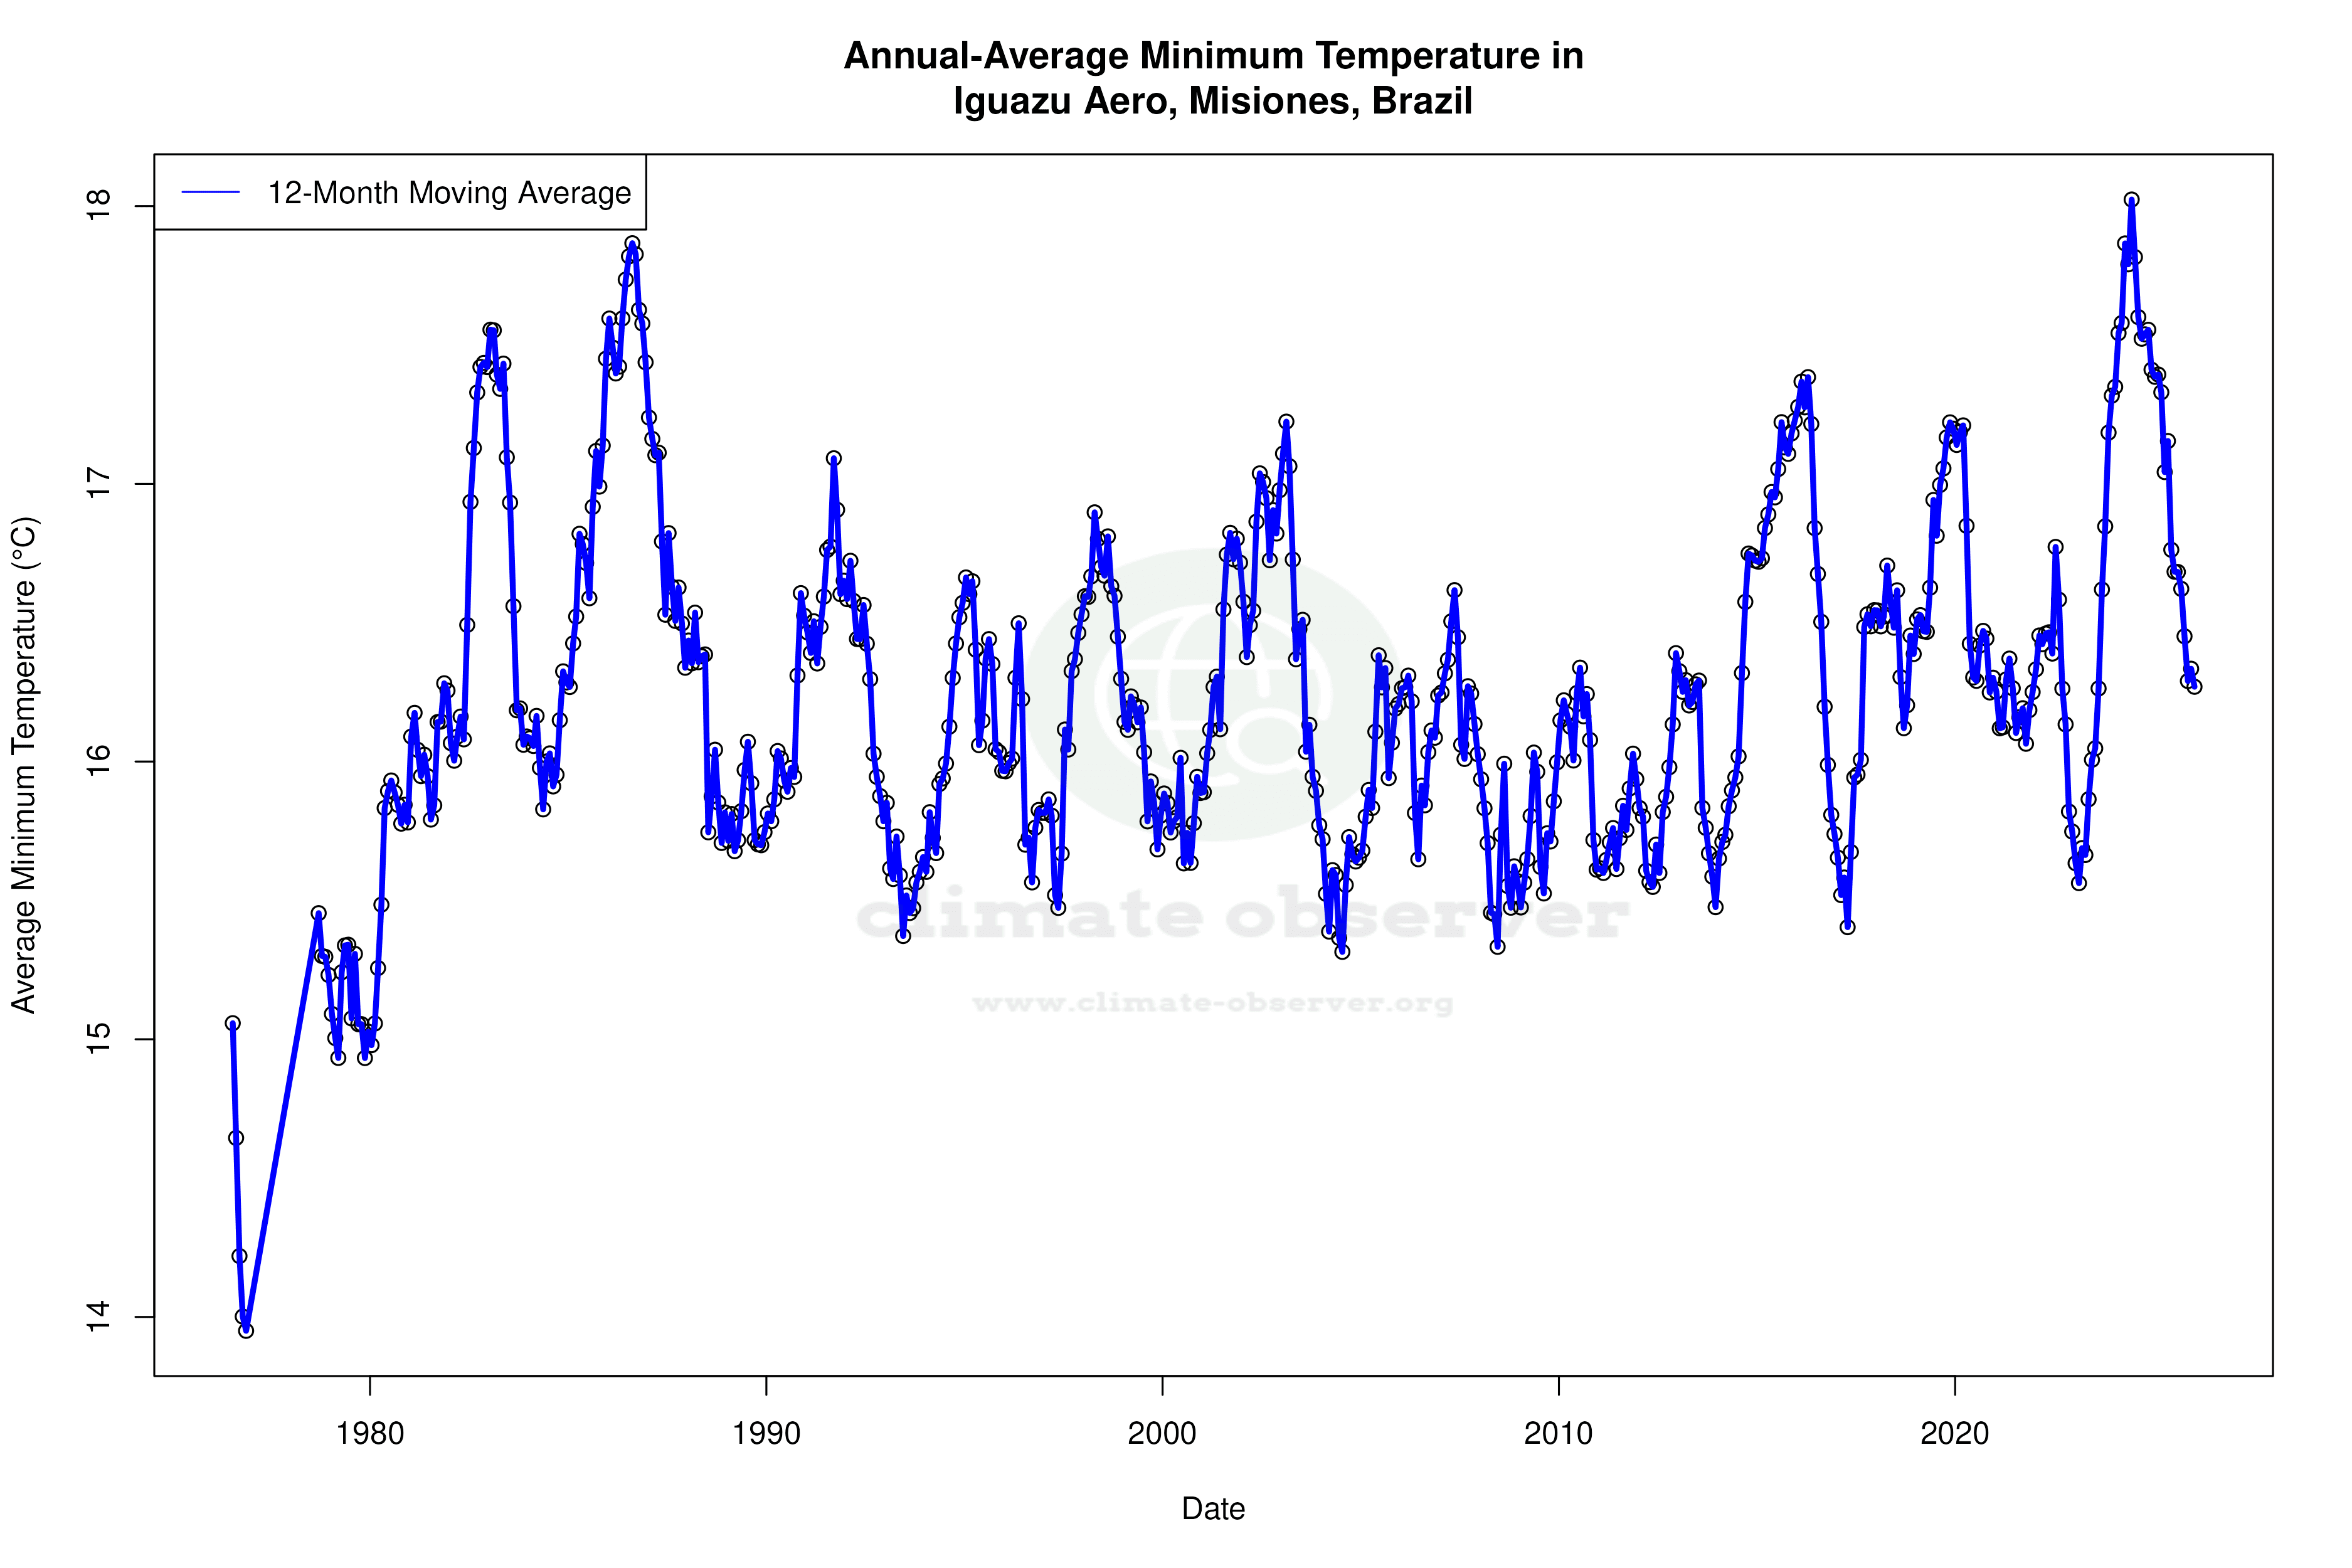
Temperature Trends: A Warming Landscape
Over the past decade, Iguazu Aero has experienced a noticeable warming trend. The 10-year trend reveals that high temperatures have increased by 0.52°C (0.94°F), while low temperatures have risen by 0.62°C (1.12°F). These trends are more pronounced than the all-time trends, which show a rise of 0.38°C (0.68°F) for highs and a modest increase of 0.09°C (0.16°F) for lows. This indicates a significant warming over the short term, possibly linked to broader regional climate patterns and human activities.
Extreme Temperature Records
The station's records highlight the extremities of its climate. The highest recorded temperature reaches 42.38°C (108.28°F), while the lowest drops to -5.00°C (23.00°F). These extremes underscore the variability inherent in a subtropical climate, where intense heat can be juxtaposed with rare but severe cold snaps.
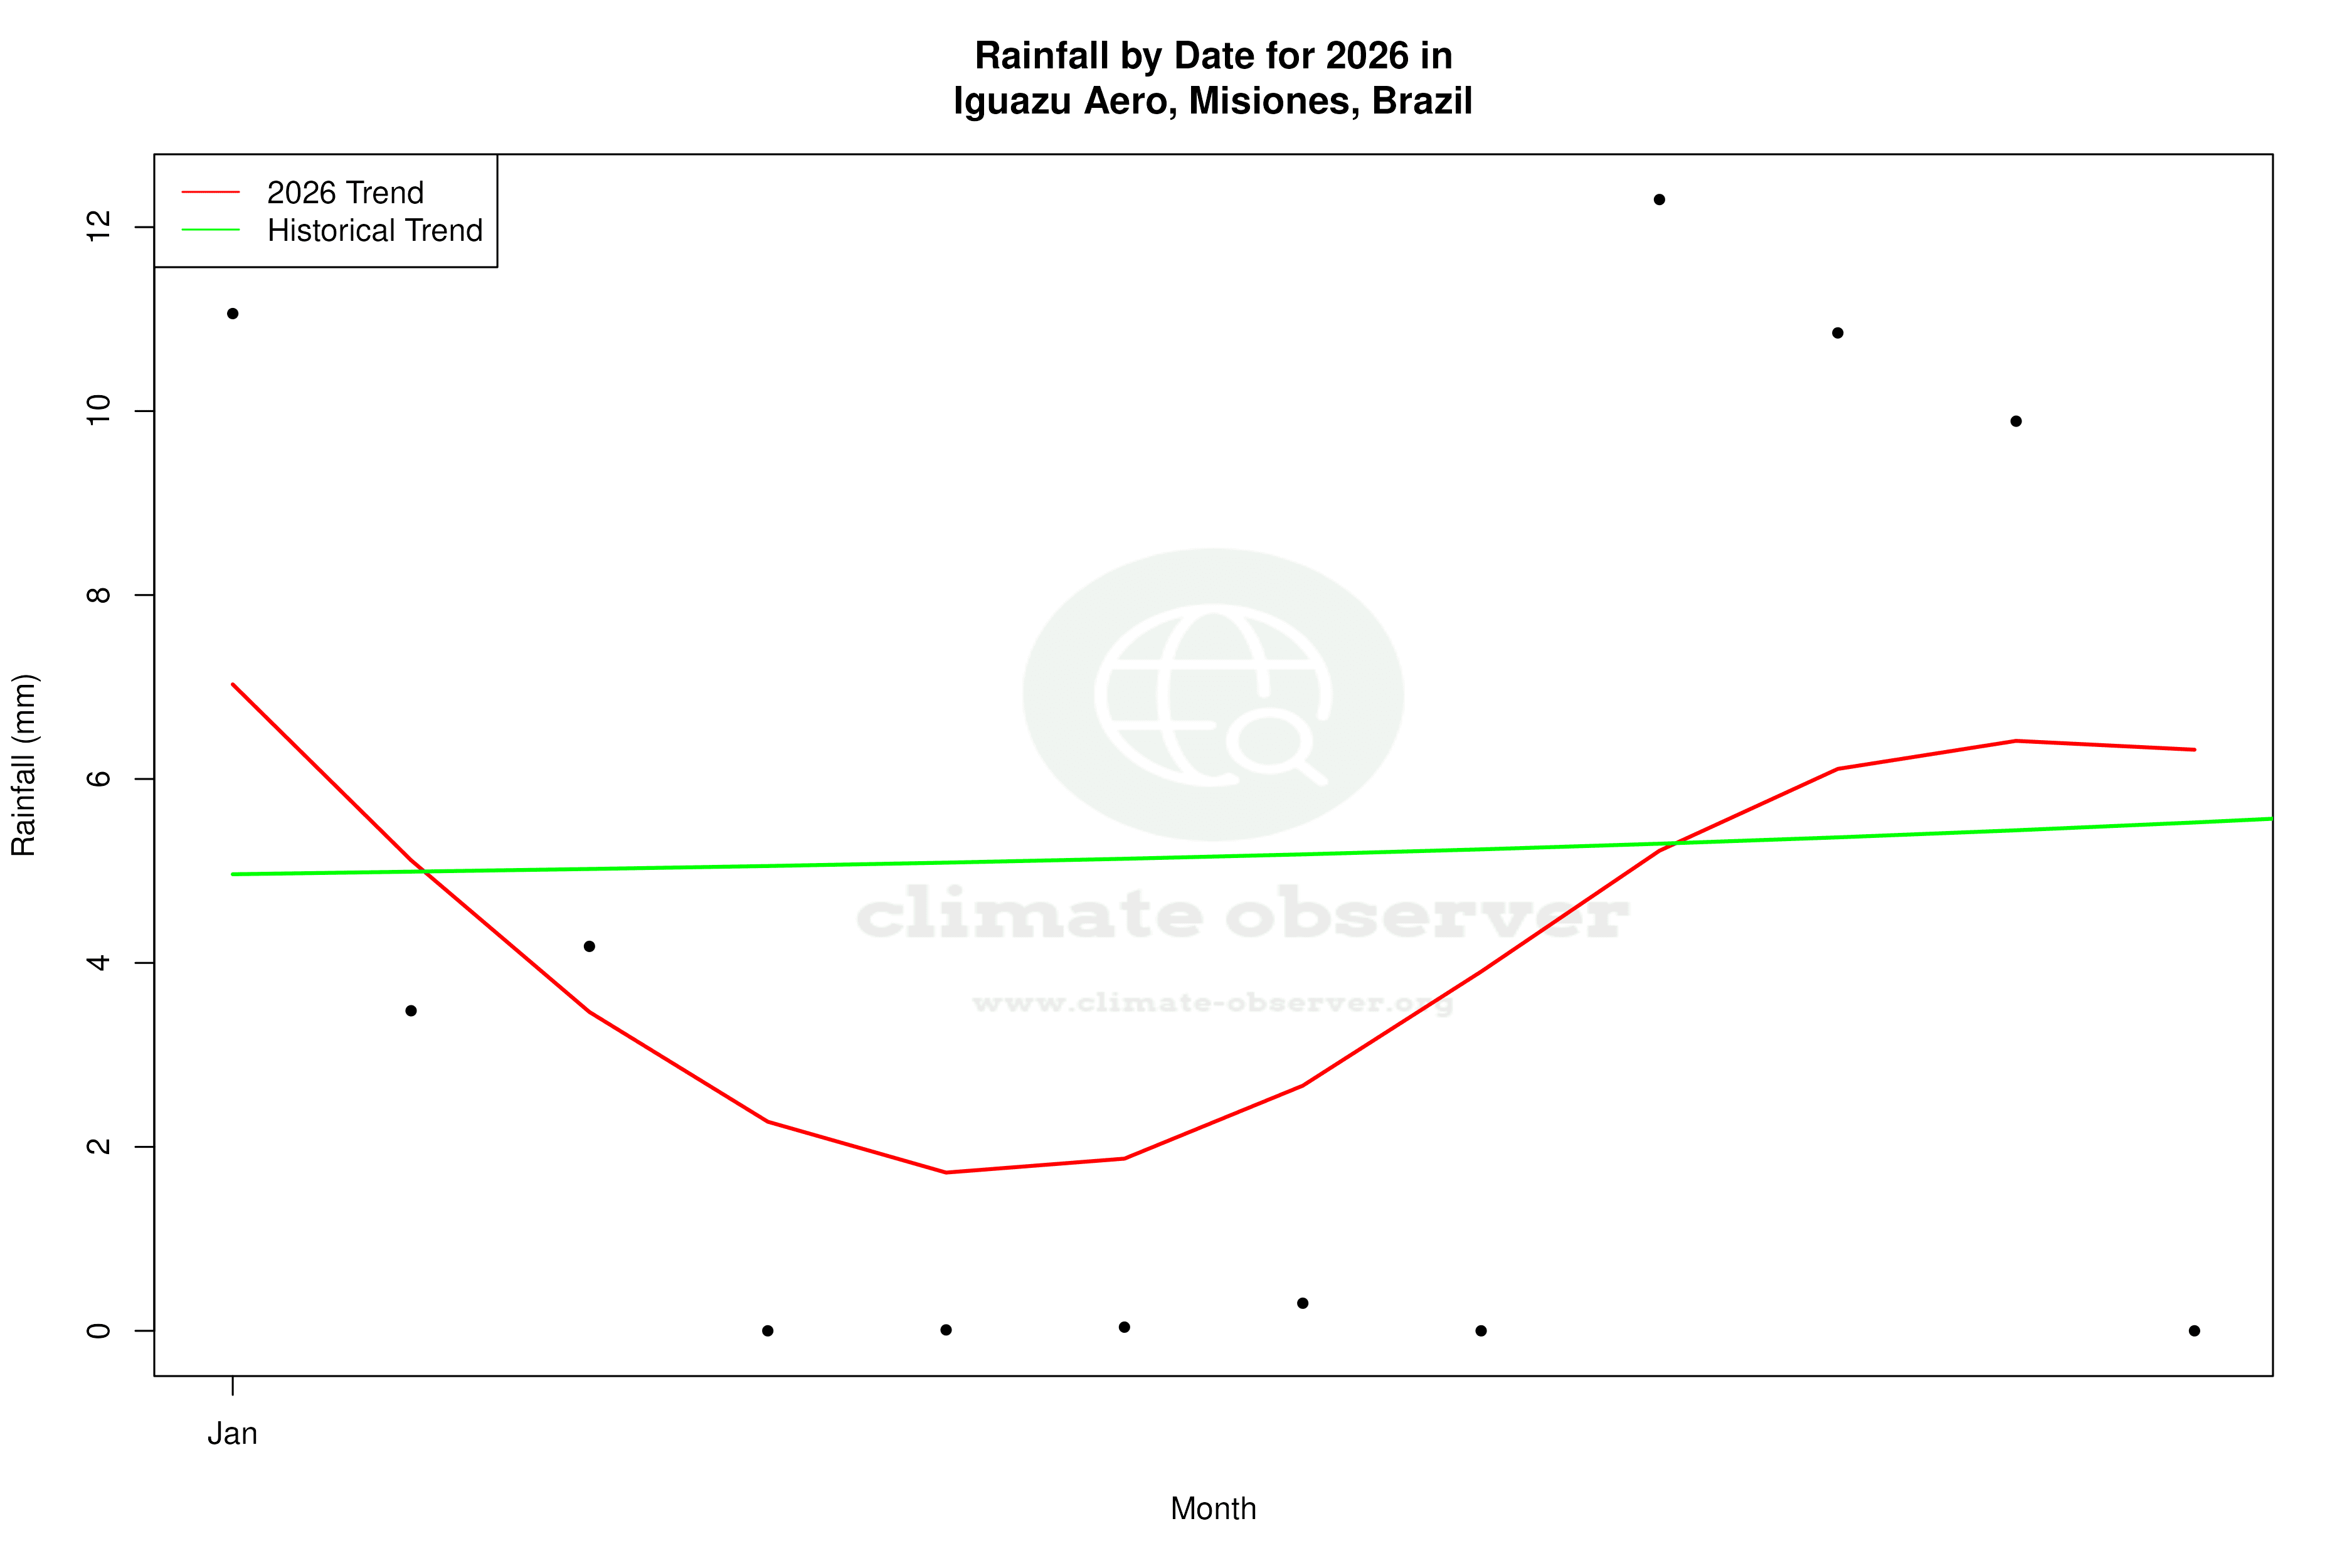
Precipitation Patterns: A Shift Towards Even Distribution
The Precipitation Concentration Index (PCI) at Iguazu Aero has decreased from a baseline of 11.92 to a current value of 9.64. This decline suggests that rainfall is now more evenly distributed throughout the year, reducing the likelihood of intense, concentrated precipitation events. Such a shift can be beneficial in mitigating flood risks and supporting sustainable water management practices, aligning with Brazil's regional climate goals to reduce the impact of extreme weather.
Regional Implications and Climate Goals
The observed climatic changes at Iguazu Aero are part of a broader regional trend towards warming and more evenly distributed precipitation. These shifts are consistent with efforts to adapt to climate change by reducing the frequency and intensity of extreme weather events. The data from Iguazu Aero provides valuable insights into the effectiveness of these initiatives and highlights the ongoing need for adaptive strategies in the face of a changing climate.
Station Statistics
10-Year Trend
High: +0.15 °F/decade
Low: +1.38 °F/decade
Rain: -0.049 in/decade
25-Year Trend
High: +0.38 °F/decade
Low: +0.52 °F/decade
Rain: -0.009 in/decade
50-Year Trend
High: +0.64 °F/decade
Low: +0.16 °F/decade
Rain: +0.008 in/decade
All-Time Trend
High: +0.64 °F/decade
Low: +0.16 °F/decade
Rain: +0.008 in/decade
Percentage Above-Average Days
Last 12 Months: 52.9%
This Year: 48.0%
Precipitation Concentration Index (PCI) ℹ️
Last 12 Months: 9.5
Historical Average: 11.5
Percentile Rank of Last 12 Months ℹ️
High: 29th percentile
Low: 71st percentile
Rain: 36th percentile
Change in Variance ℹ️
High: -1.4%
Low: -9.4%
Intraday: -0.4%
Data Coverage
74.6%
First Year of Data
1965
Station Location
Historical Weather Records
| Max High | Avg High | Min High | Max Avg | Avg Avg | Min Avg | Max Low | Avg Low | Min Low | Max Precipitation | Avg Precipitation | Max Snow | Avg Snow | |
|---|---|---|---|---|---|---|---|---|---|---|---|---|---|
| Record | 108.28 °F | — | 46.40 °F | 93.56 °F | — | 35.96 °F | 84.27 °F | — | 23.00 °F | 11.81 in | — | — | — |
| January | 105.08 °F | 91.09 °F | 71.60 °F | 93.56 °F | 78.97 °F | 64.94 °F | 80.24 °F | 69.30 °F | 51.98 °F | 7.09 in | 0.23 in | — | — |
| February | 102.20 °F | 89.87 °F | 71.64 °F | 90.86 °F | 78.38 °F | 64.58 °F | 78.80 °F | 68.93 °F | 52.16 °F | 5.52 in | 0.22 in | — | — |
| March | 104.00 °F | 88.71 °F | 71.60 °F | 89.60 °F | 76.54 °F | 57.74 °F | 79.09 °F | 66.92 °F | 46.04 °F | 5.91 in | 0.19 in | — | — |
| April | 102.20 °F | 83.58 °F | 59.72 °F | 86.00 °F | 71.53 °F | 48.74 °F | 76.51 °F | 62.30 °F | 35.60 °F | 5.12 in | 0.21 in | — | — |
| May | 95.00 °F | 76.16 °F | 54.68 °F | 84.38 °F | 64.66 °F | 40.82 °F | 73.02 °F | 55.73 °F | 32.00 °F | 7.40 in | 0.23 in | — | — |
| June | 87.80 °F | 72.99 °F | 50.00 °F | 78.08 °F | 61.65 °F | 40.64 °F | 74.48 °F | 52.67 °F | 28.40 °F | 4.71 in | 0.19 in | — | — |
| July | 89.60 °F | 73.69 °F | 46.40 °F | 81.14 °F | 61.21 °F | 35.96 °F | 73.40 °F | 51.24 °F | 23.00 °F | 3.43 in | 0.14 in | — | — |
| August | 97.16 °F | 78.62 °F | 51.08 °F | 87.26 °F | 64.76 °F | 41.00 °F | 71.60 °F | 53.70 °F | 23.00 °F | 3.94 in | 0.13 in | — | — |
| September | 103.82 °F | 81.86 °F | 51.62 °F | 89.42 °F | 68.26 °F | 44.78 °F | 75.02 °F | 57.21 °F | 28.94 °F | 11.81 in | 0.20 in | — | — |
| October | 104.18 °F | 85.06 °F | 60.80 °F | 88.16 °F | 72.17 °F | 52.16 °F | 76.10 °F | 61.89 °F | 39.20 °F | 6.60 in | 0.30 in | — | — |
| November | 106.30 °F | 88.02 °F | 66.38 °F | 91.04 °F | 75.22 °F | 56.12 °F | 77.13 °F | 64.13 °F | 42.08 °F | 5.12 in | 0.24 in | — | — |
| December | 108.28 °F | 90.26 °F | 69.80 °F | 90.68 °F | 78.00 °F | 63.14 °F | 84.27 °F | 67.56 °F | 48.20 °F | 6.69 in | 0.25 in | — | — |
Data Visualisations
Remove WatermarksCurrent Year Climate Trends vs Historical


Max Temperature this Year | 1 of 6
Climate 12-Month Moving Averages


Max Temperature 12-Month MA | 1 of 6
Daily Data Points and Averages Throughout the Year


Average Max Temperature Throughout Year | 1 of 5
