Climate for Station: Sao Paulo Aeroport, Sao Paulo, Brazil
Loading live weather...
Climate Analysis & Overview
São Paulo Aeroport's climate is marked by a warming trend in high temperatures over both the past decade and all-time records, while lows show a slight cooling in recent years. Precipitation is becoming more concentrated, indicating a shift towards fewer but more intense rainfall events. These changes reflect broader regional climate dynamics and challenges.
Warming Highs and Steady Lows
São Paulo Aeroport, located at the heart of Brazil's bustling São Paulo region, exhibits a complex climate profile. With a Köppen classification of Cfa, the area experiences a humid subtropical climate, characterised by hot, humid summers and mild winters. Over the past decade, high temperatures have risen by 1.76°C (3.17°F), indicating a significant warming trend. In contrast, the low temperatures have shown a slight cooling, with a decrease of 0.04°C (0.07°F). This divergence between highs and lows suggests a shift in thermal dynamics, possibly influenced by urban heat island effects and regional weather patterns.
Long-term Temperature Trends
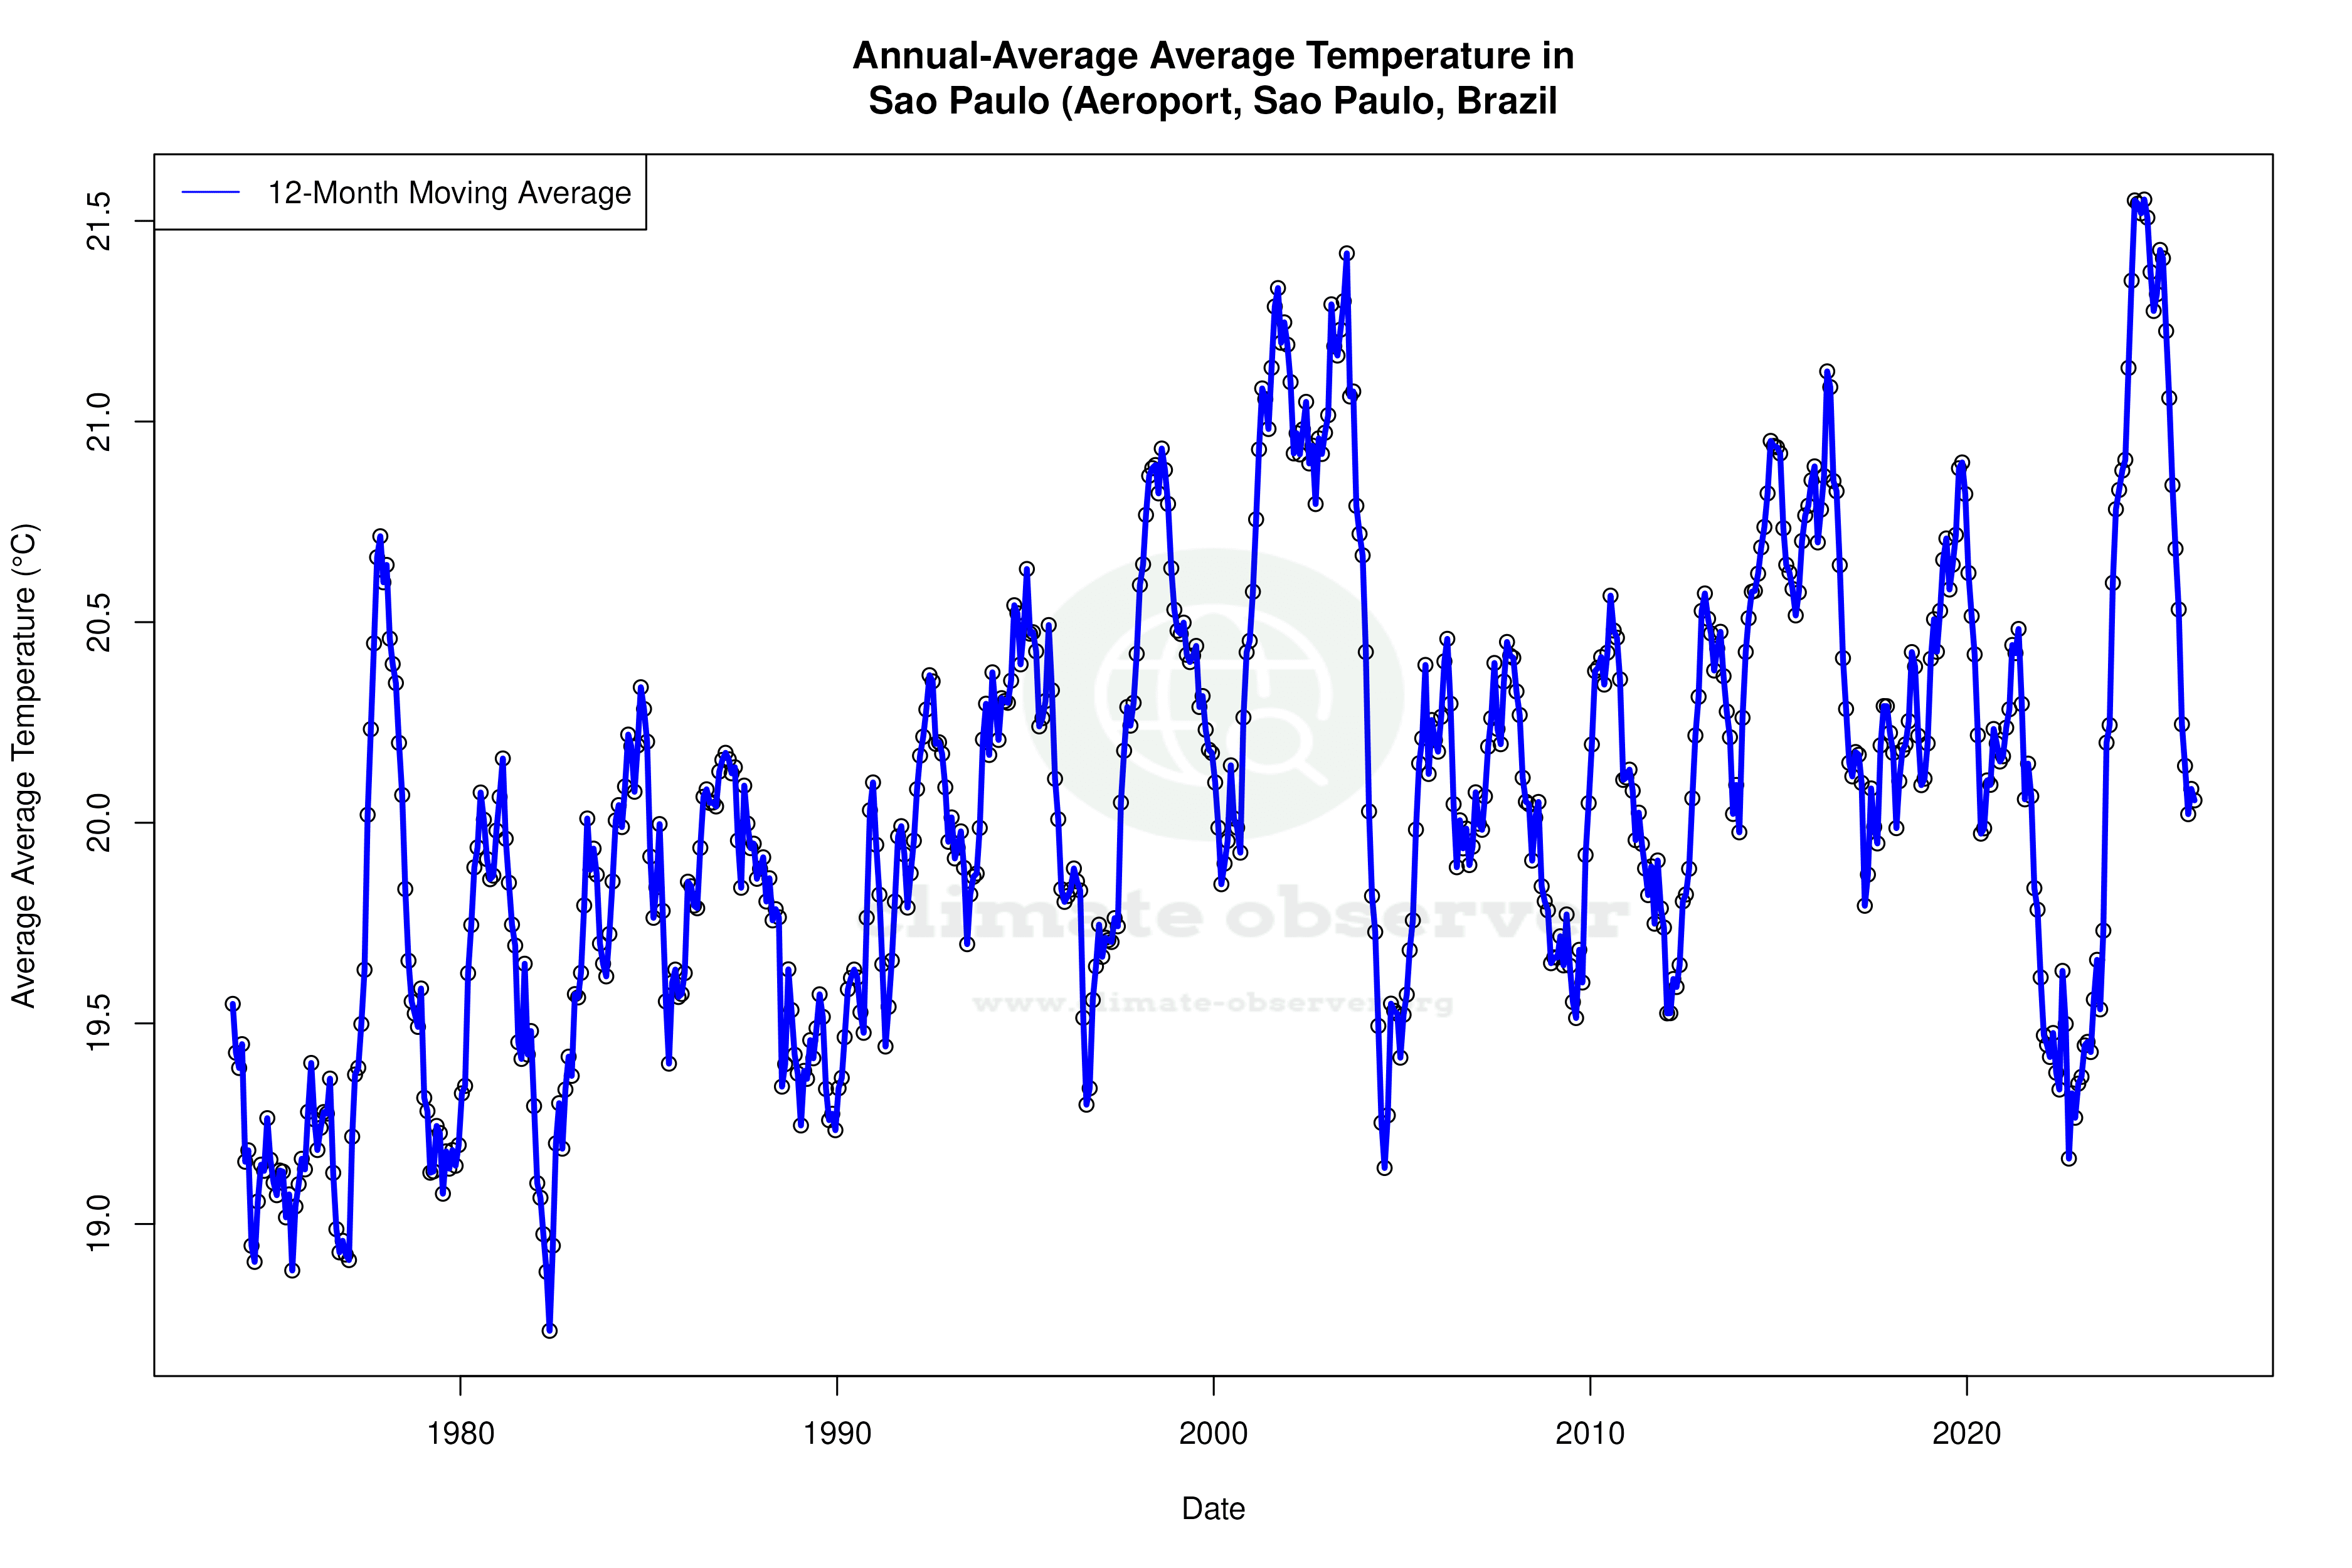
When examining the all-time temperature trends, a warming pattern emerges for both highs and lows. The high temperatures have increased by 0.23°C (0.41°F), while lows have risen by 0.33°C (0.59°F). These figures suggest a gradual warming over the years, consistent with global climate change patterns. The record high temperature at the station stands at 37.0°C (98.6°F), while the record low is -0.12°C (31.8°F). These extremes highlight the variability and potential for both heatwaves and cold snaps in the region.
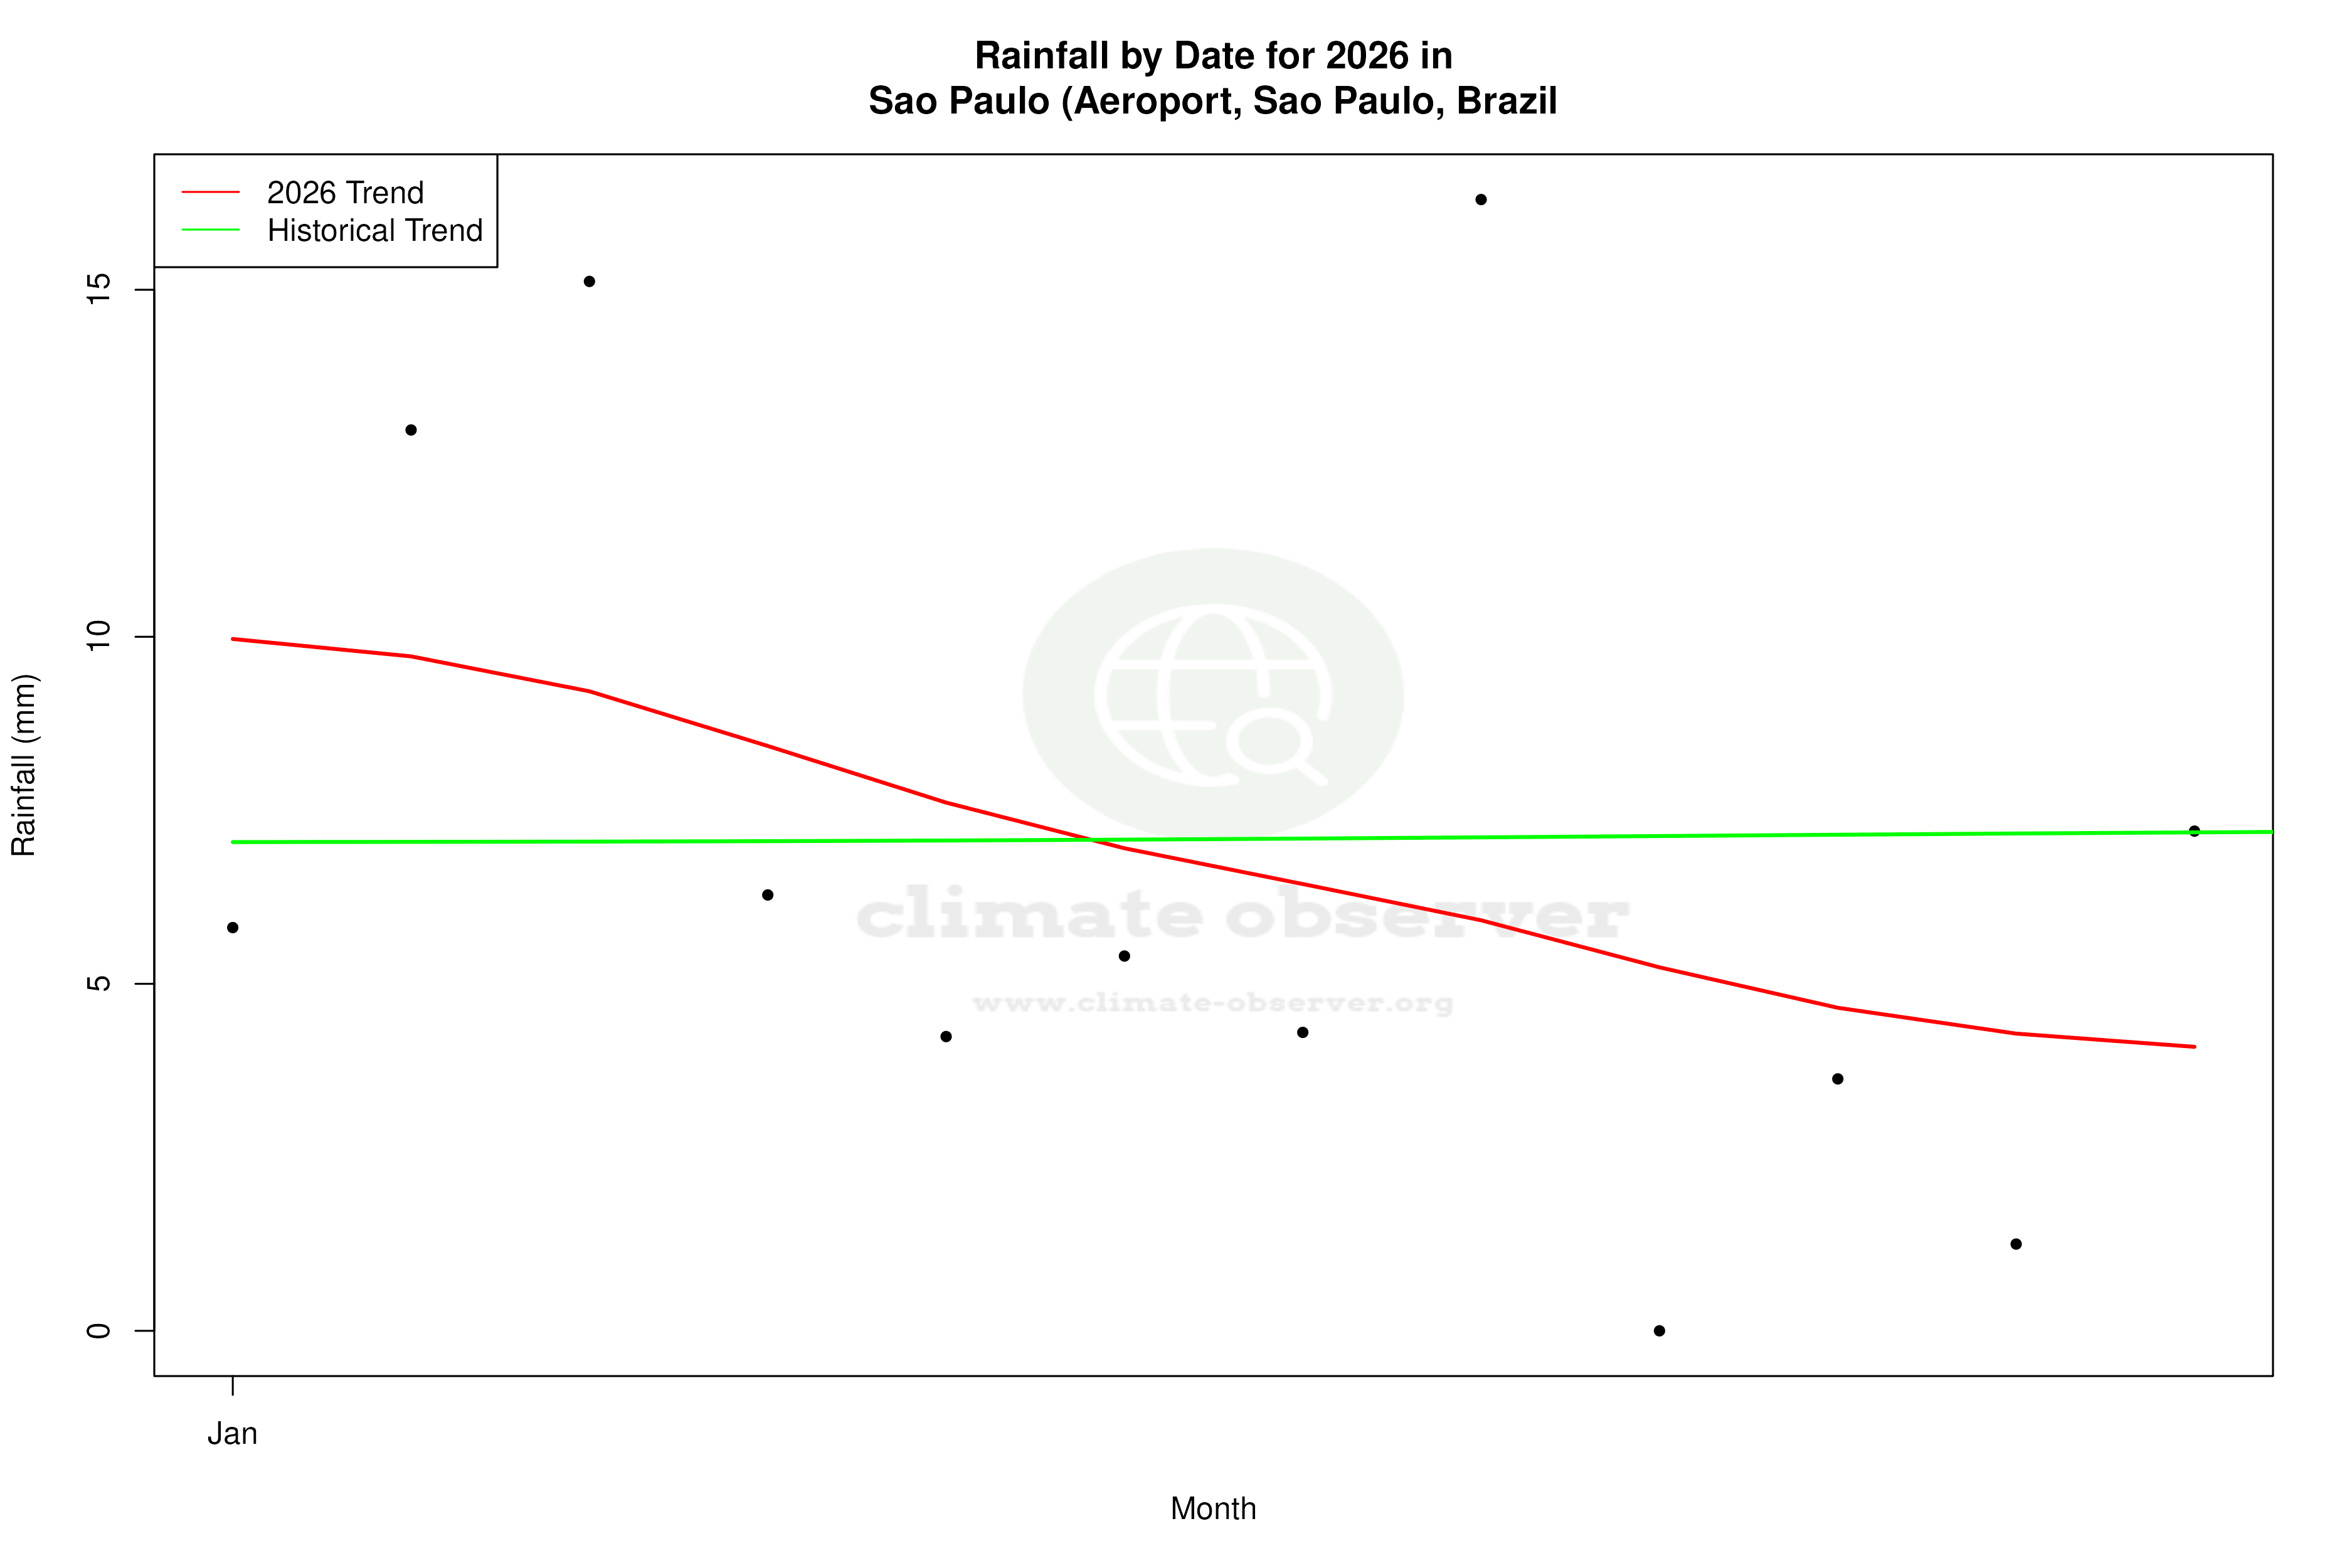
Intensifying Rainfall Events
The Precipitation Concentration Index (PCI) at São Paulo Aeroport has increased from a baseline of 12.9 to a current value of 14.4. The PCI measures how precipitation is distributed over time; an increase indicates that rain is falling in fewer, more intense events. This shift towards concentrated rainfall can lead to challenges such as urban flooding and water management issues. Although the current PCI is not highly concentrated, the trend suggests a move towards more extreme precipitation events.
Regional Climate Context
São Paulo's climate is influenced by its geographical setting, nestled between the Atlantic Ocean and the Serra do Mar mountain range. These features contribute to the area's humidity and precipitation patterns. The observed climate trends at São Paulo Aeroport align with Brazil's broader climate goals, which focus on mitigating the impacts of climate change through sustainable urban planning and infrastructure development. Recent weather events, such as severe storms and heatwaves, underscore the importance of these initiatives.
Implications for the Future
The climate data from São Paulo Aeroport provides valuable insights into the region's evolving weather patterns. The warming trend in high temperatures, coupled with more concentrated rainfall, poses challenges for urban resilience and sustainability. As the city continues to grow, understanding these climate dynamics will be crucial for planning and adaptation efforts.
Station Statistics
10-Year Trend
High: +2.77 °F/decade
Low: -0.04 °F/decade
Rain: +0.000 in/decade
25-Year Trend
High: -0.43 °F/decade
Low: +0.04 °F/decade
Rain: -0.029 in/decade
50-Year Trend
High: +0.39 °F/decade
Low: +0.57 °F/decade
Rain: -0.009 in/decade
All-Time Trend
High: +0.39 °F/decade
Low: +0.57 °F/decade
Rain: +0.000 in/decade
Percentage Above-Average Days
Last 12 Months: 43.8%
This Year: 35.5%
Precipitation Concentration Index (PCI) ℹ️
Last 12 Months: 12.6
Historical Average: 13.5
Percentile Rank of Last 12 Months ℹ️
High: 50th percentile
Low: 64th percentile
Rain: 16th percentile
Change in Variance ℹ️
High: +4.3%
Low: -11.4%
Intraday: +1.8%
Data Coverage
66.5%
First Year of Data
1936
Station Location
Historical Weather Records
| Max High | Avg High | Min High | Max Avg | Avg Avg | Min Avg | Max Low | Avg Low | Min Low | Max Precipitation | Avg Precipitation | Max Snow | Avg Snow | |
|---|---|---|---|---|---|---|---|---|---|---|---|---|---|
| Record | 98.60 °F | — | 48.20 °F | 89.24 °F | — | 40.46 °F | 78.62 °F | — | 31.78 °F | 5.21 in | — | — | — |
| January | 95.00 °F | 82.59 °F | 64.40 °F | 84.74 °F | 73.07 °F | 59.72 °F | 76.64 °F | 67.04 °F | 50.68 °F | 4.49 in | 0.28 in | — | — |
| February | 95.72 °F | 83.28 °F | 66.20 °F | 84.38 °F | 73.73 °F | 62.46 °F | 78.62 °F | 67.48 °F | 55.76 °F | 5.21 in | 0.28 in | — | — |
| March | 96.80 °F | 81.72 °F | 64.40 °F | 84.38 °F | 72.28 °F | 60.62 °F | 78.44 °F | 66.19 °F | 52.83 °F | 5.19 in | 0.19 in | — | — |
| April | 90.86 °F | 78.68 °F | 60.80 °F | 83.30 °F | 69.33 °F | 56.66 °F | 73.40 °F | 63.31 °F | 44.10 °F | 3.15 in | 0.10 in | — | — |
| May | 91.18 °F | 74.23 °F | 54.68 °F | 80.06 °F | 65.10 °F | 44.96 °F | 72.32 °F | 58.87 °F | 41.00 °F | 4.14 in | 0.08 in | — | — |
| June | 84.74 °F | 72.89 °F | 53.28 °F | 81.14 °F | 63.19 °F | 47.12 °F | 71.24 °F | 56.32 °F | 33.62 °F | 2.58 in | 0.06 in | — | — |
| July | 86.00 °F | 72.92 °F | 48.20 °F | 76.82 °F | 62.48 °F | 40.46 °F | 68.90 °F | 55.01 °F | 31.78 °F | 2.83 in | 0.05 in | — | — |
| August | 92.12 °F | 75.59 °F | 51.80 °F | 81.50 °F | 63.90 °F | 45.32 °F | 71.60 °F | 56.22 °F | 33.44 °F | 1.75 in | 0.04 in | — | — |
| September | 96.80 °F | 77.25 °F | 53.60 °F | 84.02 °F | 65.32 °F | 48.92 °F | 73.22 °F | 58.40 °F | 41.00 °F | 3.70 in | 0.10 in | — | — |
| October | 98.24 °F | 79.03 °F | 56.46 °F | 87.98 °F | 67.55 °F | 53.06 °F | 76.10 °F | 61.02 °F | 46.40 °F | 3.46 in | 0.14 in | — | — |
| November | 98.60 °F | 79.92 °F | 57.20 °F | 87.62 °F | 69.26 °F | 54.50 °F | 75.02 °F | 62.82 °F | 49.39 °F | 2.68 in | 0.16 in | — | — |
| December | 96.80 °F | 81.84 °F | 60.80 °F | 89.24 °F | 71.67 °F | 59.18 °F | 77.00 °F | 65.49 °F | 53.20 °F | 4.66 in | 0.21 in | — | — |
Data Visualisations
Remove WatermarksCurrent Year Climate Trends vs Historical


Max Temperature this Year | 1 of 6
Climate 12-Month Moving Averages
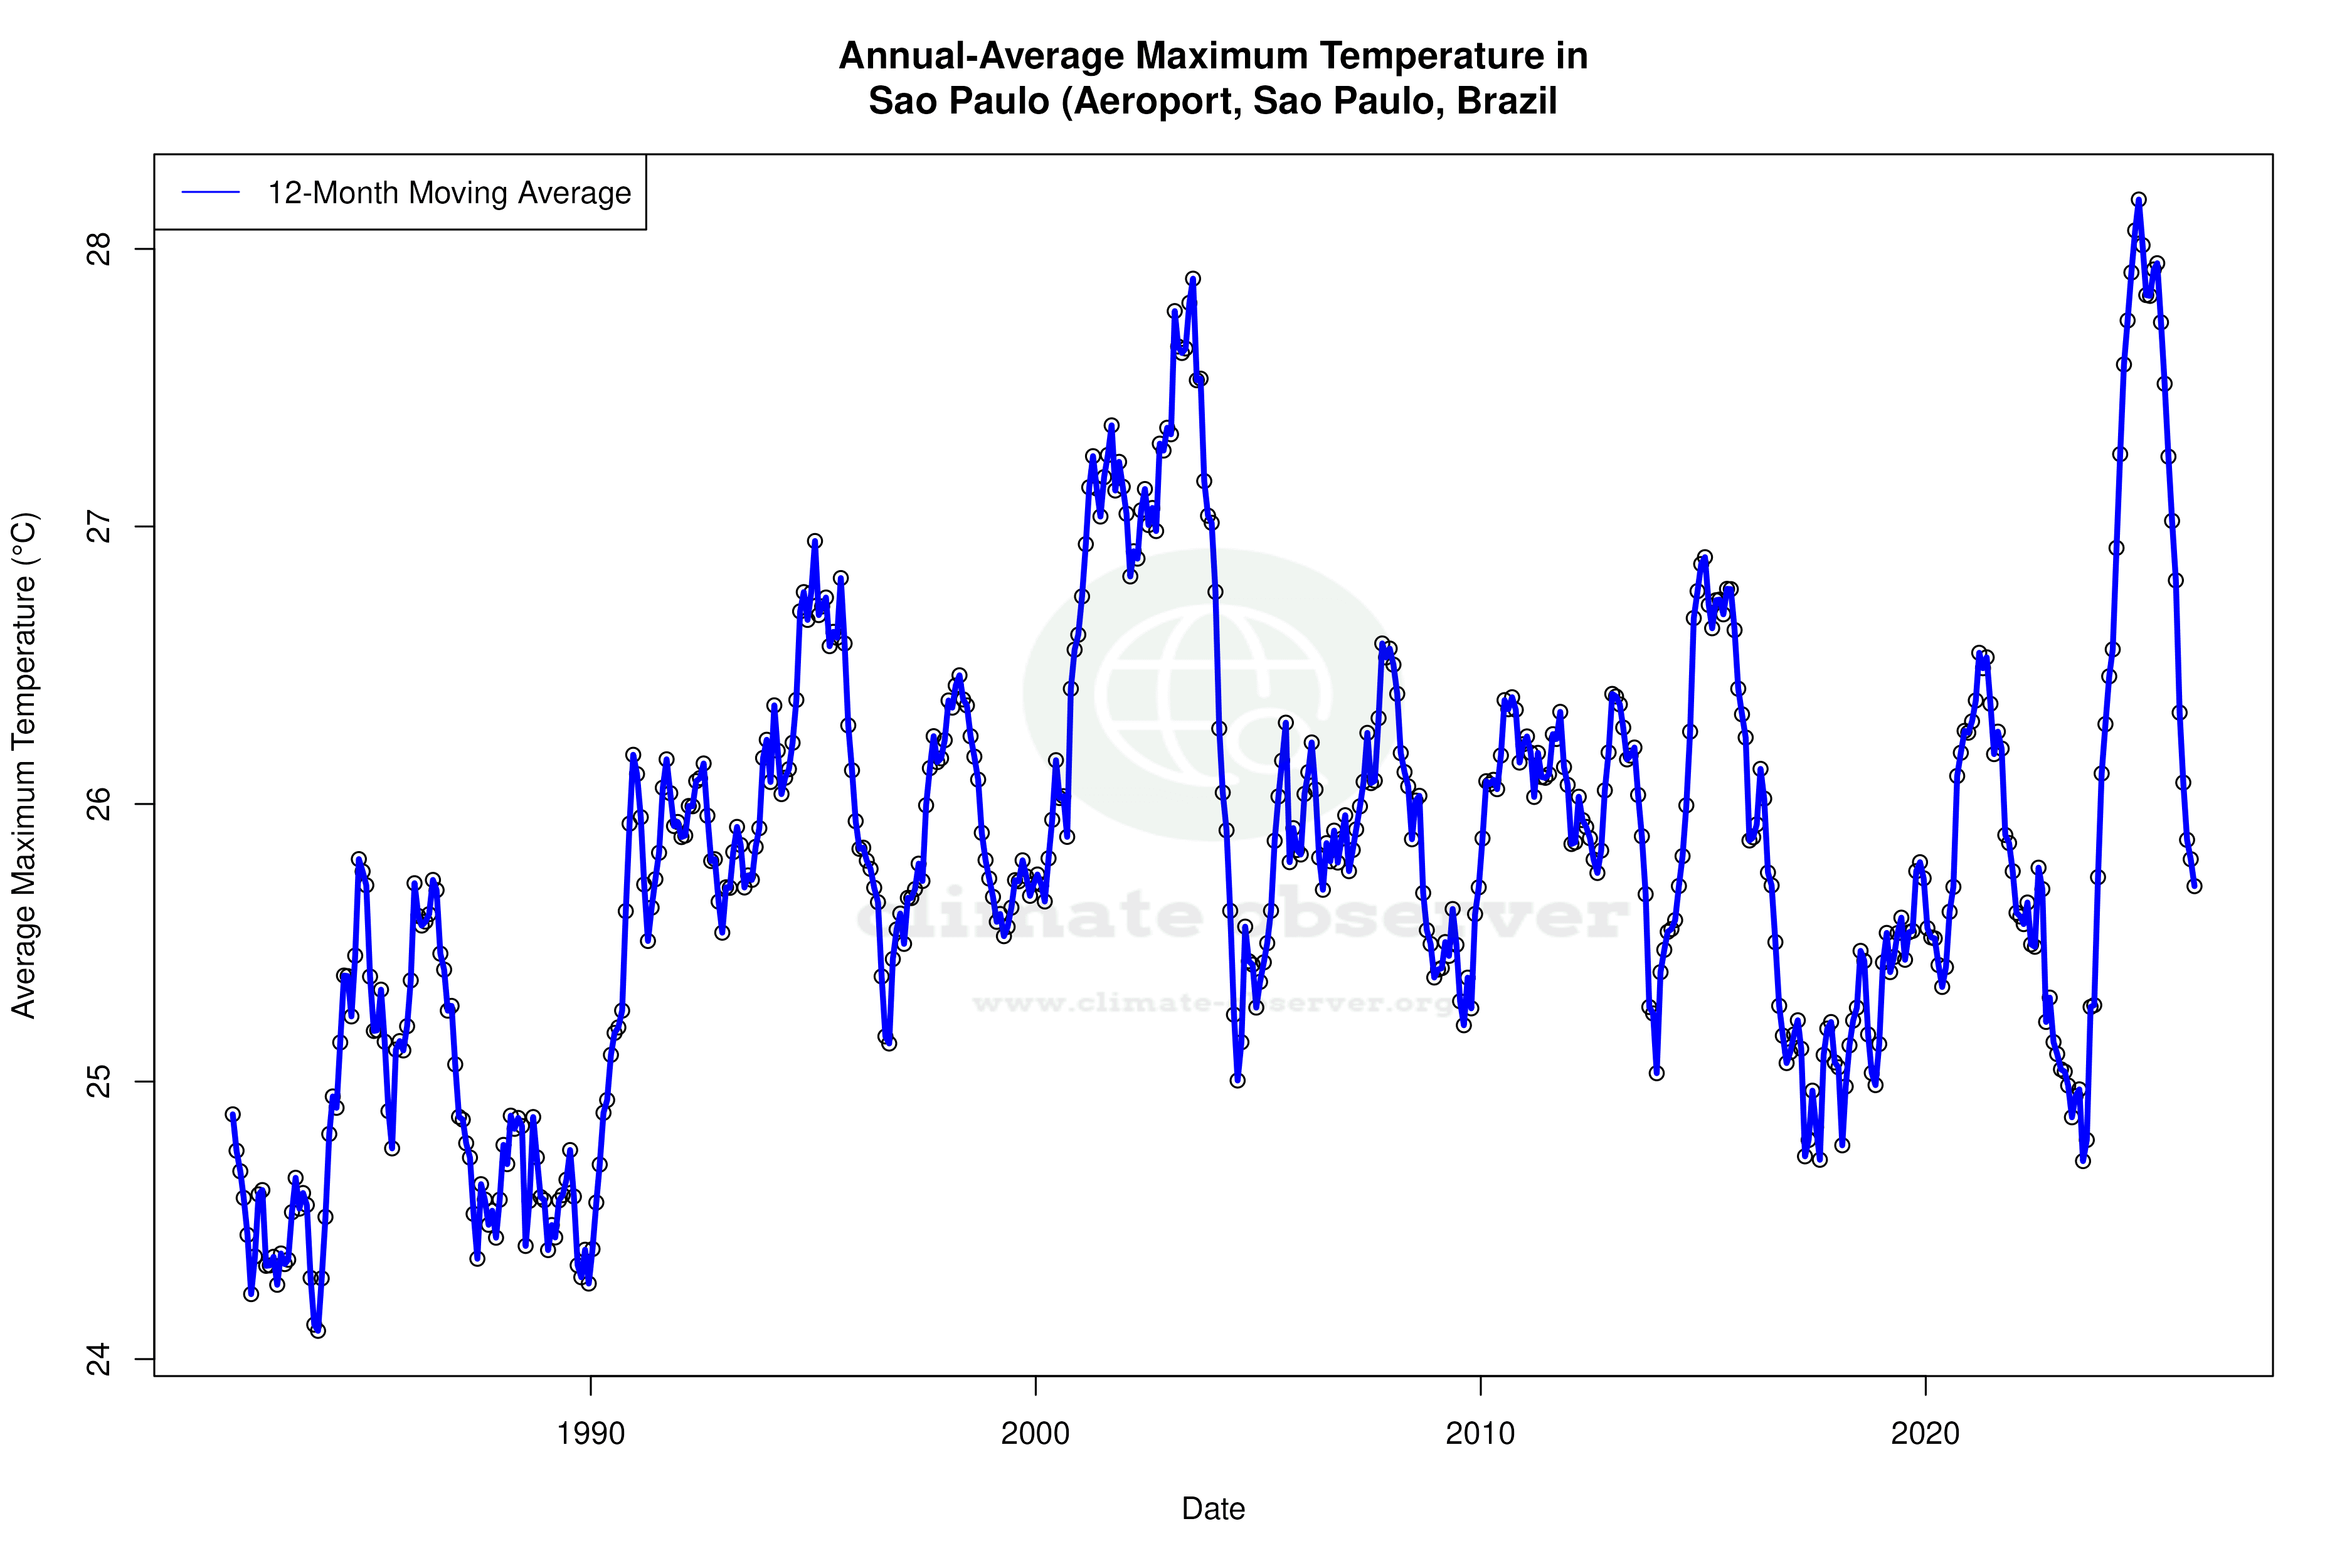


Max Temperature 12-Month MA | 1 of 6
Daily Data Points and Averages Throughout the Year

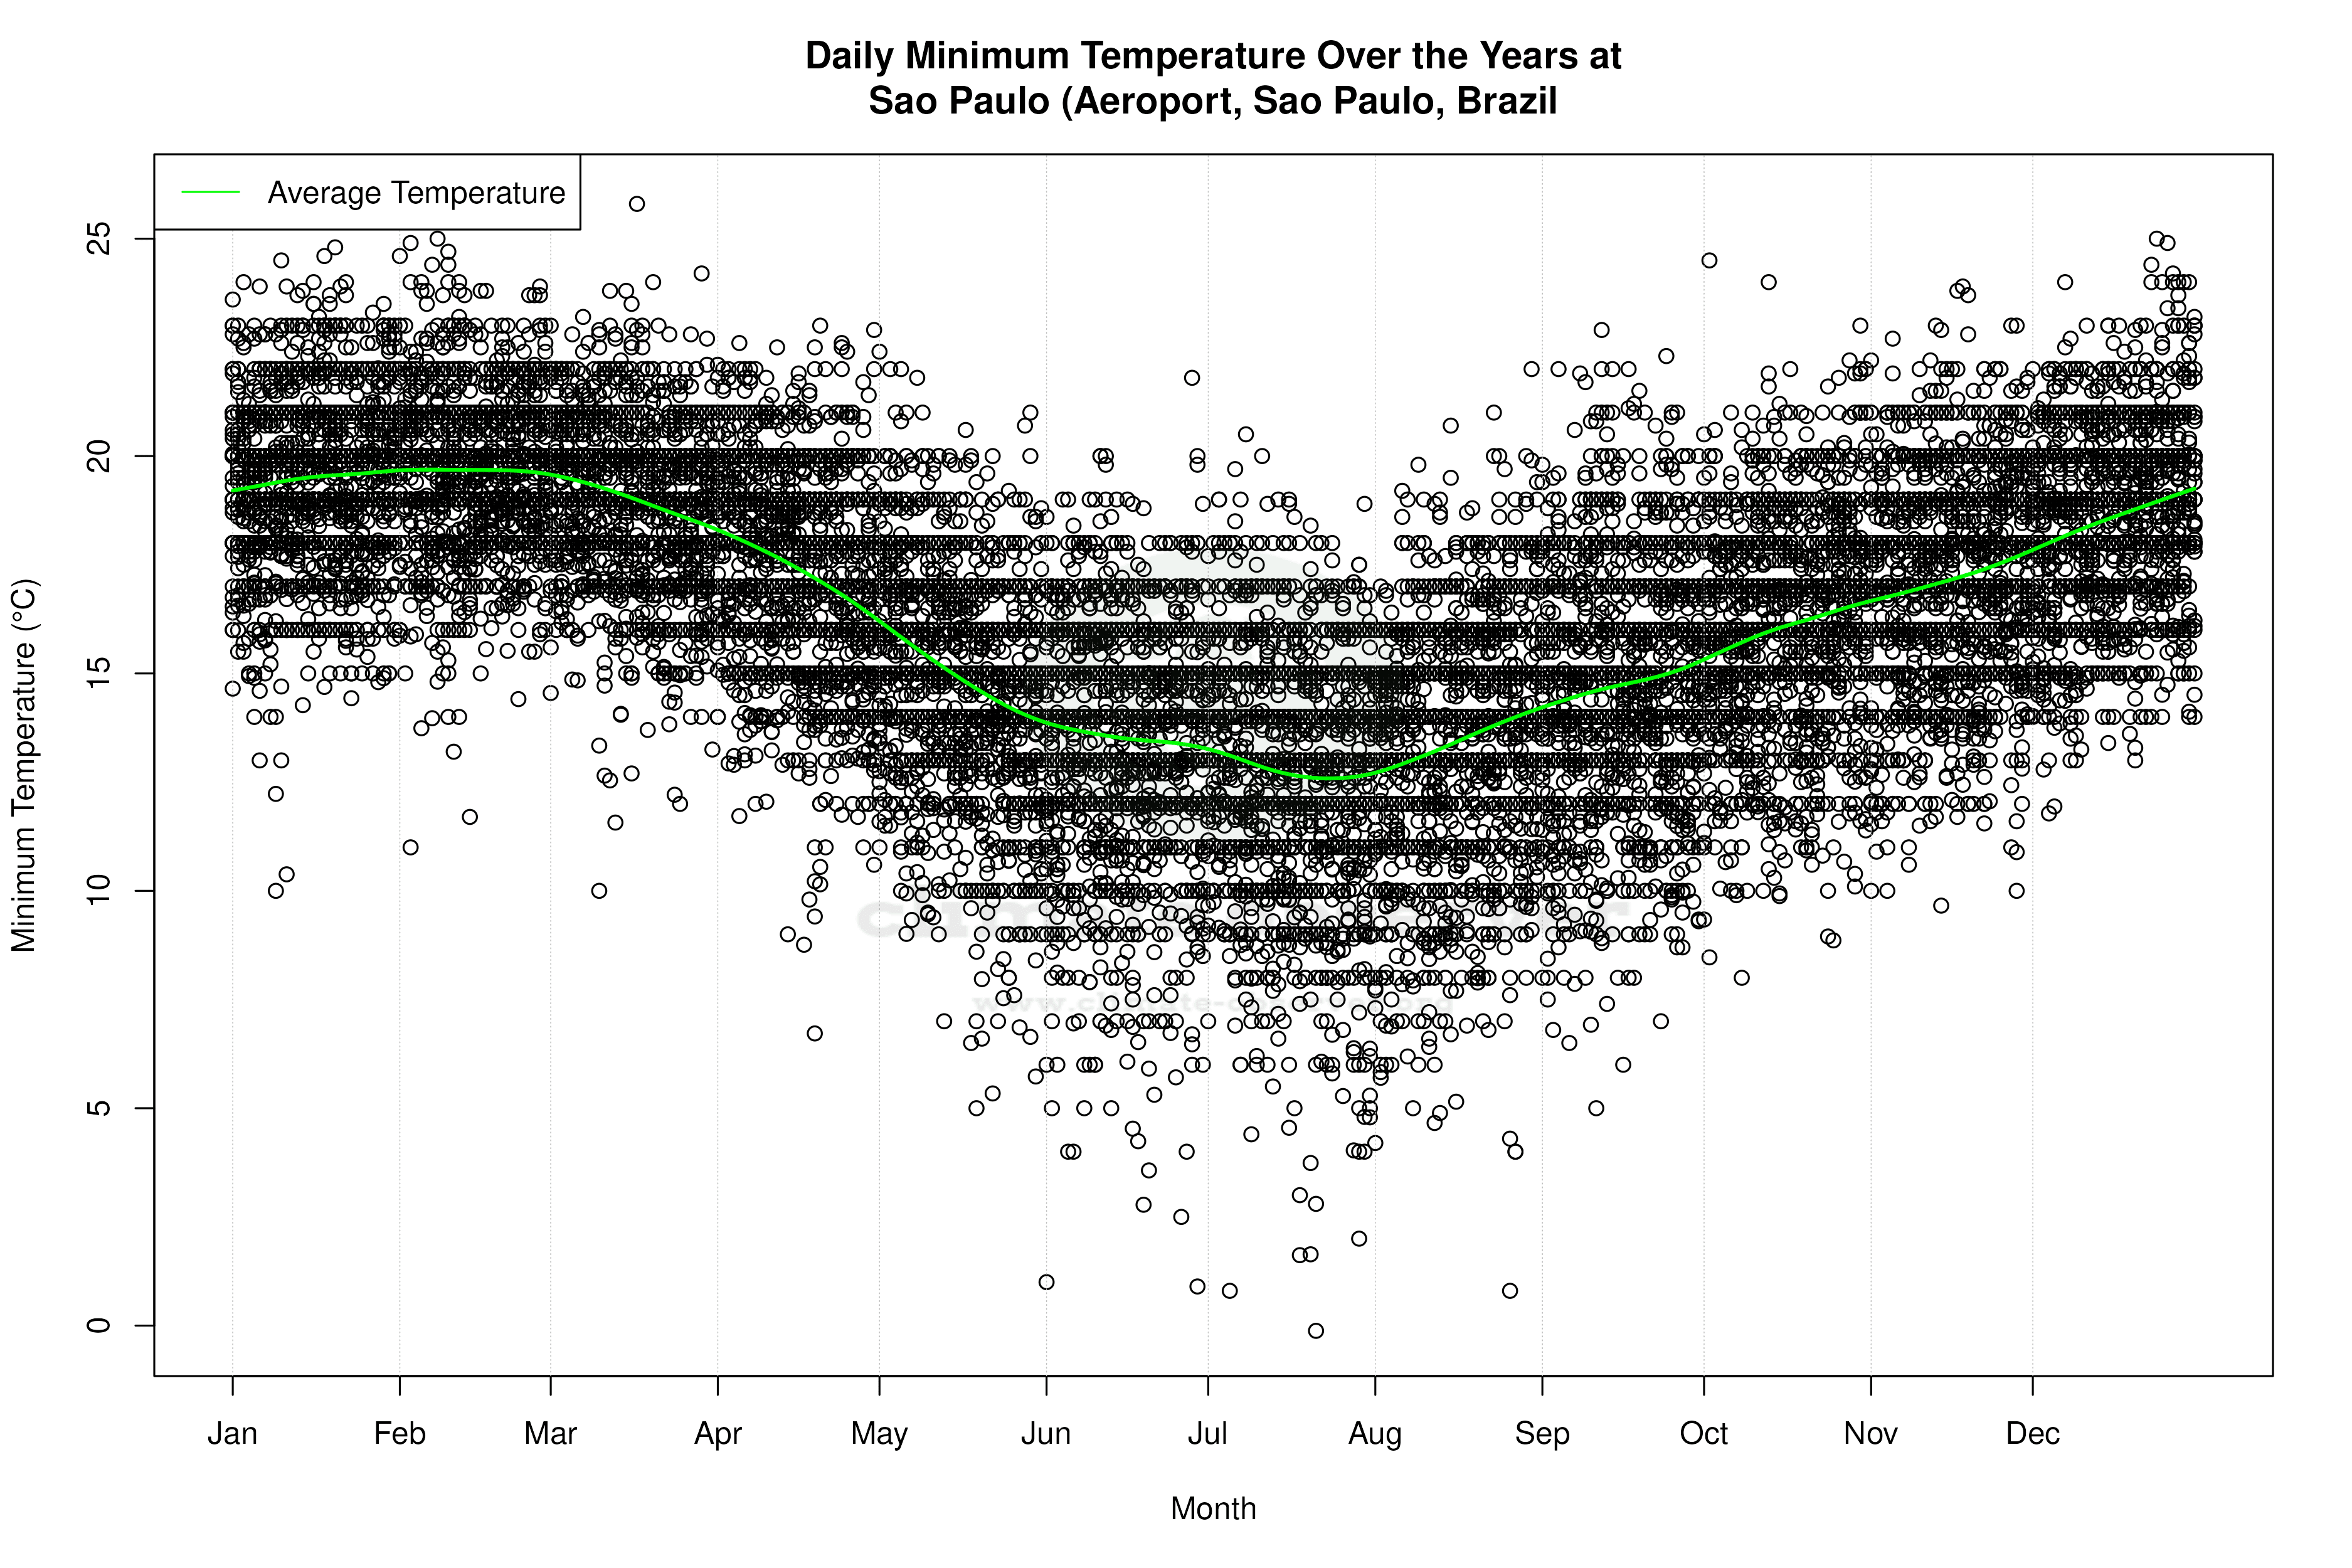
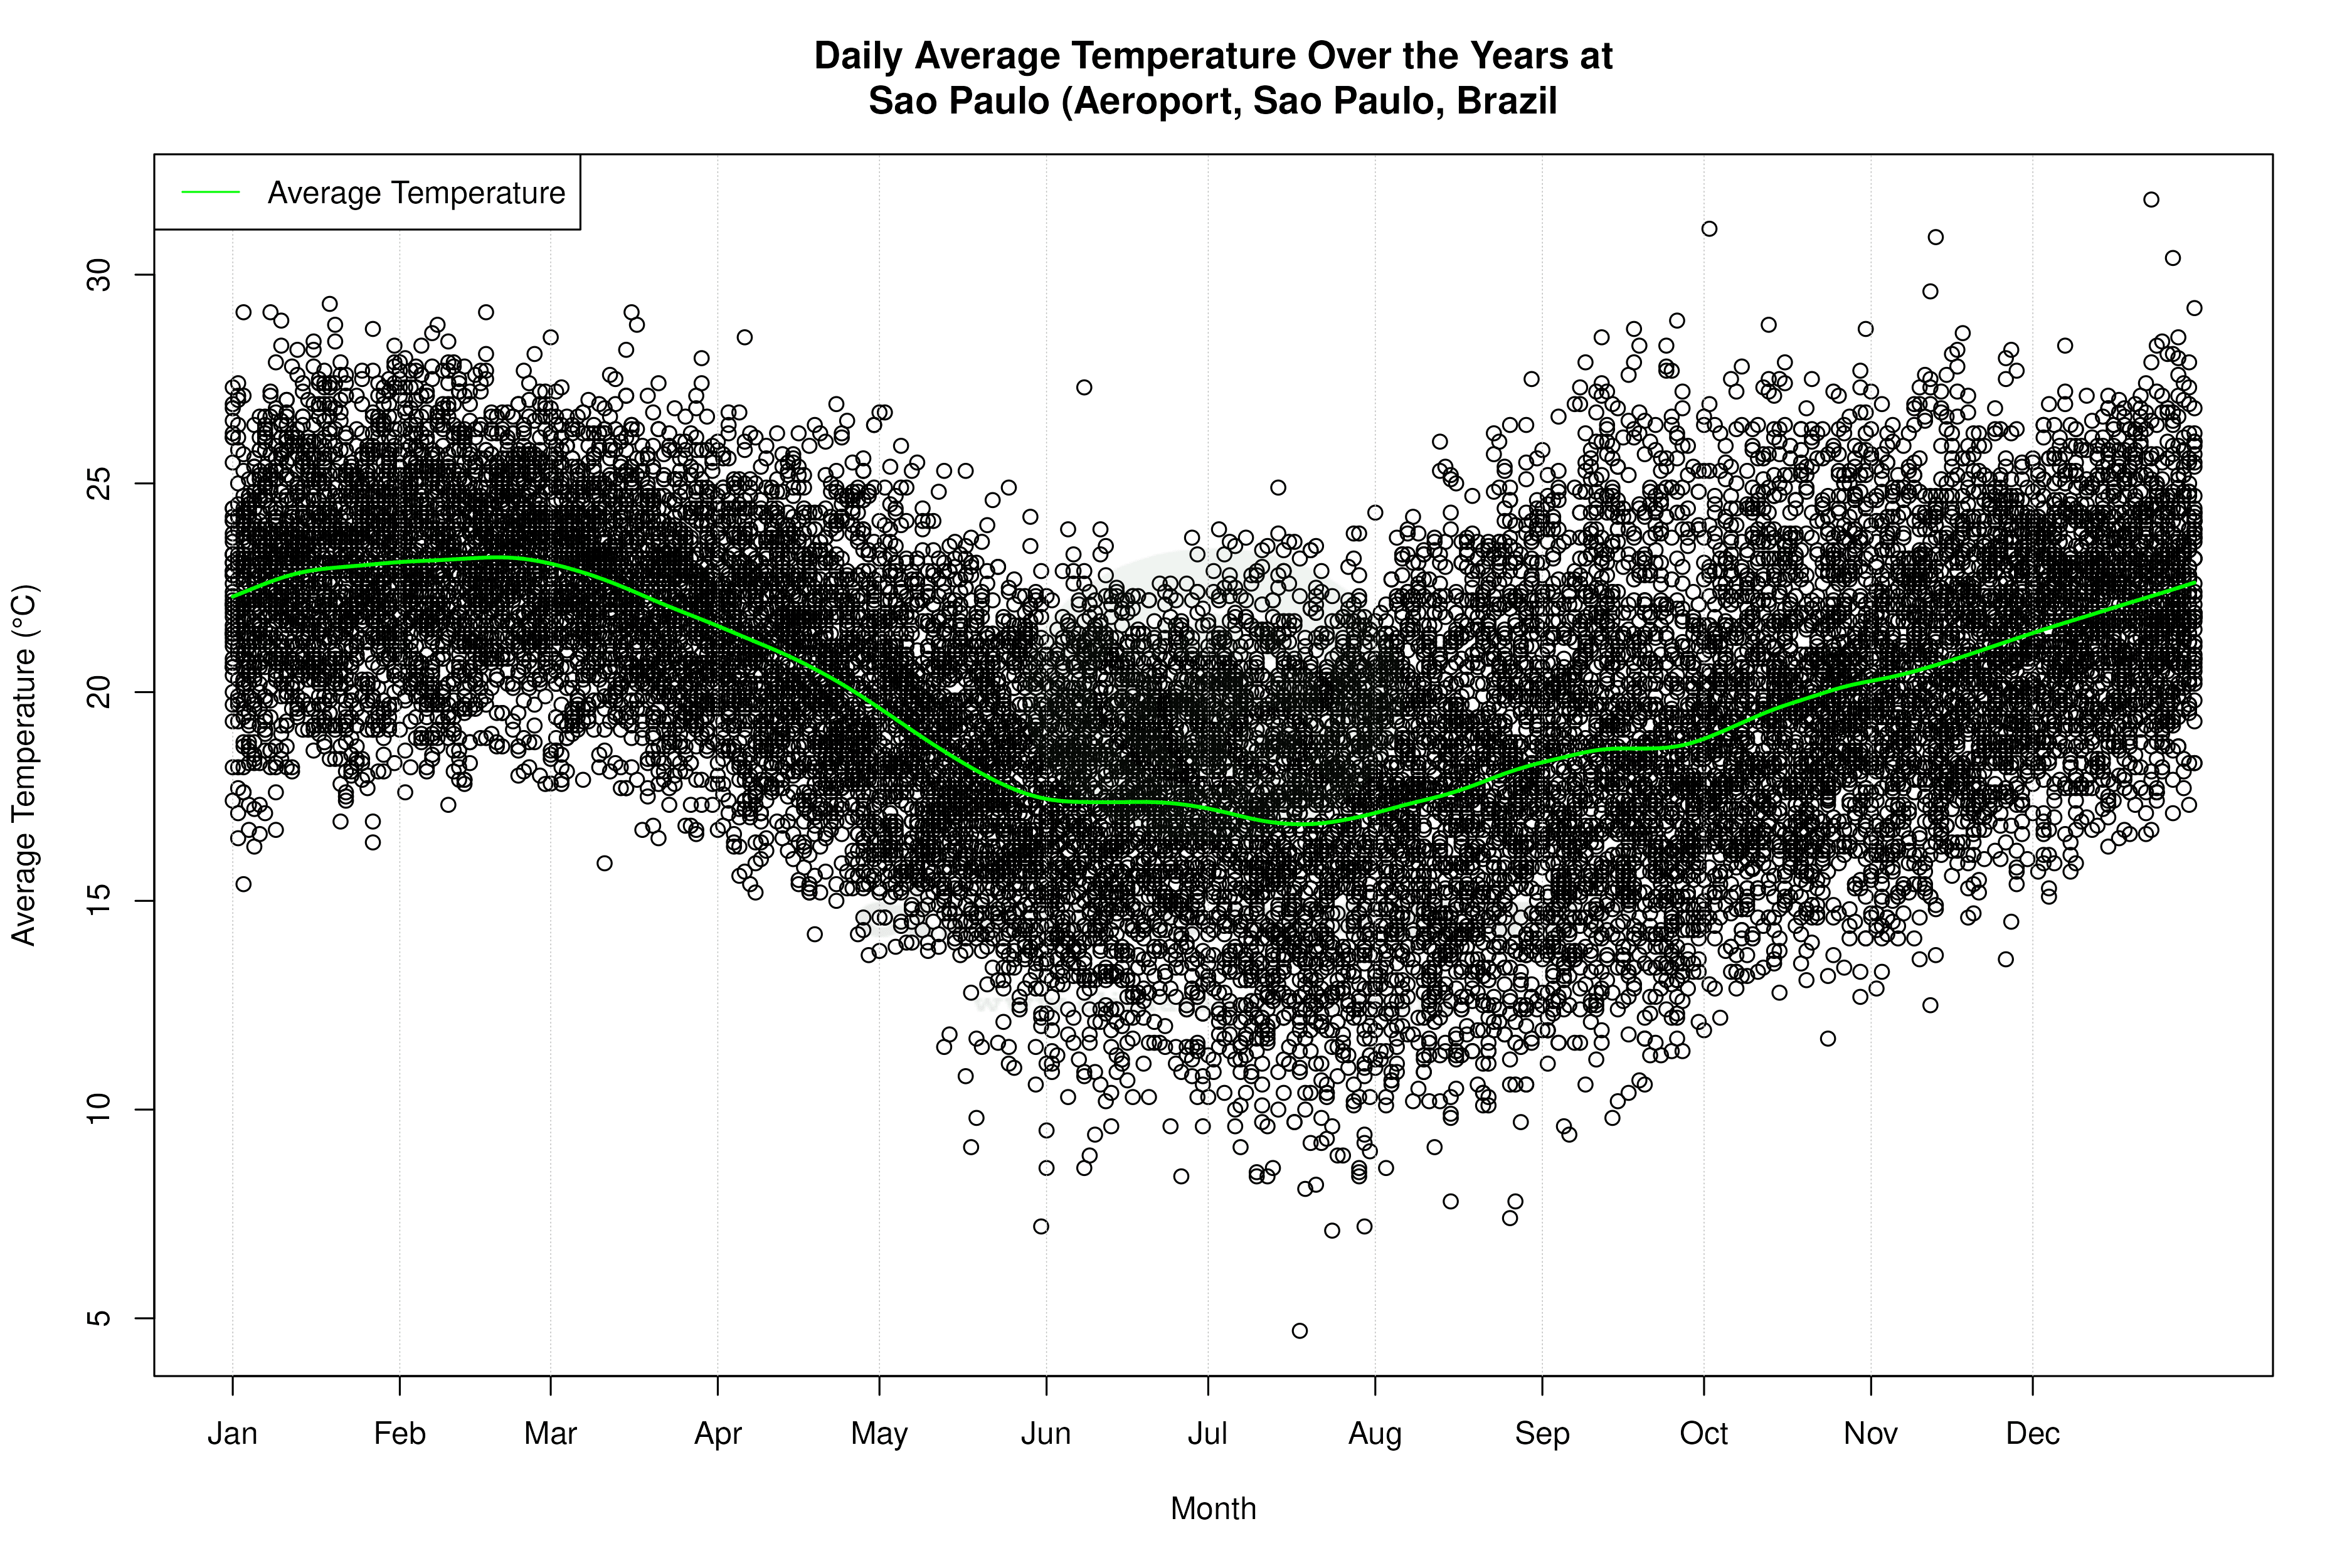


Average Max Temperature Throughout Year | 1 of 5
