Climate for Station: Val De Cans Intl, Para, Brazil
Loading live weather...
Climate Analysis & Overview
Aeroporto Internacional de Belém Val-de-Cans is experiencing a warming trend, with notable increases in both high and low temperatures over the past decade. Precipitation patterns have become more evenly distributed, reflecting a potential shift in local climate dynamics.
Tropical Climate Dynamics
Aeroporto Internacional de Belém Val-de-Cans, located at -1.38, -48.48, lies within a tropical rainforest climate zone, classified as "Af" under the Köppen system. This classification signifies a consistently warm climate with significant rainfall throughout the year. The proximity to the Amazon River and the Atlantic Ocean plays a crucial role in shaping the local weather patterns, contributing to high humidity and frequent precipitation.
Temperature Trends: A Decade of Change
Over the past ten years, the station has recorded a rise in both high and low temperatures. Highs have increased by 1.21°C (2.18°F), while lows have risen by 0.80°C (1.44°F). These changes suggest a warming trend that is more pronounced in daily maximum temperatures. In contrast, the all-time trends show a modest rise in lows by 0.22°C (0.40°F), while highs have barely changed with an increase of just 0.01°C (0.02°F). This indicates that while recent years have seen more significant warming, historically, the region has maintained a relatively stable temperature profile.
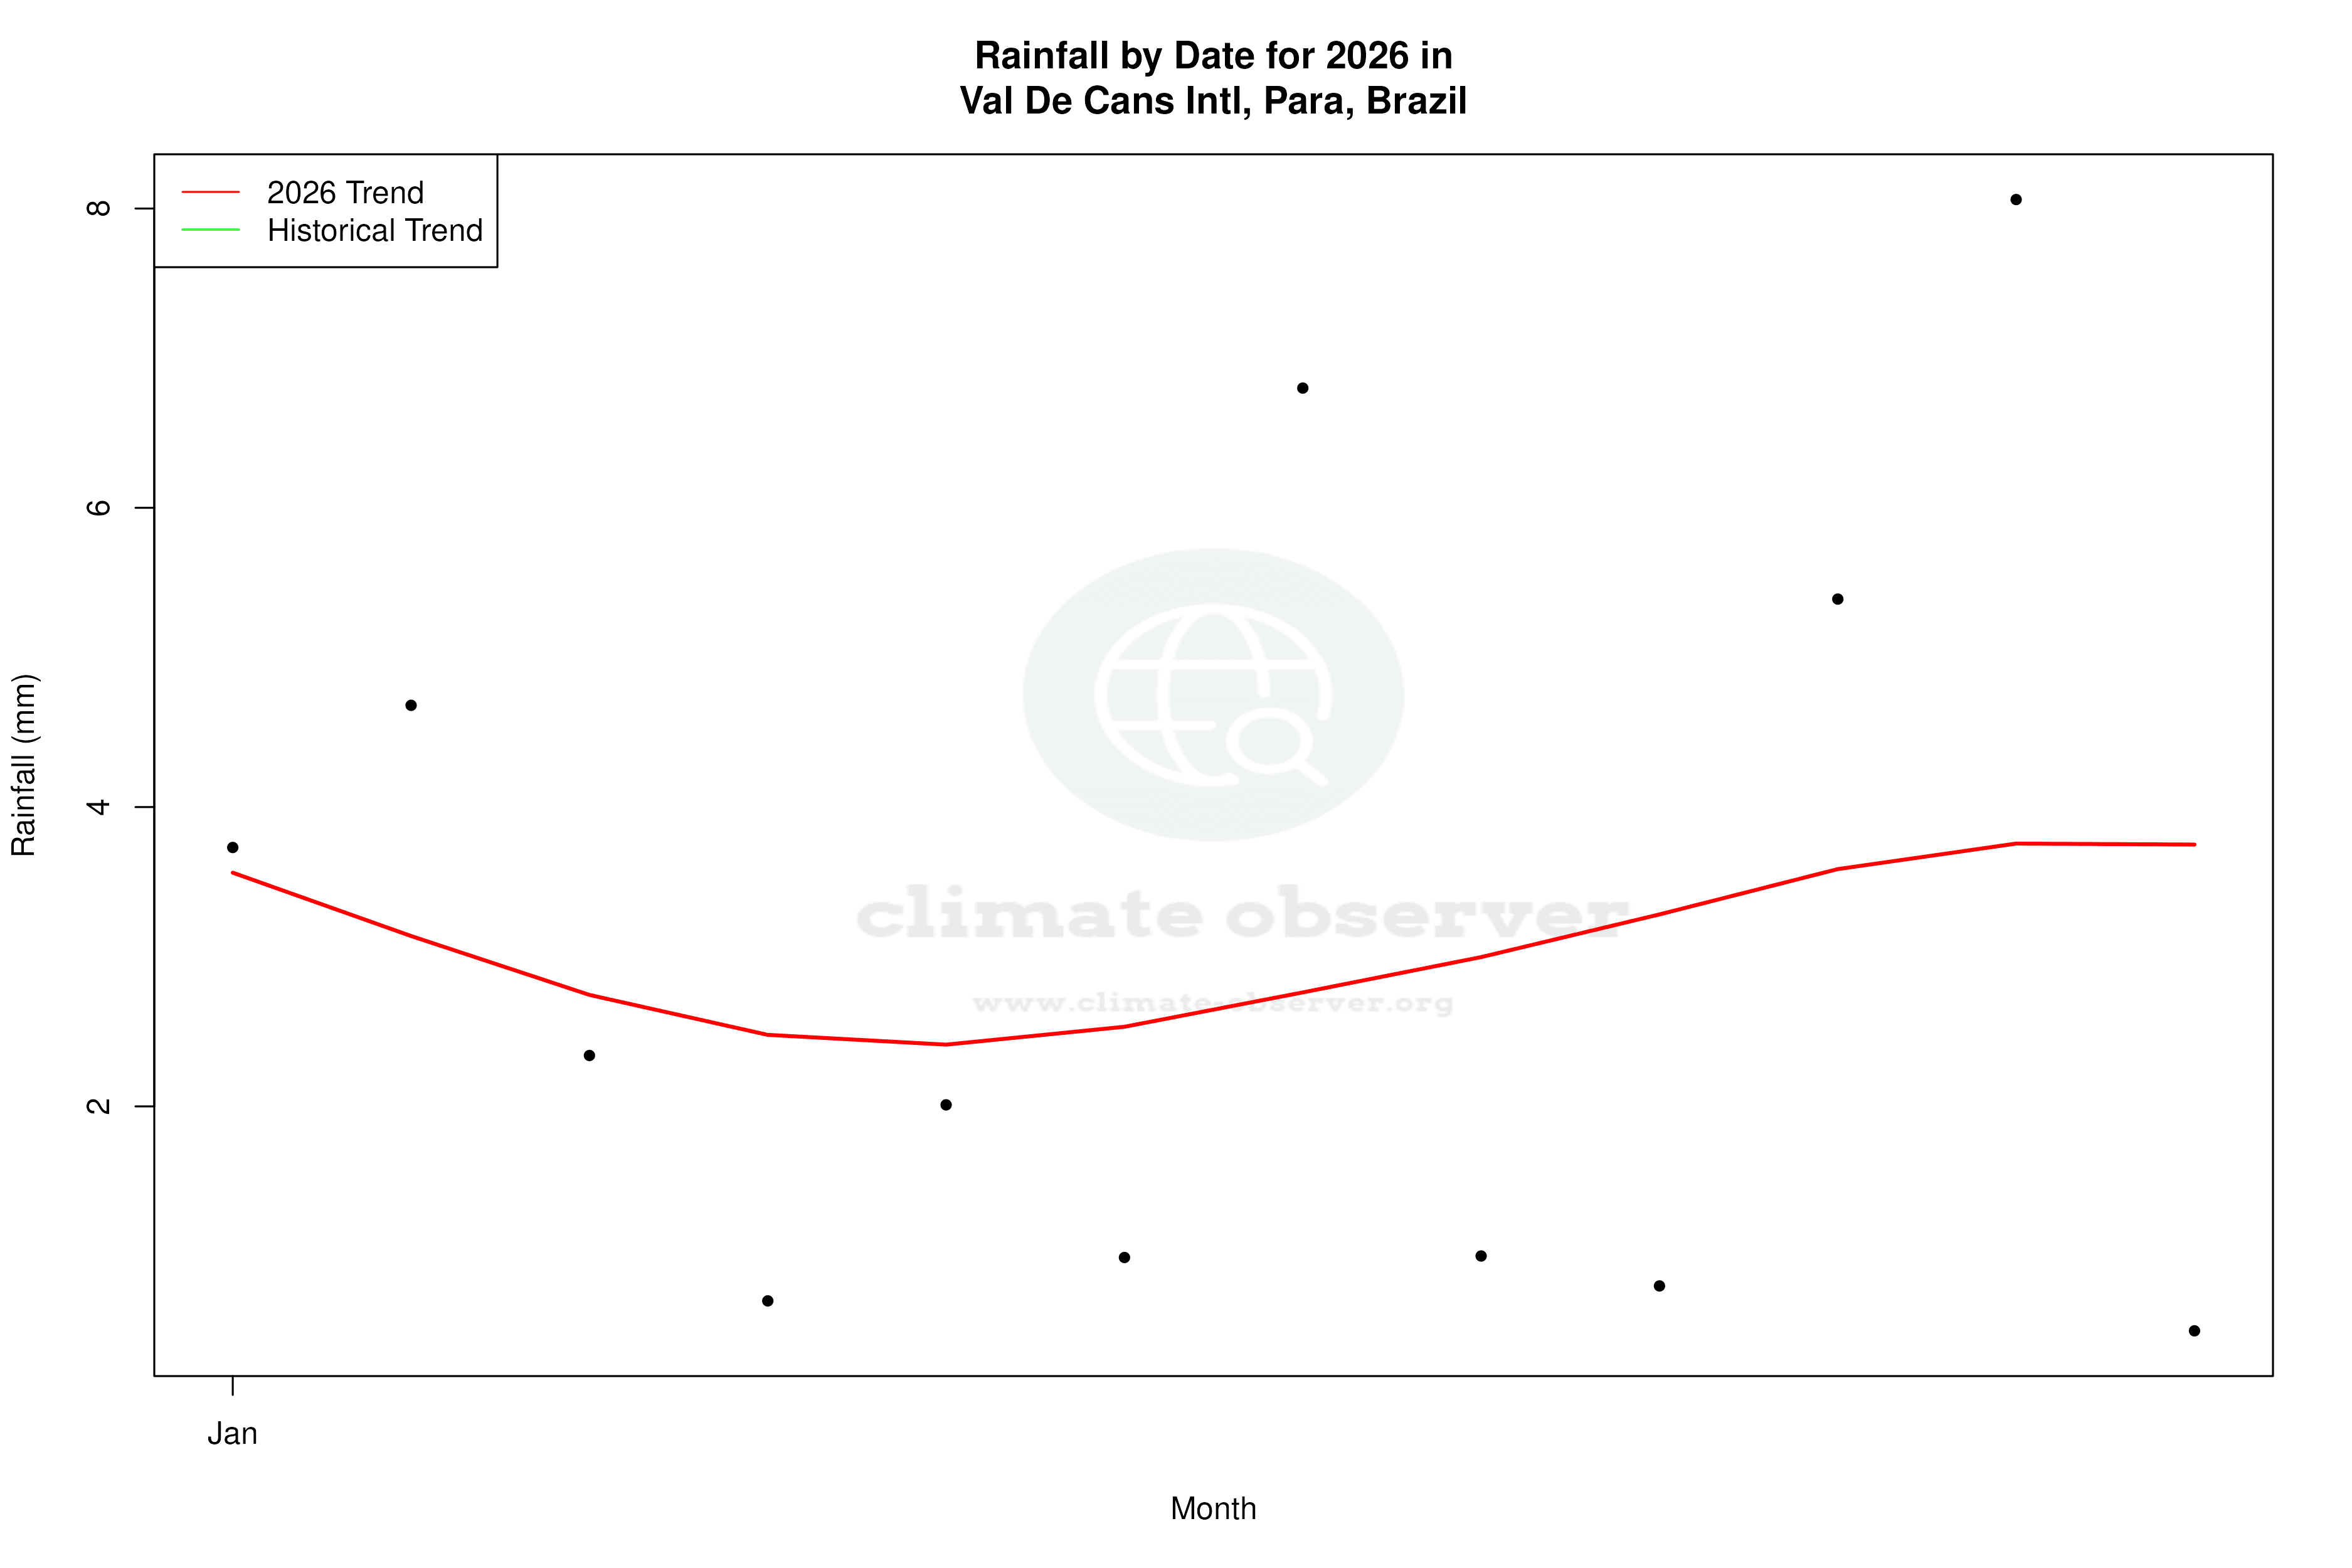
Precipitation Patterns: A Shift Towards Evenness
The Precipitation Concentration Index (PCI) has decreased from a baseline of 12.54 to a current value of 9.74. This shift indicates that rainfall is now more evenly distributed throughout the year, reducing the concentration of precipitation in fewer events. Such a change can have implications for local agriculture and water management, as it may affect soil moisture levels and the availability of water resources.
Record Extremes: A Testament to Tropical Intensity
The station's recorded temperature extremes highlight the intensity of the tropical climate. The highest recorded temperature is 38.9°C (102.0°F), while the lowest is 18.0°C (64.4°F). These records underscore the region's capacity for both intense heat and relatively cooler nights, typical of tropical rainforest climates.
Regional Implications and Goals
Brazil's commitment to addressing climate change includes efforts to monitor and adapt to shifting weather patterns. The observed trends at Val-de-Cans align with broader regional goals to enhance climate resilience. The even distribution of precipitation could support these efforts by stabilising water resources, although the warming trend presents ongoing challenges for managing heat-related impacts.
Station Statistics
10-Year Trend
High: +1.92 °F/decade
Low: +1.60 °F/decade
Rain: -0.095 in/decade
25-Year Trend
High: -0.36 °F/decade
Low: -0.03 °F/decade
Rain: -0.016 in/decade
50-Year Trend
High: +0.12 °F/decade
Low: +0.22 °F/decade
Rain: +0.001 in/decade
All-Time Trend
High: +0.01 °F/decade
Low: +0.39 °F/decade
Rain: +0.001 in/decade
Percentage Above-Average Days
Last 12 Months: 32.6%
This Year: 14.5%
Precipitation Concentration Index (PCI) ℹ️
Last 12 Months: 12.0
Historical Average: 11.0
Percentile Rank of Last 12 Months ℹ️
High: 49th percentile
Low: 92nd percentile
Rain: 15th percentile
Change in Variance ℹ️
High: +0.4%
Low: -29.7%
Intraday: -23.5%
Data Coverage
80.8%
First Year of Data
1942
Station Location
Historical Weather Records
| Max High | Avg High | Min High | Max Avg | Avg Avg | Min Avg | Max Low | Avg Low | Min Low | Max Precipitation | Avg Precipitation | Max Snow | Avg Snow | |
|---|---|---|---|---|---|---|---|---|---|---|---|---|---|
| Record | 102.02 °F | — | 74.95 °F | 87.62 °F | — | 72.50 °F | 80.60 °F | — | 64.40 °F | 10.91 in | — | — | — |
| January | 102.02 °F | 87.57 °F | 75.92 °F | 87.08 °F | 79.02 °F | 73.40 °F | 80.60 °F | 74.06 °F | 66.20 °F | 3.66 in | 0.39 in | — | — |
| February | 98.60 °F | 86.71 °F | 77.00 °F | 85.46 °F | 78.51 °F | 73.04 °F | 80.24 °F | 74.09 °F | 68.00 °F | 5.24 in | 0.46 in | — | — |
| March | 98.60 °F | 86.46 °F | 76.64 °F | 85.82 °F | 78.57 °F | 73.40 °F | 80.24 °F | 74.29 °F | 69.08 °F | 4.29 in | 0.48 in | — | — |
| April | 100.40 °F | 87.20 °F | 75.56 °F | 84.56 °F | 79.02 °F | 73.76 °F | 80.60 °F | 74.69 °F | 69.08 °F | 4.92 in | 0.46 in | — | — |
| May | 95.36 °F | 88.38 °F | 77.72 °F | 87.44 °F | 79.79 °F | 75.02 °F | 80.60 °F | 74.79 °F | 68.00 °F | 5.16 in | 0.35 in | — | — |
| June | 96.80 °F | 89.04 °F | 78.19 °F | 86.00 °F | 80.20 °F | 74.66 °F | 78.80 °F | 74.32 °F | 68.00 °F | 10.91 in | 0.24 in | — | — |
| July | 94.28 °F | 89.27 °F | 79.39 °F | 87.62 °F | 80.18 °F | 72.50 °F | 78.80 °F | 73.83 °F | 68.00 °F | 2.80 in | 0.18 in | — | — |
| August | 95.72 °F | 89.62 °F | 81.70 °F | 86.36 °F | 80.29 °F | 75.02 °F | 78.80 °F | 73.78 °F | 68.00 °F | 3.27 in | 0.17 in | — | — |
| September | 95.54 °F | 89.64 °F | 84.38 °F | 85.82 °F | 80.16 °F | 75.56 °F | 78.62 °F | 73.65 °F | 68.00 °F | 10.16 in | 0.16 in | — | — |
| October | 96.80 °F | 89.79 °F | 81.32 °F | 85.64 °F | 80.51 °F | 74.48 °F | 79.97 °F | 73.86 °F | 64.40 °F | 2.99 in | 0.14 in | — | — |
| November | 100.40 °F | 89.93 °F | 77.61 °F | 86.18 °F | 80.73 °F | 74.30 °F | 79.88 °F | 74.23 °F | 68.00 °F | 3.15 in | 0.15 in | — | — |
| December | 100.40 °F | 89.19 °F | 74.95 °F | 85.46 °F | 80.12 °F | 73.58 °F | 80.42 °F | 74.32 °F | 68.00 °F | 5.63 in | 0.26 in | — | — |
Data Visualisations
Remove WatermarksCurrent Year Climate Trends vs Historical


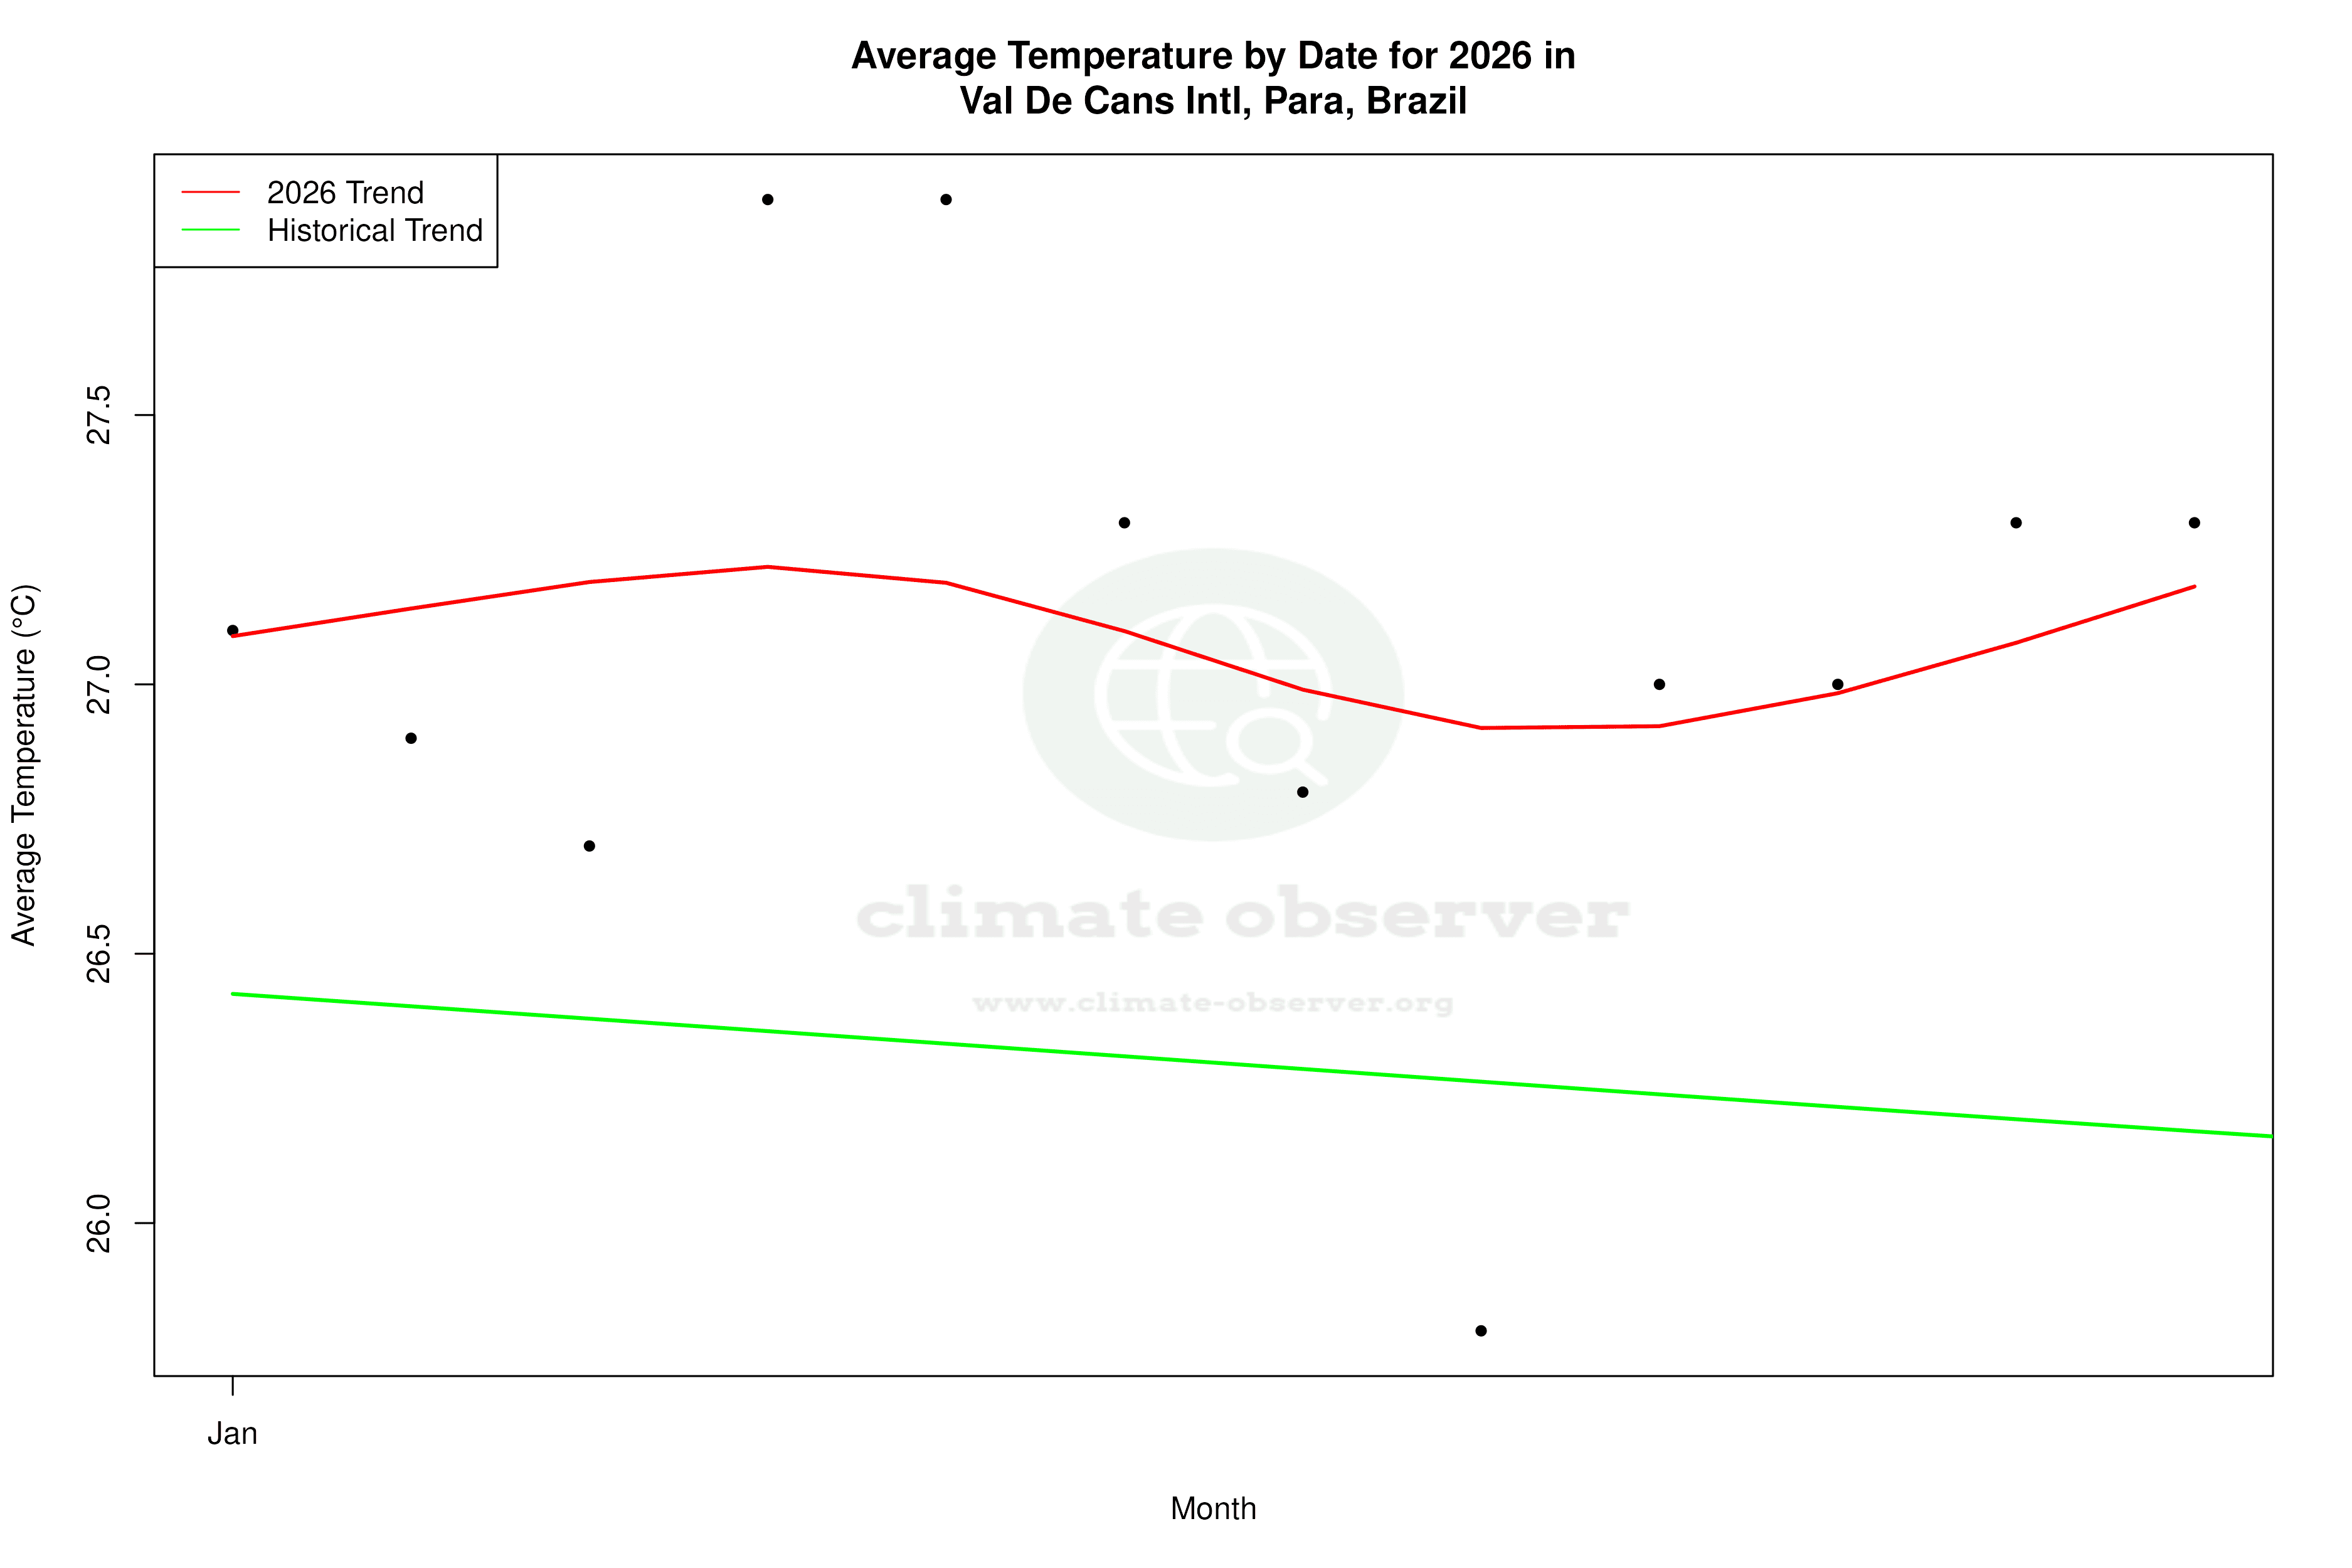


Max Temperature this Year | 1 of 6
Climate 12-Month Moving Averages


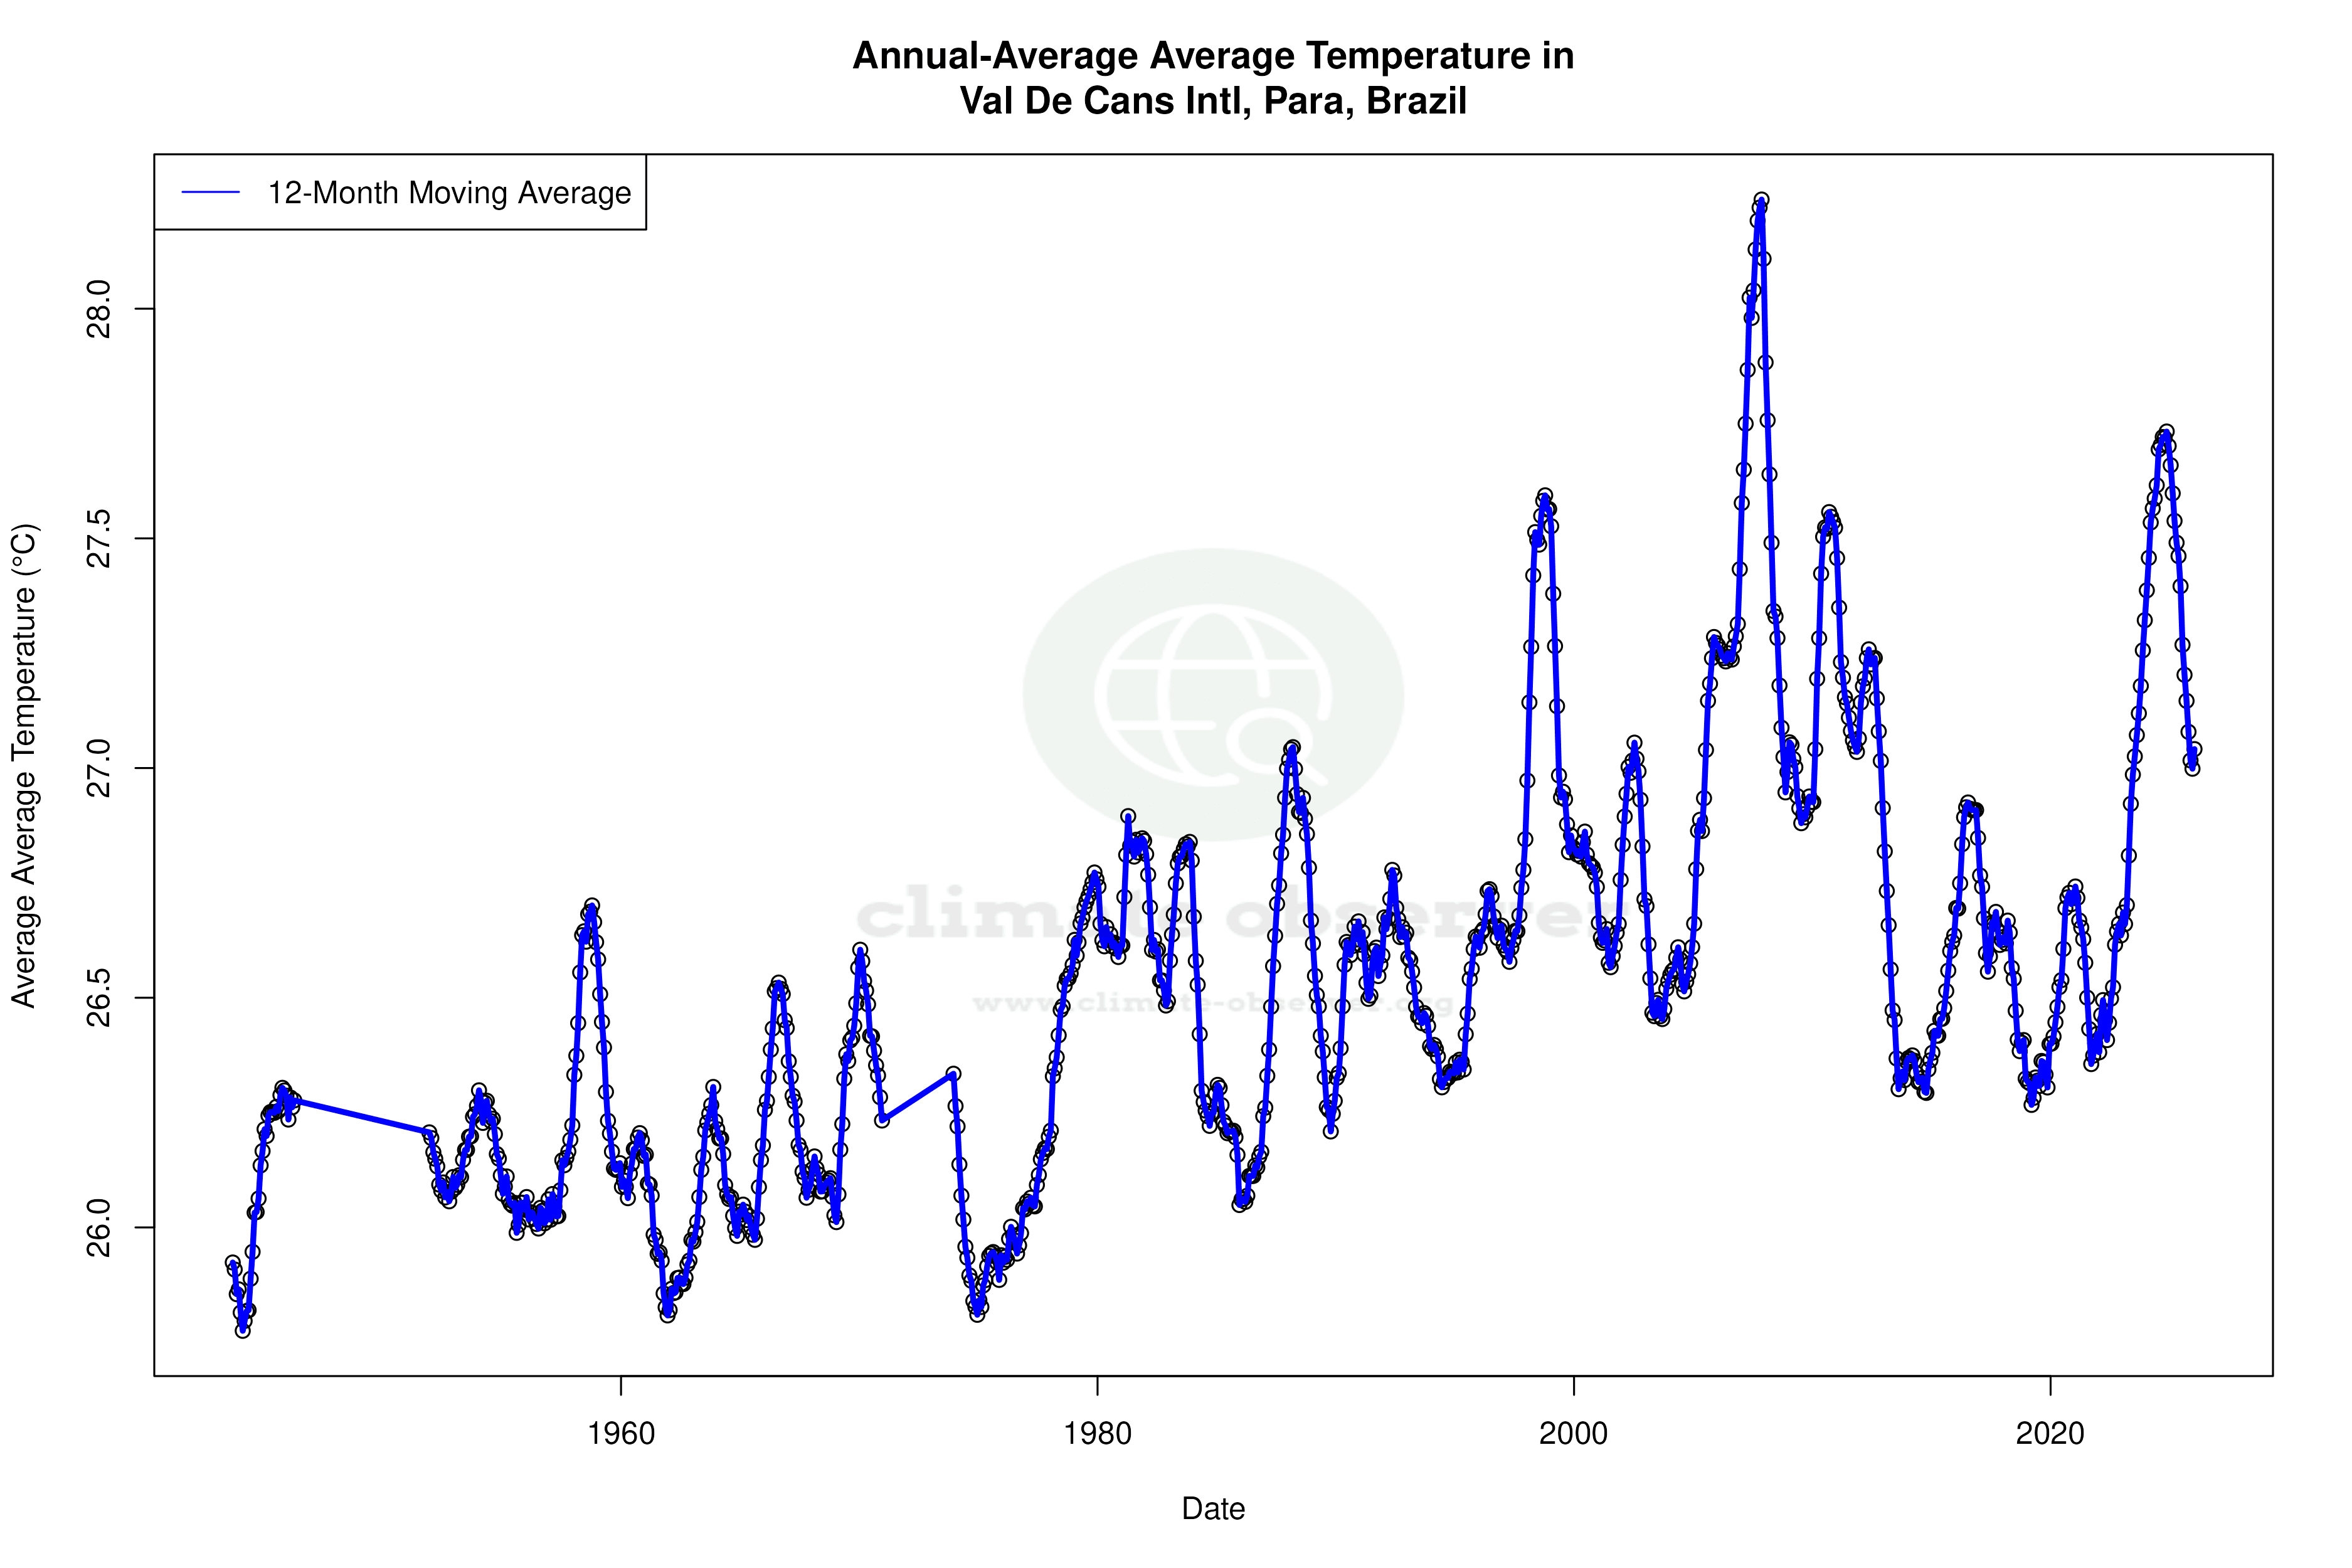


Max Temperature 12-Month MA | 1 of 6
Daily Data Points and Averages Throughout the Year


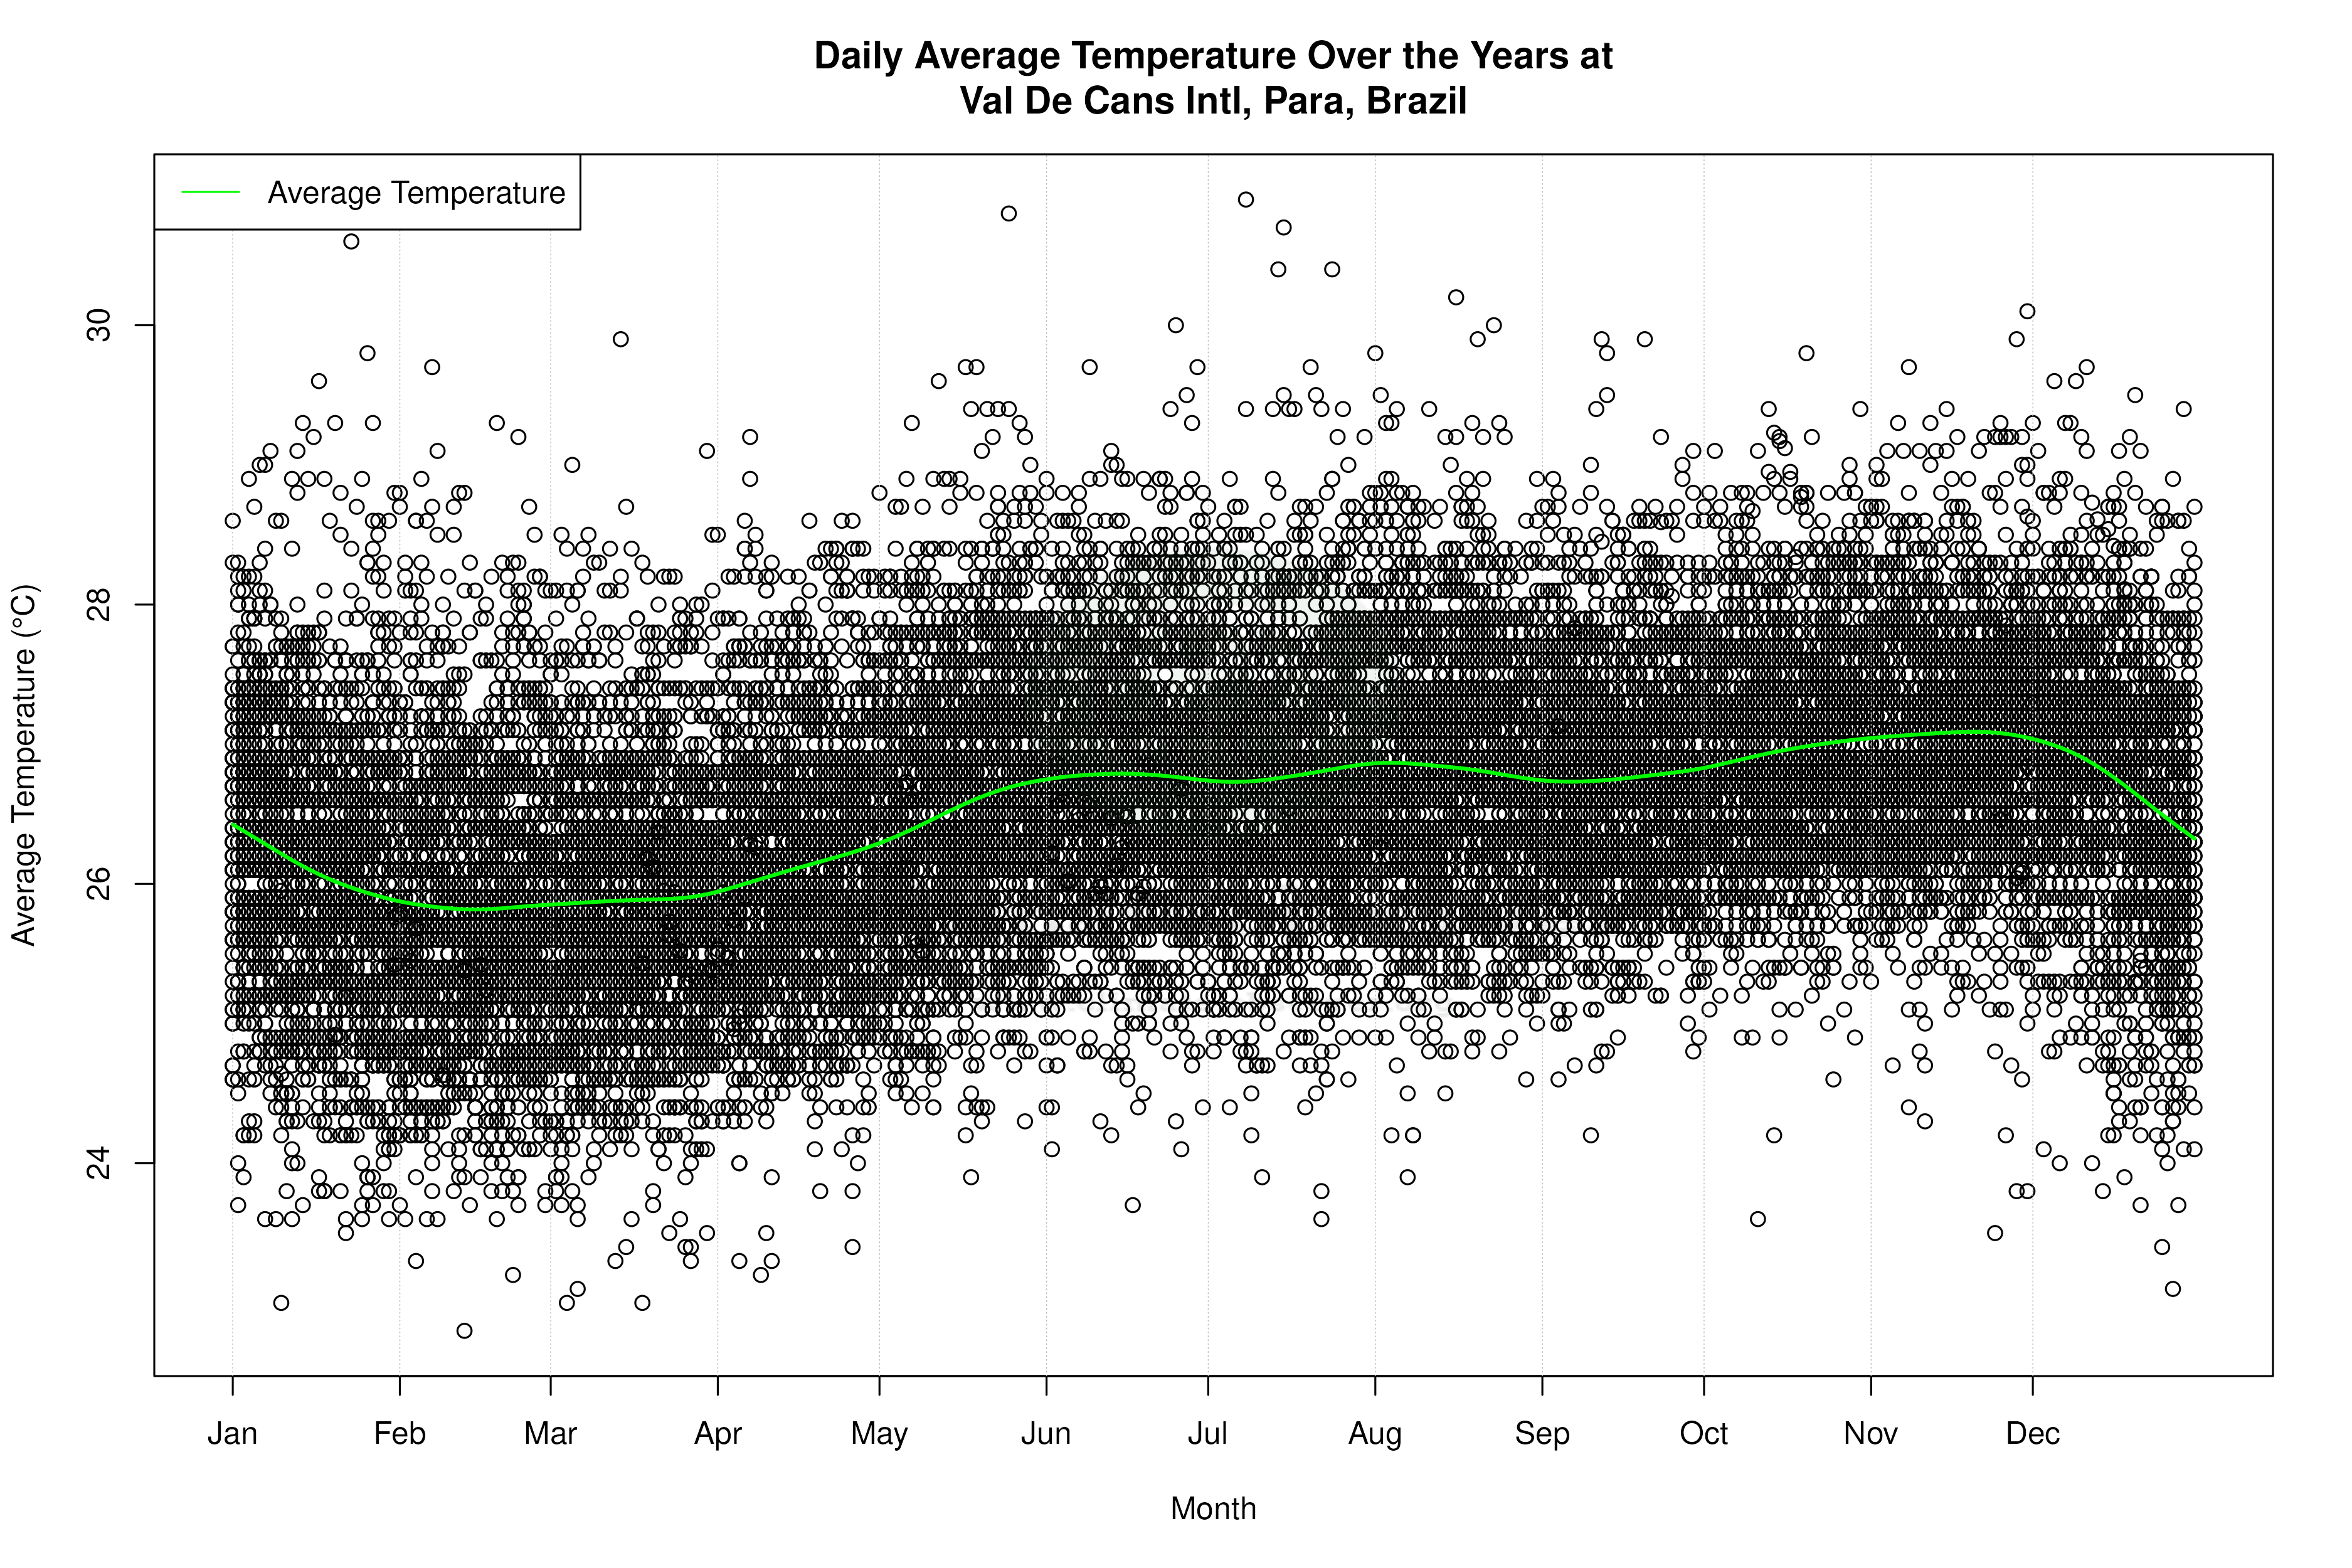


Average Max Temperature Throughout Year | 1 of 5
