Climate for Station: Lake Cowichan, British Columbia, Canada
Loading live weather...
Climate Analysis & Overview
Lake Cowichan's climate is marked by contrasting temperature trends, with a notable warming in low temperatures and a slight cooling in highs over the past decade. Precipitation patterns have become more evenly distributed, reflecting a shift in the regional climate dynamics.
A Tale of Two Temperature Trends
Lake Cowichan, located in the Cowichan Valley of British Columbia, falls within the Köppen climate classification of Csb, characterised by warm, dry summers and mild, wet winters. The region's climate is influenced by its proximity to the Pacific Ocean and the surrounding mountainous terrain, which moderates temperature extremes. Over the past decade, the area has experienced a 1.29°C (2.32°F) increase in low temperatures, suggesting a warming trend during cooler periods. In contrast, high temperatures have shown a 0.99°C (1.78°F) decrease, indicating a cooling trend during warmer periods. These opposing trends highlight the complex interplay of local geographic and atmospheric factors.
Long-term Warming Amidst Short-term Cooling
When examining the all-time temperature trends, Lake Cowichan exhibits a slight warming, with highs increasing by 0.33°C (0.59°F) and lows by 0.13°C (0.23°F). This long-term warming is consistent with broader global climate patterns, where rising greenhouse gas concentrations contribute to gradual temperature increases. However, the recent decade's cooling in highs may reflect localised atmospheric variations or shifts in oceanic currents impacting the region.
Precipitation Patterns: A Shift Towards Even Distribution
The Precipitation Concentration Index (PCI) for Lake Cowichan has decreased from a baseline of 12.93 to a current value of 10.22. This change indicates a more even distribution of precipitation events throughout the year, suggesting a shift away from concentrated heavy rainfall towards more frequent, moderate precipitation. Such a trend can influence local ecosystems and water management strategies, aligning with Canada's climate goals to adapt to changing precipitation patterns.
Temperature Extremes: A Record of Contrasts
Lake Cowichan's temperature records reveal significant variability, with a maximum recorded temperature of 43.0°C (109.4°F) and a minimum of -17.2°C (1.0°F). These extremes underscore the region's climatic diversity, influenced by its geographical setting. The high temperature record reflects the potential for intense heatwaves, while the low record indicates the capacity for significant cold spells, both of which have implications for local agriculture and infrastructure resilience.
Regional Climate Context and Implications
The climate profile of Lake Cowichan is emblematic of the broader challenges faced by regions in British Columbia as they navigate the impacts of climate change. The area's evolving temperature and precipitation patterns necessitate adaptive strategies to mitigate risks and harness opportunities. Recent weather events, such as heatwaves and shifts in precipitation, underscore the urgency of local and national efforts to address climate resilience and sustainability.
Station Statistics
10-Year Trend
High: -1.62 °F/decade
Low: +3.03 °F/decade
Rain: -0.178 in/decade
25-Year Trend
High: +0.73 °F/decade
Low: +0.92 °F/decade
Rain: +0.003 in/decade
50-Year Trend
High: +0.61 °F/decade
Low: +0.18 °F/decade
Rain: +0.031 in/decade
All-Time Trend
High: +0.58 °F/decade
Low: +0.25 °F/decade
Rain: +0.004 in/decade
Percentage Above-Average Days
Last 12 Months: 46.0%
This Year: 49.1%
Precipitation Concentration Index (PCI) ℹ️
Last 12 Months: 12.2
Historical Average: 13.5
Percentile Rank of Last 12 Months ℹ️
High: 59th percentile
Low: 98th percentile
Rain: 29th percentile
Change in Variance ℹ️
High: +16.8%
Low: +30.9%
Intraday: -3.4%
Data Coverage
92.1%
First Year of Data
1960
Station Location
Historical Weather Records
| Max High | Avg High | Min High | Max Avg | Avg Avg | Min Avg | Max Low | Avg Low | Min Low | Max Precipitation | Avg Precipitation | Max Snow | Avg Snow | |
|---|---|---|---|---|---|---|---|---|---|---|---|---|---|
| Record | 109.40 °F | — | 15.98 °F | 89.60 °F | — | 9.95 °F | 78.04 °F | — | 1.04 °F | 7.45 in | — | 20.31 in | — |
| January | 59.00 °F | 42.74 °F | 19.24 °F | 51.44 °F | 38.03 °F | 10.94 °F | 49.10 °F | 31.98 °F | 1.04 °F | 7.45 in | 0.36 in | 15.59 in | 0.33 in |
| February | 68.00 °F | 45.96 °F | 17.60 °F | 52.70 °F | 38.99 °F | 9.95 °F | 48.02 °F | 32.49 °F | 3.20 °F | 4.04 in | 0.25 in | 18.19 in | 0.20 in |
| March | 75.20 °F | 50.19 °F | 32.00 °F | 56.30 °F | 42.68 °F | 22.10 °F | 53.60 °F | 34.50 °F | 9.50 °F | 4.61 in | 0.24 in | 7.09 in | 0.10 in |
| April | 87.80 °F | 55.98 °F | 38.30 °F | 65.84 °F | 47.27 °F | 32.18 °F | 53.60 °F | 37.82 °F | 17.06 °F | 4.03 in | 0.15 in | 7.87 in | 0.02 in |
| May | 95.00 °F | 63.96 °F | 44.60 °F | 76.10 °F | 54.21 °F | 39.20 °F | 68.90 °F | 43.51 °F | 29.30 °F | 3.61 in | 0.09 in | 0.00 in | 0.00 in |
| June | 109.40 °F | 69.42 °F | 48.92 °F | 89.60 °F | 59.29 °F | 45.50 °F | 78.04 °F | 48.66 °F | 32.90 °F | 2.02 in | 0.06 in | 0.00 in | 0.00 in |
| July | 104.00 °F | 76.52 °F | 53.60 °F | 83.84 °F | 64.71 °F | 49.10 °F | 71.60 °F | 52.23 °F | 37.40 °F | 1.71 in | 0.04 in | 0.00 in | 0.00 in |
| August | 102.56 °F | 76.82 °F | 51.80 °F | 84.74 °F | 65.10 °F | 51.80 °F | 76.10 °F | 52.59 °F | 37.04 °F | 1.50 in | 0.05 in | 0.00 in | 0.00 in |
| September | 102.20 °F | 70.09 °F | 46.94 °F | 85.10 °F | 59.42 °F | 45.50 °F | 73.40 °F | 47.83 °F | 28.94 °F | 4.00 in | 0.11 in | 0.00 in | 0.00 in |
| October | 85.10 °F | 58.05 °F | 32.00 °F | 69.26 °F | 50.17 °F | 27.66 °F | 58.10 °F | 41.76 °F | 19.40 °F | 5.99 in | 0.25 in | 6.69 in | 0.00 in |
| November | 72.50 °F | 47.66 °F | 19.40 °F | 58.10 °F | 42.15 °F | 12.87 °F | 53.06 °F | 35.96 °F | 1.40 °F | 6.85 in | 0.38 in | 10.79 in | 0.06 in |
| December | 62.60 °F | 42.18 °F | 15.98 °F | 53.24 °F | 37.29 °F | 13.95 °F | 51.98 °F | 32.15 °F | 3.20 °F | 7.16 in | 0.37 in | 20.31 in | 0.30 in |
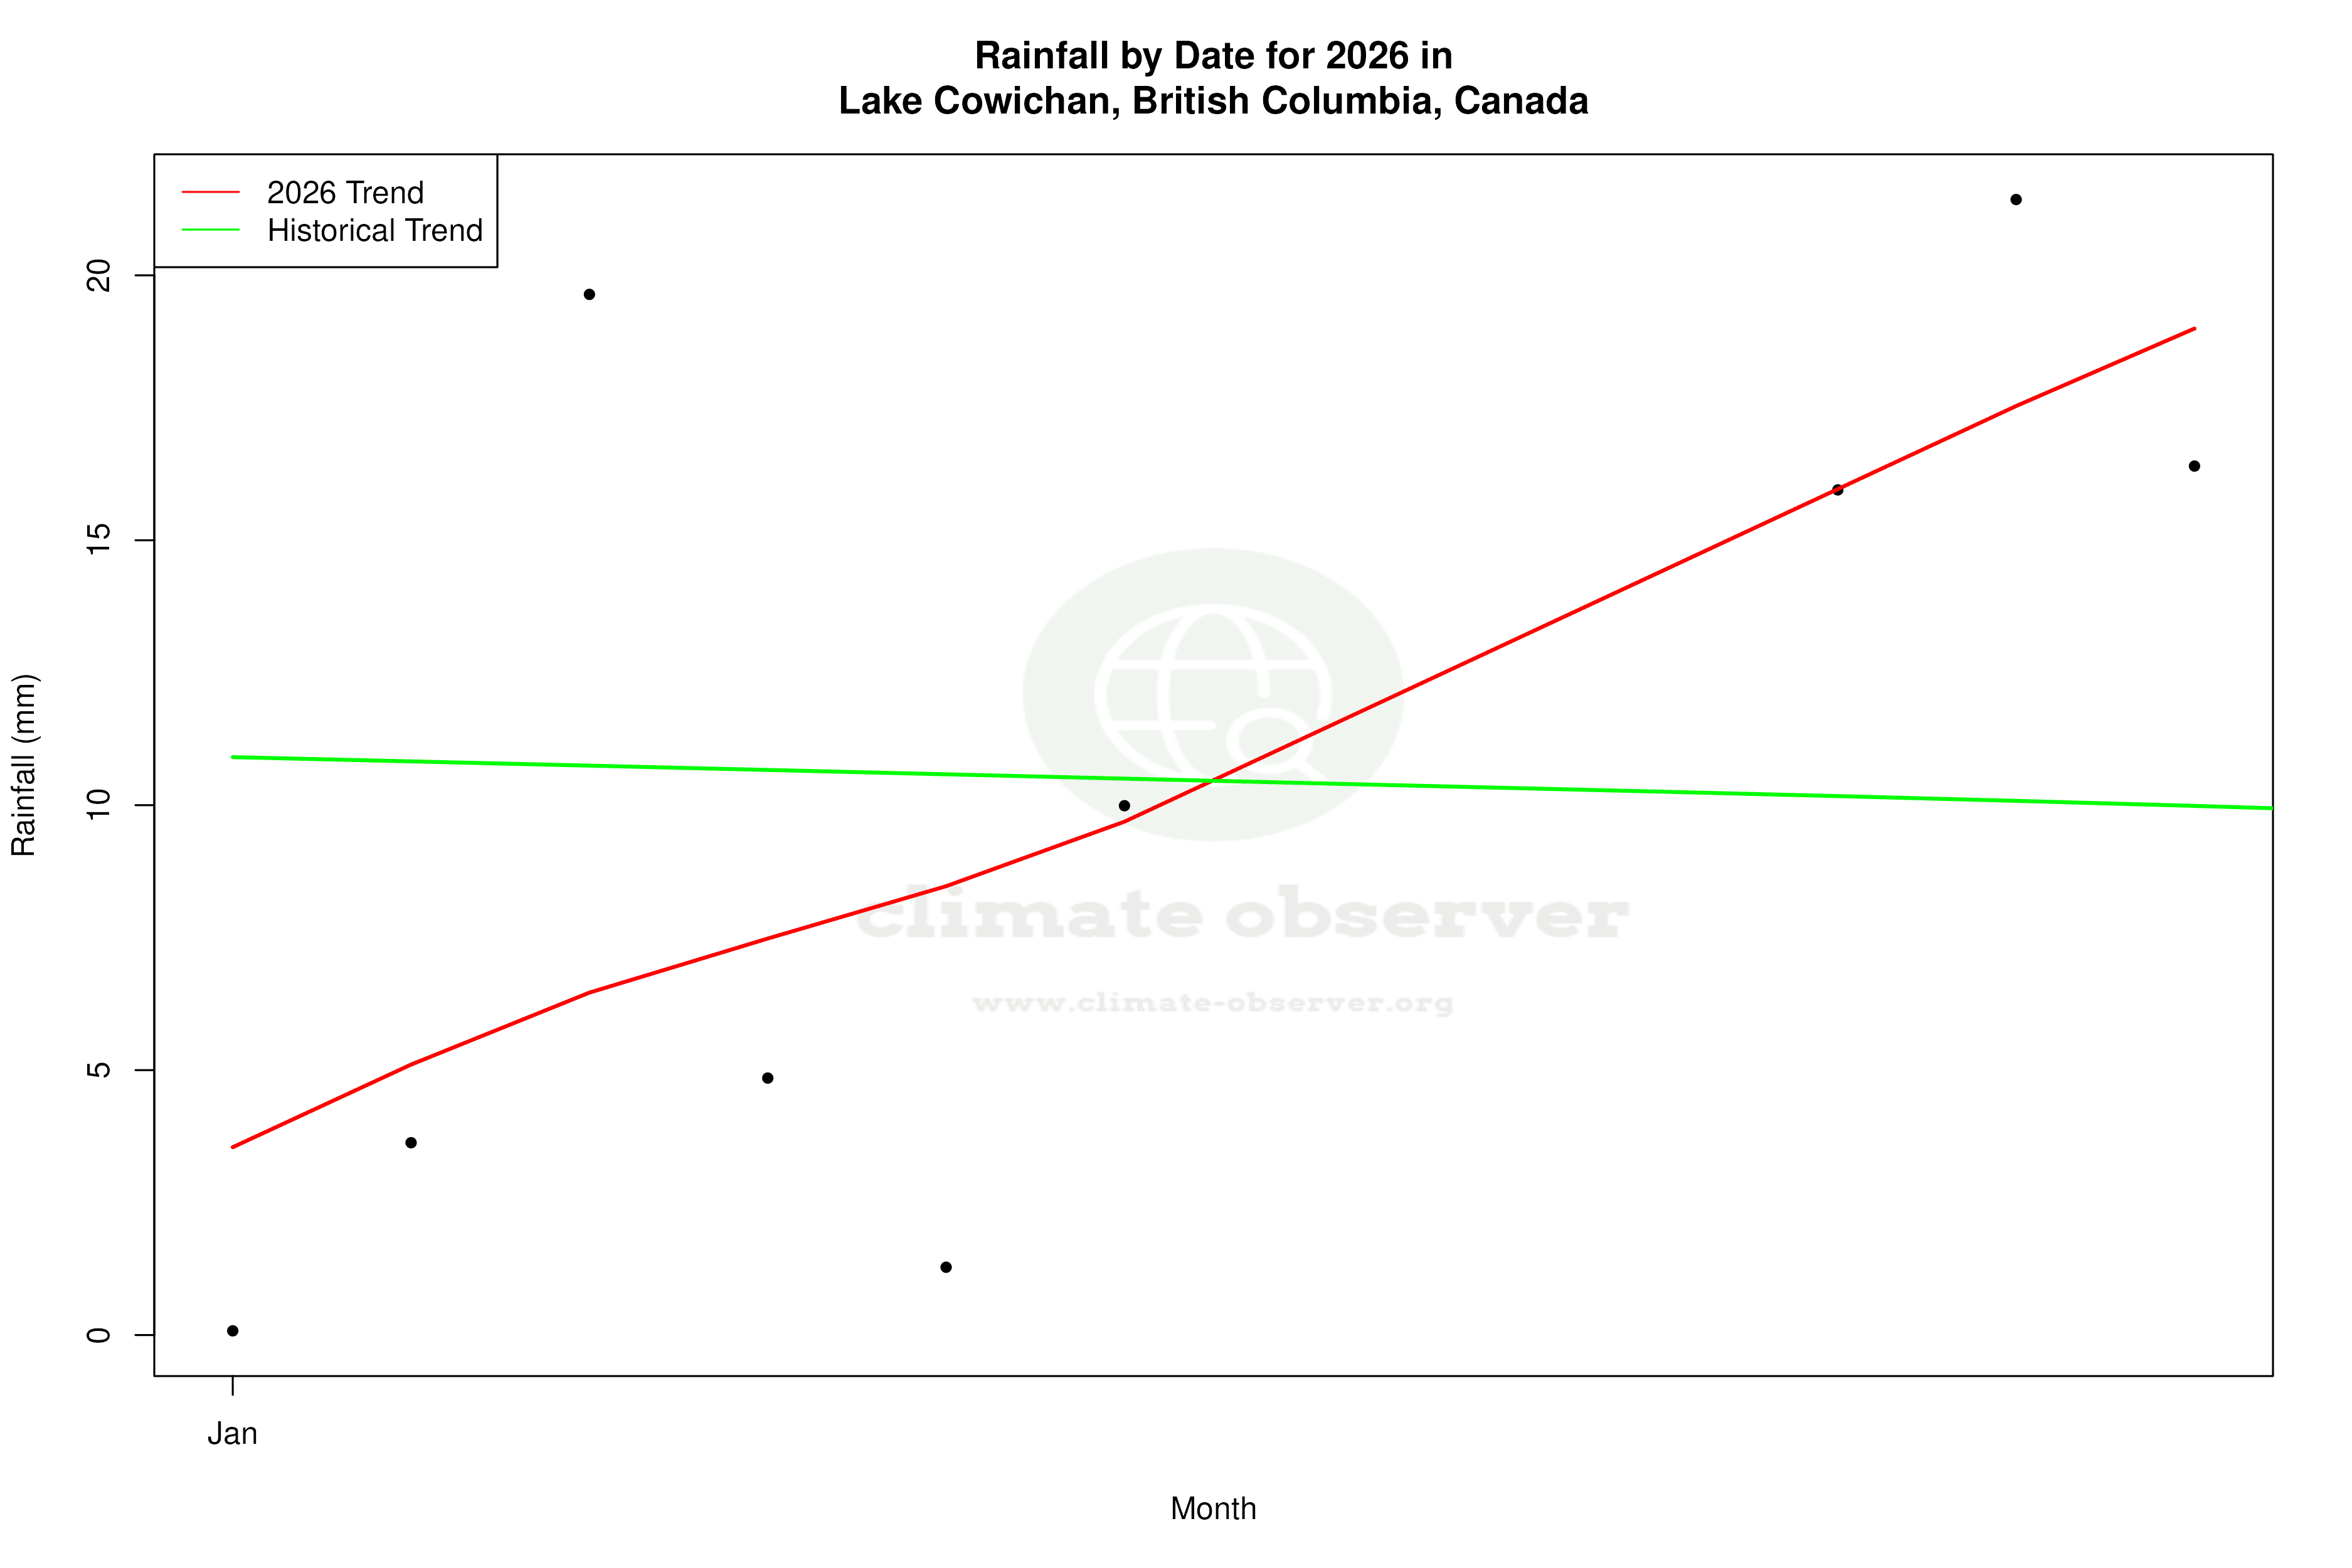
Data Visualisations
Remove WatermarksCurrent Year Climate Trends vs Historical
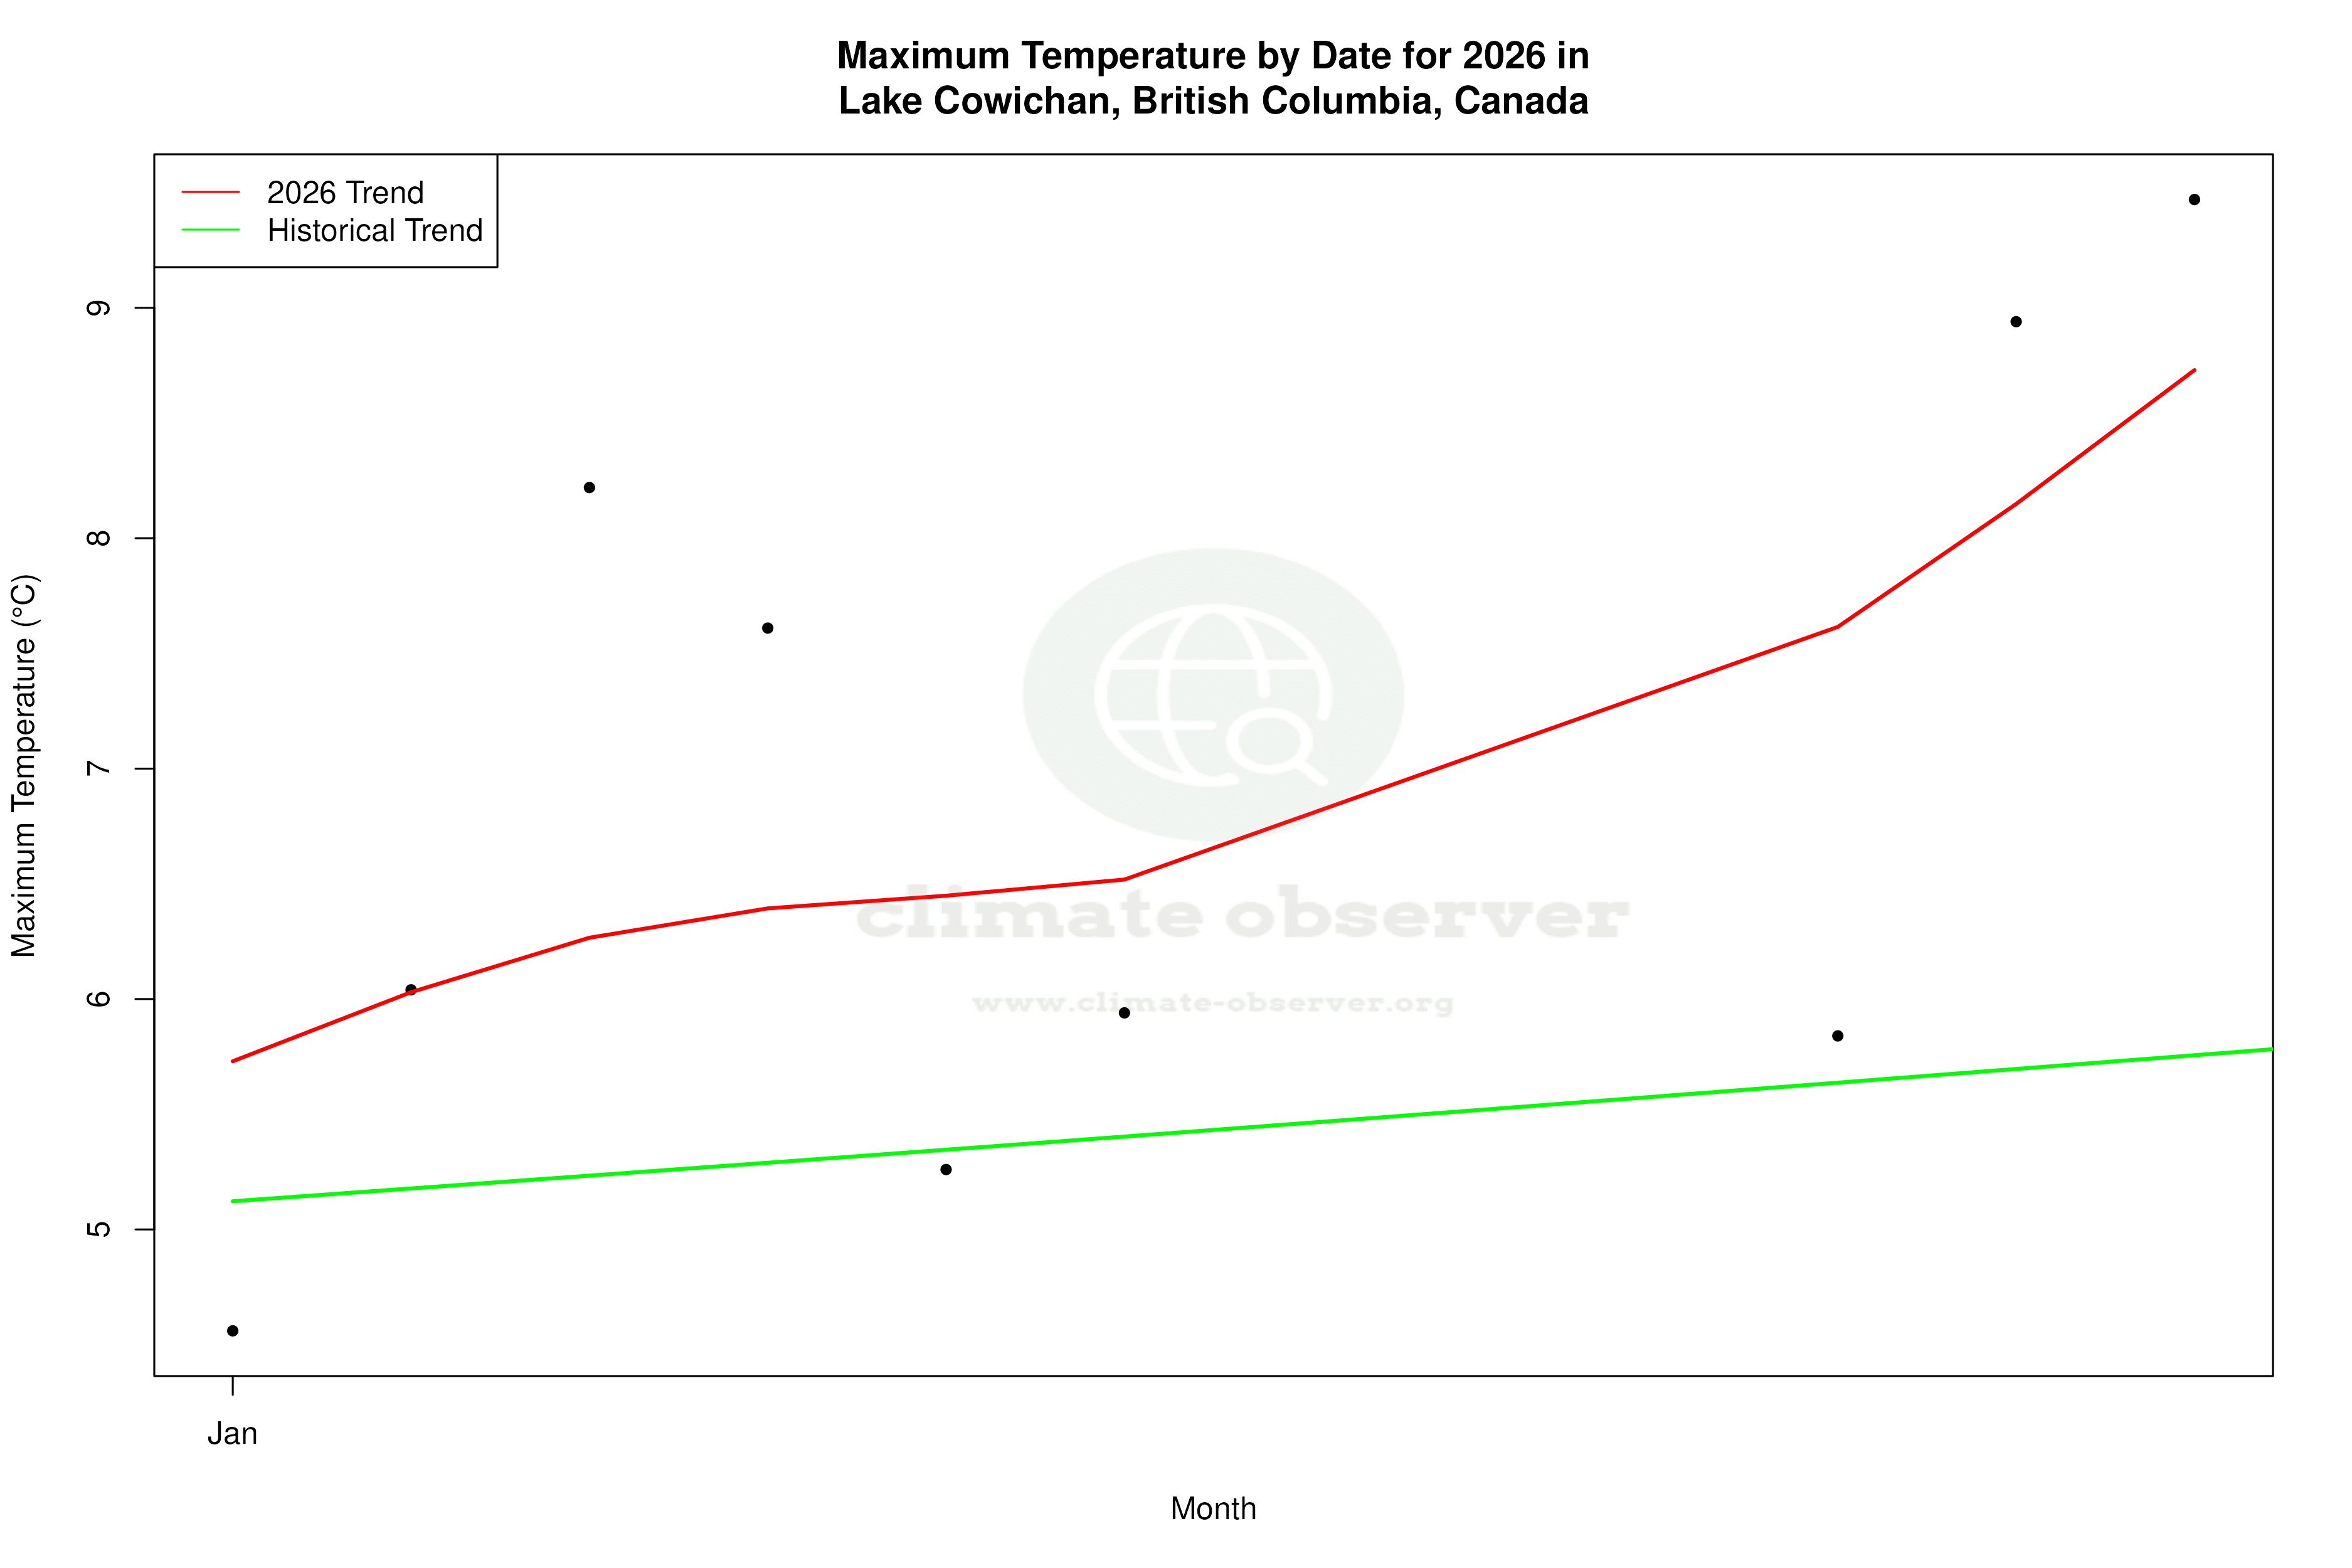


Max Temperature this Year | 1 of 6
Climate 12-Month Moving Averages


Max Temperature 12-Month MA | 1 of 6
Daily Data Points and Averages Throughout the Year


Average Max Temperature Throughout Year | 1 of 5
