Climate for Station: Victoria Gonzales Hts, British Columbia, Canada
Loading live weather...
Climate Analysis & Overview
Victoria Gonzales Heights presents a complex climate profile with a nuanced interplay between cooling trends and historical warming. While recent 10-year data indicates a cooling trend, the all-time data suggests a slight warming. Precipitation patterns have become more evenly distributed, reflecting broader regional climate shifts.
Climate Classification and Geographic Influence
Victoria Gonzales Heights, located at coordinates 48.4167, -123.3167, is situated within the Köppen climate classification of Cfb, indicating a temperate oceanic climate. This classification is characterised by mild temperatures and significant precipitation year-round. The proximity to the Pacific Ocean moderates temperature extremes, while the surrounding topography, including the Olympic Mountains to the south, influences local weather patterns by providing a rain shadow effect that can alter precipitation distribution.
Temperature Trends: A Tale of Two Directions
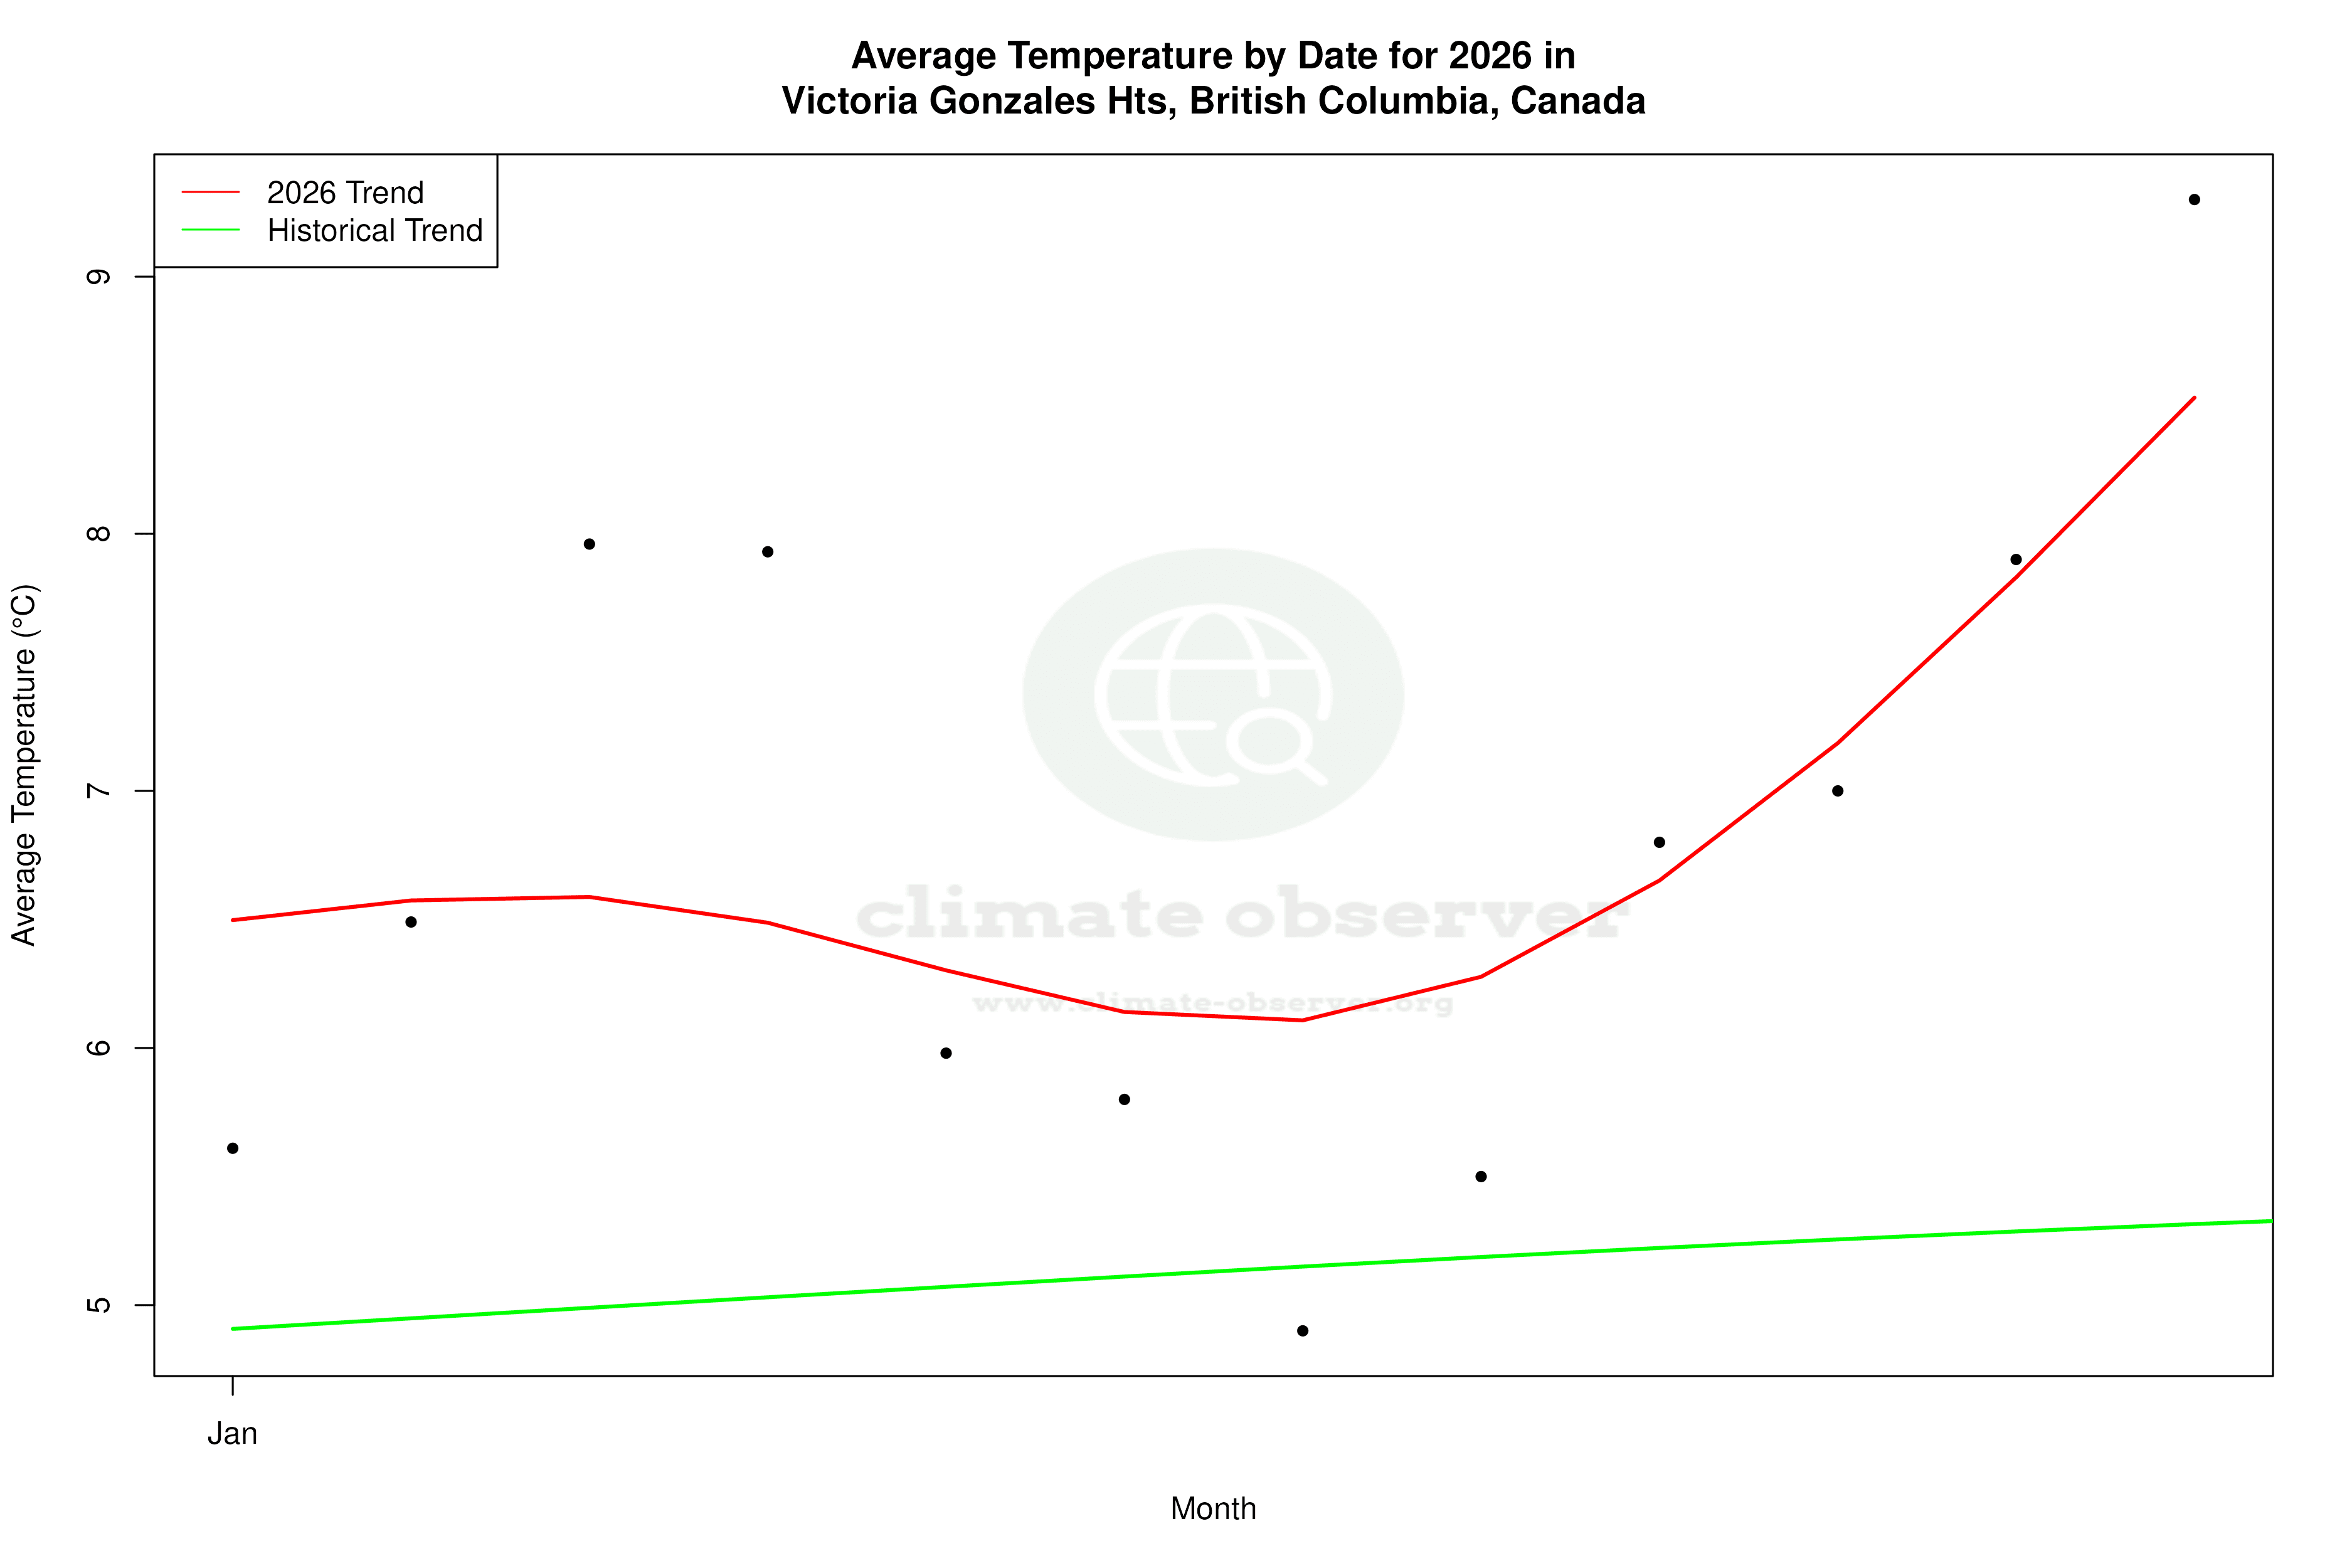
Analysing the temperature trends reveals a dichotomy. Over the last decade, there has been a cooling trend, with average highs decreasing by 0.63°C (1.13°F) and lows by 0.22°C (0.40°F). However, the all-time data tells a different story, with a slight warming trend: highs have increased by 0.10°C (0.18°F) and lows by 0.09°C (0.16°F). This indicates that while recent years have experienced a cooling phase, the long-term trajectory remains one of gradual warming. Such trends are crucial for understanding regional climate dynamics and aligning with Canada's climate goals, which focus on mitigating warming impacts.
Precipitation Patterns: A Shift Towards Evenness
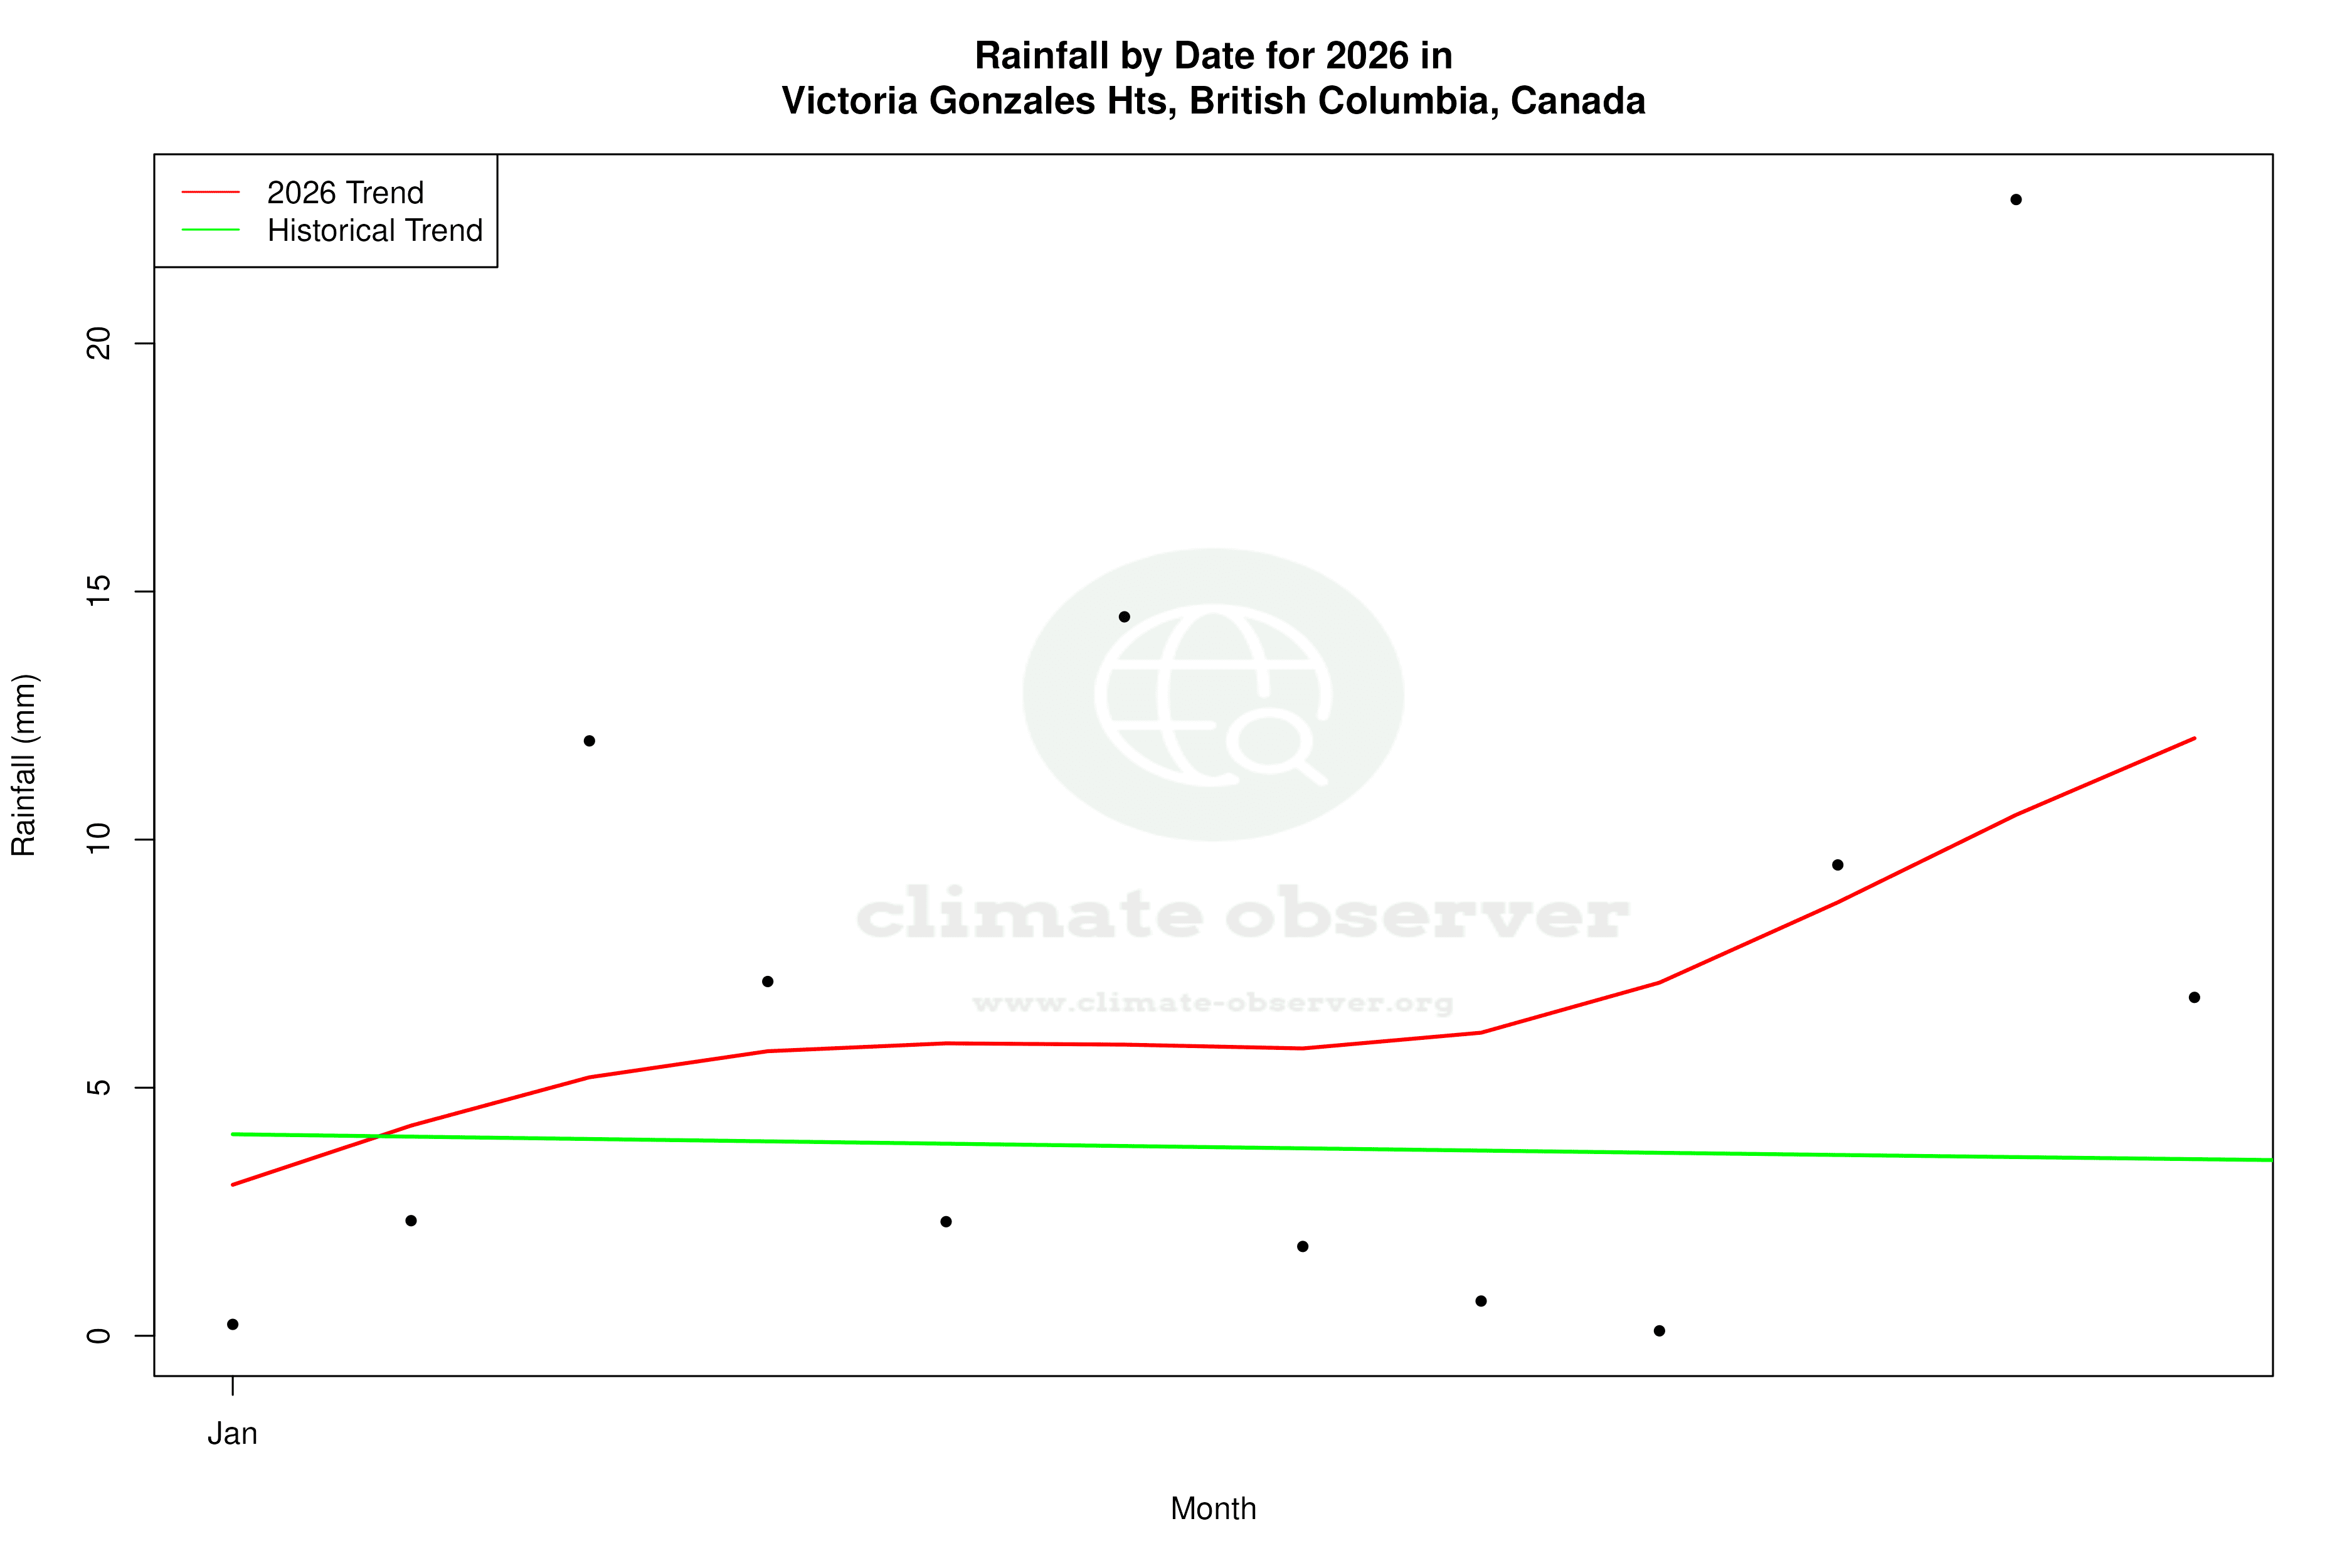
The Precipitation Concentration Index (PCI) for Victoria Gonzales Heights has decreased from a baseline of 12.93 to a current value of 10.69. This change signifies a more even distribution of precipitation events, moving away from concentrated heavy rainfall to more consistent, moderate precipitation. This shift can be beneficial for agriculture and water management, reducing the risk of flooding and soil erosion associated with intense precipitation events.
Extreme Temperature Records
Victoria Gonzales Heights has experienced notable temperature extremes, with a record high of 35.24°C (95.43°F) and a record low of -14.4°C (6.08°F). These records underscore the variability within this temperate climate and highlight the potential for extreme weather events, which may become more frequent with ongoing climate change.
Regional Climate Goals and Recent Events
In the context of Canada's regional climate initiatives, the observed trends in Victoria Gonzales Heights are significant. The slight warming over the long term aligns with broader national concerns about climate change impacts. Recent weather events, such as unseasonably warm winters or unexpected frost events, serve as reminders of the climate's inherent variability and the importance of adaptive strategies in regional planning.
Station Statistics
10-Year Trend
High: -1.05 °F/decade
Low: +0.14 °F/decade
Rain: +0.021 in/decade
25-Year Trend
High: +0.10 °F/decade
Low: +0.14 °F/decade
Rain: +0.008 in/decade
50-Year Trend
High: +0.55 °F/decade
Low: +0.03 °F/decade
Rain: -0.000 in/decade
All-Time Trend
High: +0.17 °F/decade
Low: +0.16 °F/decade
Rain: -0.001 in/decade
Percentage Above-Average Days
Last 12 Months: 48.5%
This Year: 53.5%
Precipitation Concentration Index (PCI) ℹ️
Last 12 Months: 14.5
Historical Average: 14.5
Percentile Rank of Last 12 Months ℹ️
High: 74th percentile
Low: 90th percentile
Rain: 70th percentile
Change in Variance ℹ️
High: +8.2%
Low: +2.1%
Intraday: -1.1%
Data Coverage
84.0%
First Year of Data
1898
Station Location
Historical Weather Records
| Max High | Avg High | Min High | Max Avg | Avg Avg | Min Avg | Max Low | Avg Low | Min Low | Max Precipitation | Avg Precipitation | Max Snow | Avg Snow | |
|---|---|---|---|---|---|---|---|---|---|---|---|---|---|
| Record | 95.43 °F | — | 19.04 °F | 83.50 °F | — | 16.09 °F | 74.82 °F | — | 6.08 °F | 3.28 in | — | 20.98 in | — |
| January | 62.78 °F | 44.09 °F | 19.04 °F | 53.42 °F | 41.69 °F | 19.74 °F | 50.18 °F | 36.61 °F | 6.08 °F | 3.05 in | 0.13 in | 10.98 in | 0.15 in |
| February | 63.32 °F | 46.68 °F | 20.98 °F | 54.14 °F | 42.24 °F | 16.09 °F | 48.92 °F | 37.58 °F | 11.23 °F | 3.18 in | 0.10 in | 20.98 in | 0.09 in |
| March | 69.80 °F | 50.53 °F | 28.94 °F | 58.28 °F | 45.24 °F | 29.84 °F | 51.08 °F | 39.35 °F | 19.04 °F | 2.67 in | 0.07 in | 7.01 in | 0.03 in |
| April | 78.44 °F | 55.69 °F | 41.00 °F | 66.56 °F | 48.96 °F | 37.94 °F | 57.02 °F | 42.53 °F | 28.04 °F | 1.45 in | 0.04 in | 2.91 in | 0.00 in |
| May | 87.62 °F | 61.06 °F | 47.66 °F | 73.40 °F | 53.68 °F | 43.70 °F | 62.60 °F | 46.69 °F | 33.98 °F | 1.48 in | 0.03 in | 0.00 in | 0.00 in |
| June | 95.43 °F | 65.02 °F | 48.02 °F | 83.50 °F | 57.34 °F | 47.84 °F | 74.82 °F | 50.12 °F | 39.02 °F | 1.32 in | 0.03 in | 0.00 in | 0.00 in |
| July | 91.94 °F | 68.53 °F | 53.06 °F | 79.34 °F | 60.45 °F | 52.52 °F | 64.27 °F | 52.50 °F | 42.98 °F | 0.86 in | 0.02 in | 0.00 in | 0.00 in |
| August | 92.12 °F | 68.71 °F | 55.04 °F | 78.53 °F | 61.06 °F | 53.24 °F | 70.57 °F | 52.87 °F | 42.98 °F | 1.15 in | 0.02 in | 0.00 in | 0.00 in |
| September | 89.06 °F | 65.23 °F | 48.02 °F | 74.66 °F | 58.11 °F | 49.64 °F | 64.04 °F | 50.69 °F | 37.04 °F | 1.70 in | 0.04 in | 0.00 in | 0.00 in |
| October | 77.54 °F | 57.01 °F | 35.06 °F | 66.74 °F | 51.46 °F | 32.65 °F | 59.54 °F | 46.20 °F | 27.75 °F | 2.01 in | 0.09 in | 0.47 in | 0.00 in |
| November | 66.02 °F | 49.38 °F | 23.09 °F | 56.12 °F | 45.30 °F | 18.79 °F | 53.60 °F | 41.33 °F | 12.85 °F | 2.86 in | 0.14 in | 8.50 in | 0.03 in |
| December | 59.00 °F | 45.15 °F | 20.35 °F | 53.78 °F | 41.44 °F | 16.29 °F | 50.00 °F | 38.00 °F | 12.02 °F | 3.28 in | 0.14 in | 10.39 in | 0.07 in |
Data Visualisations
Remove WatermarksCurrent Year Climate Trends vs Historical
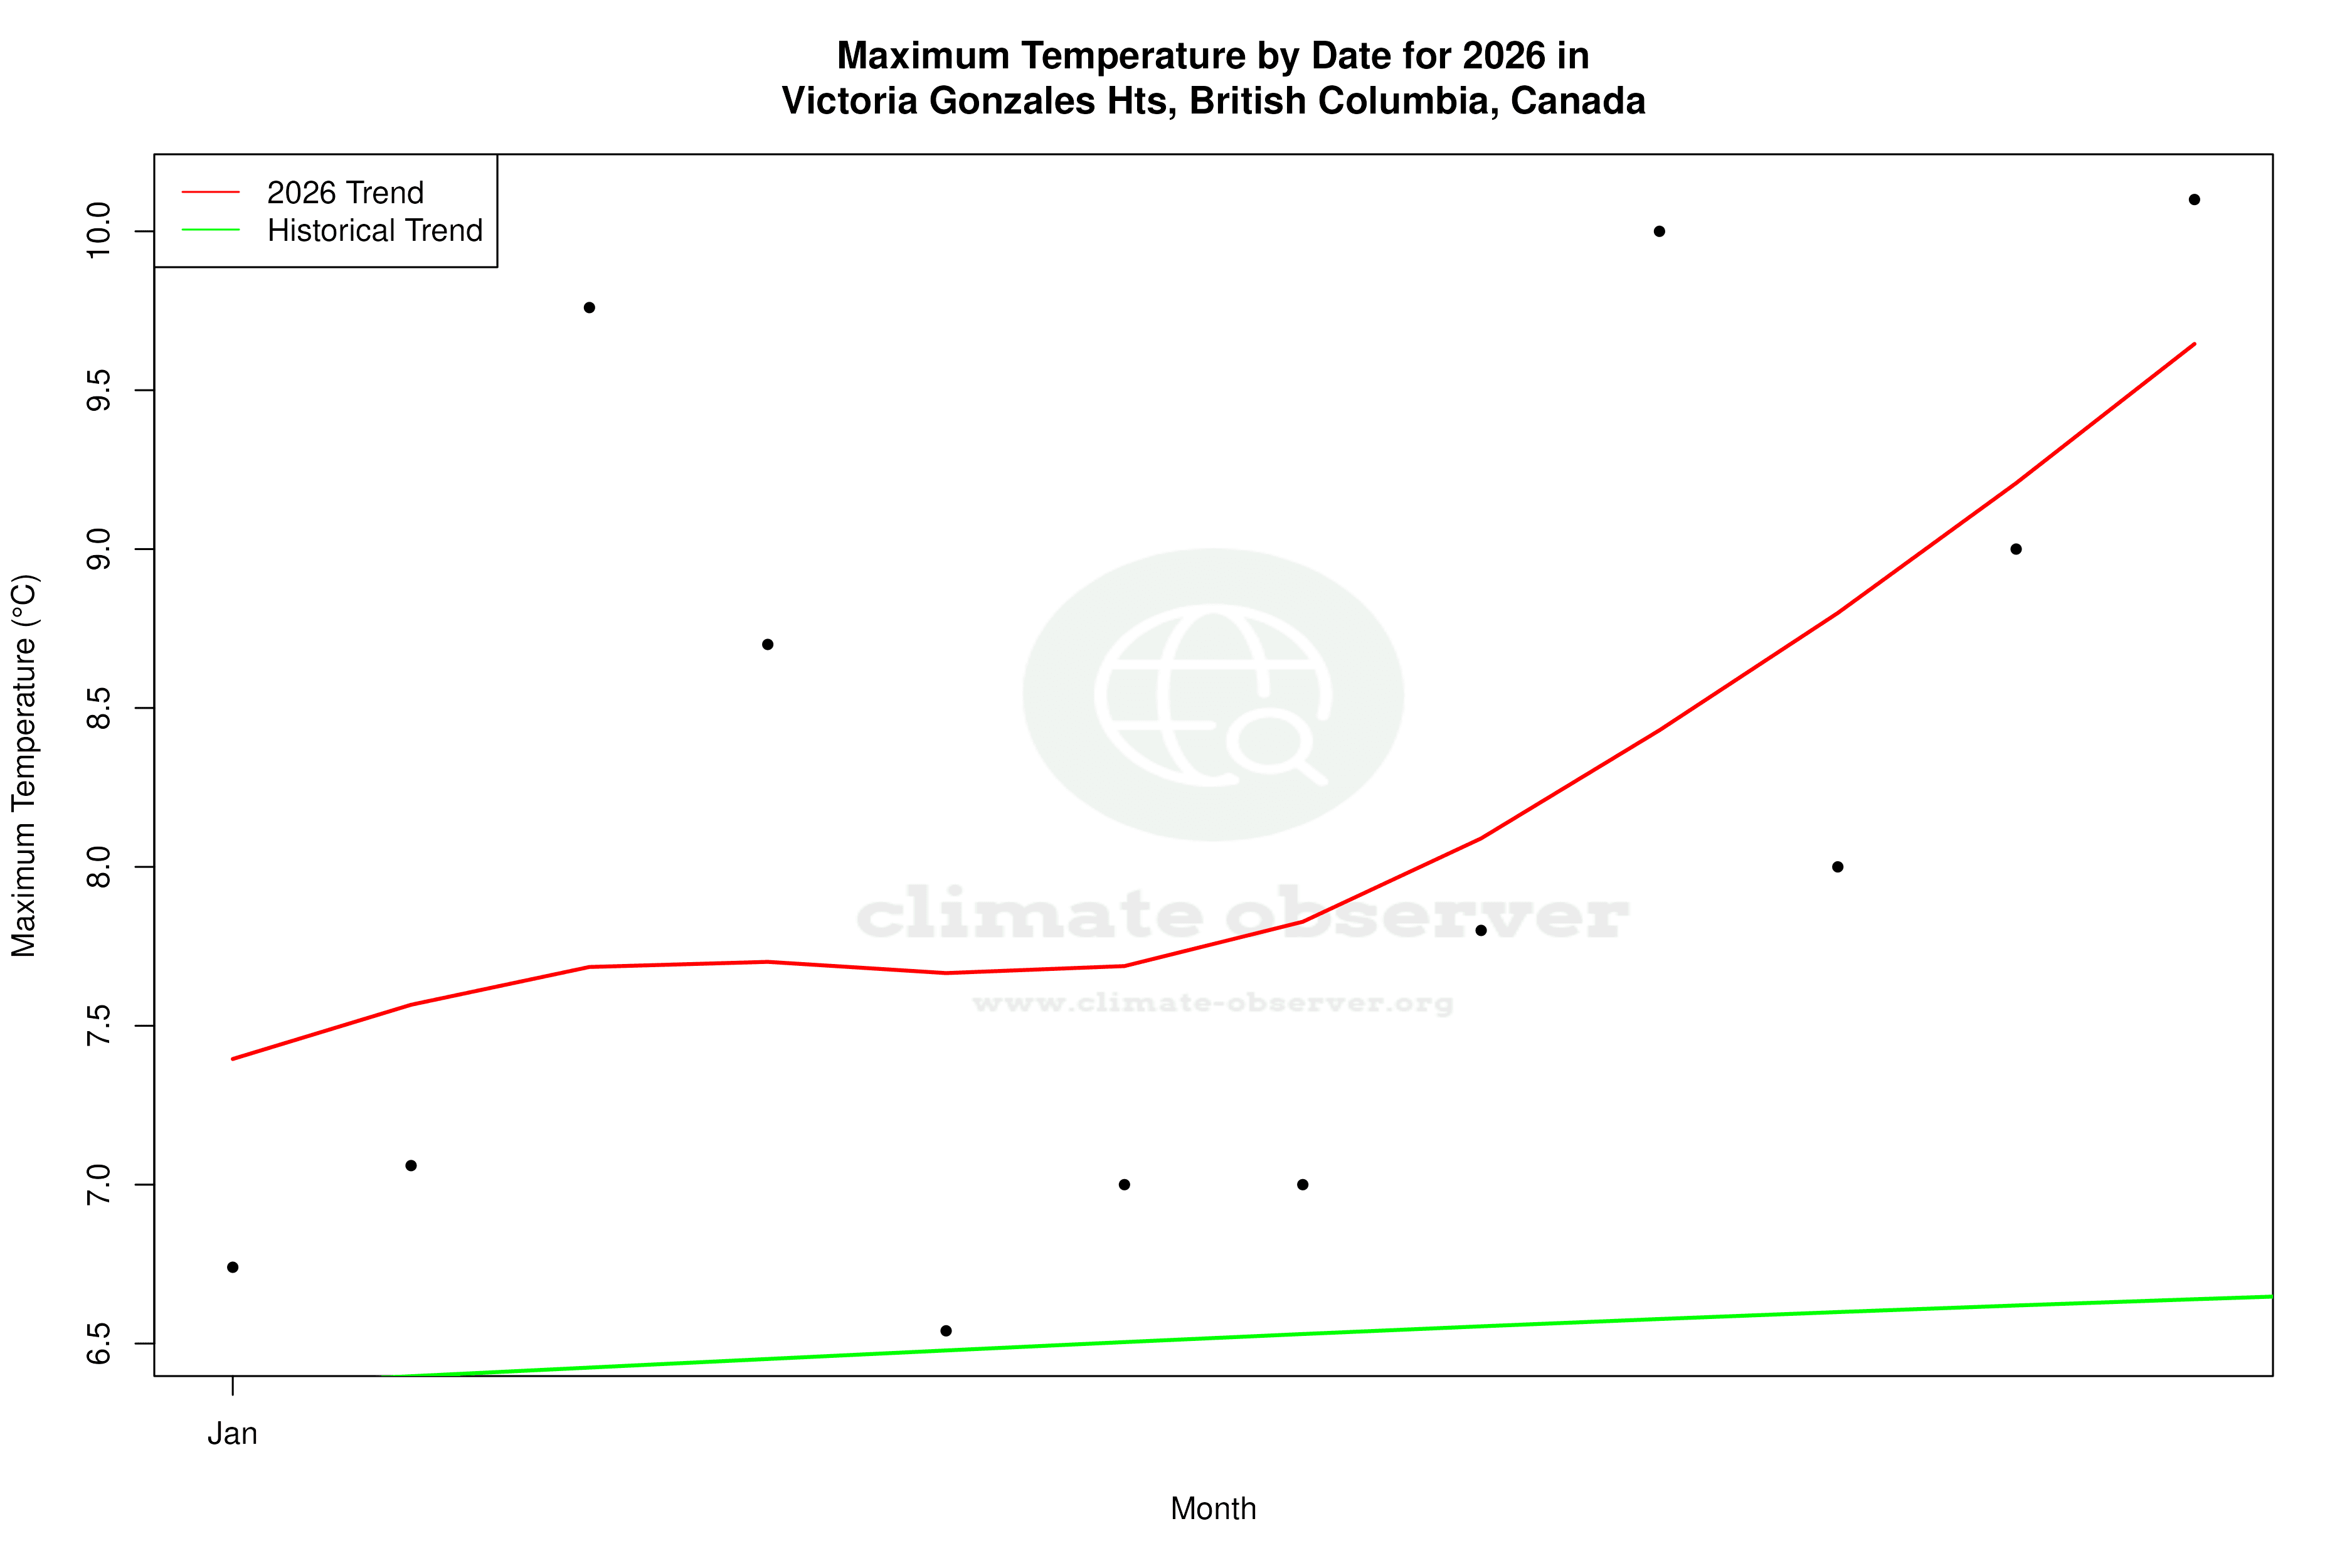


Max Temperature this Year | 1 of 6
Climate 12-Month Moving Averages


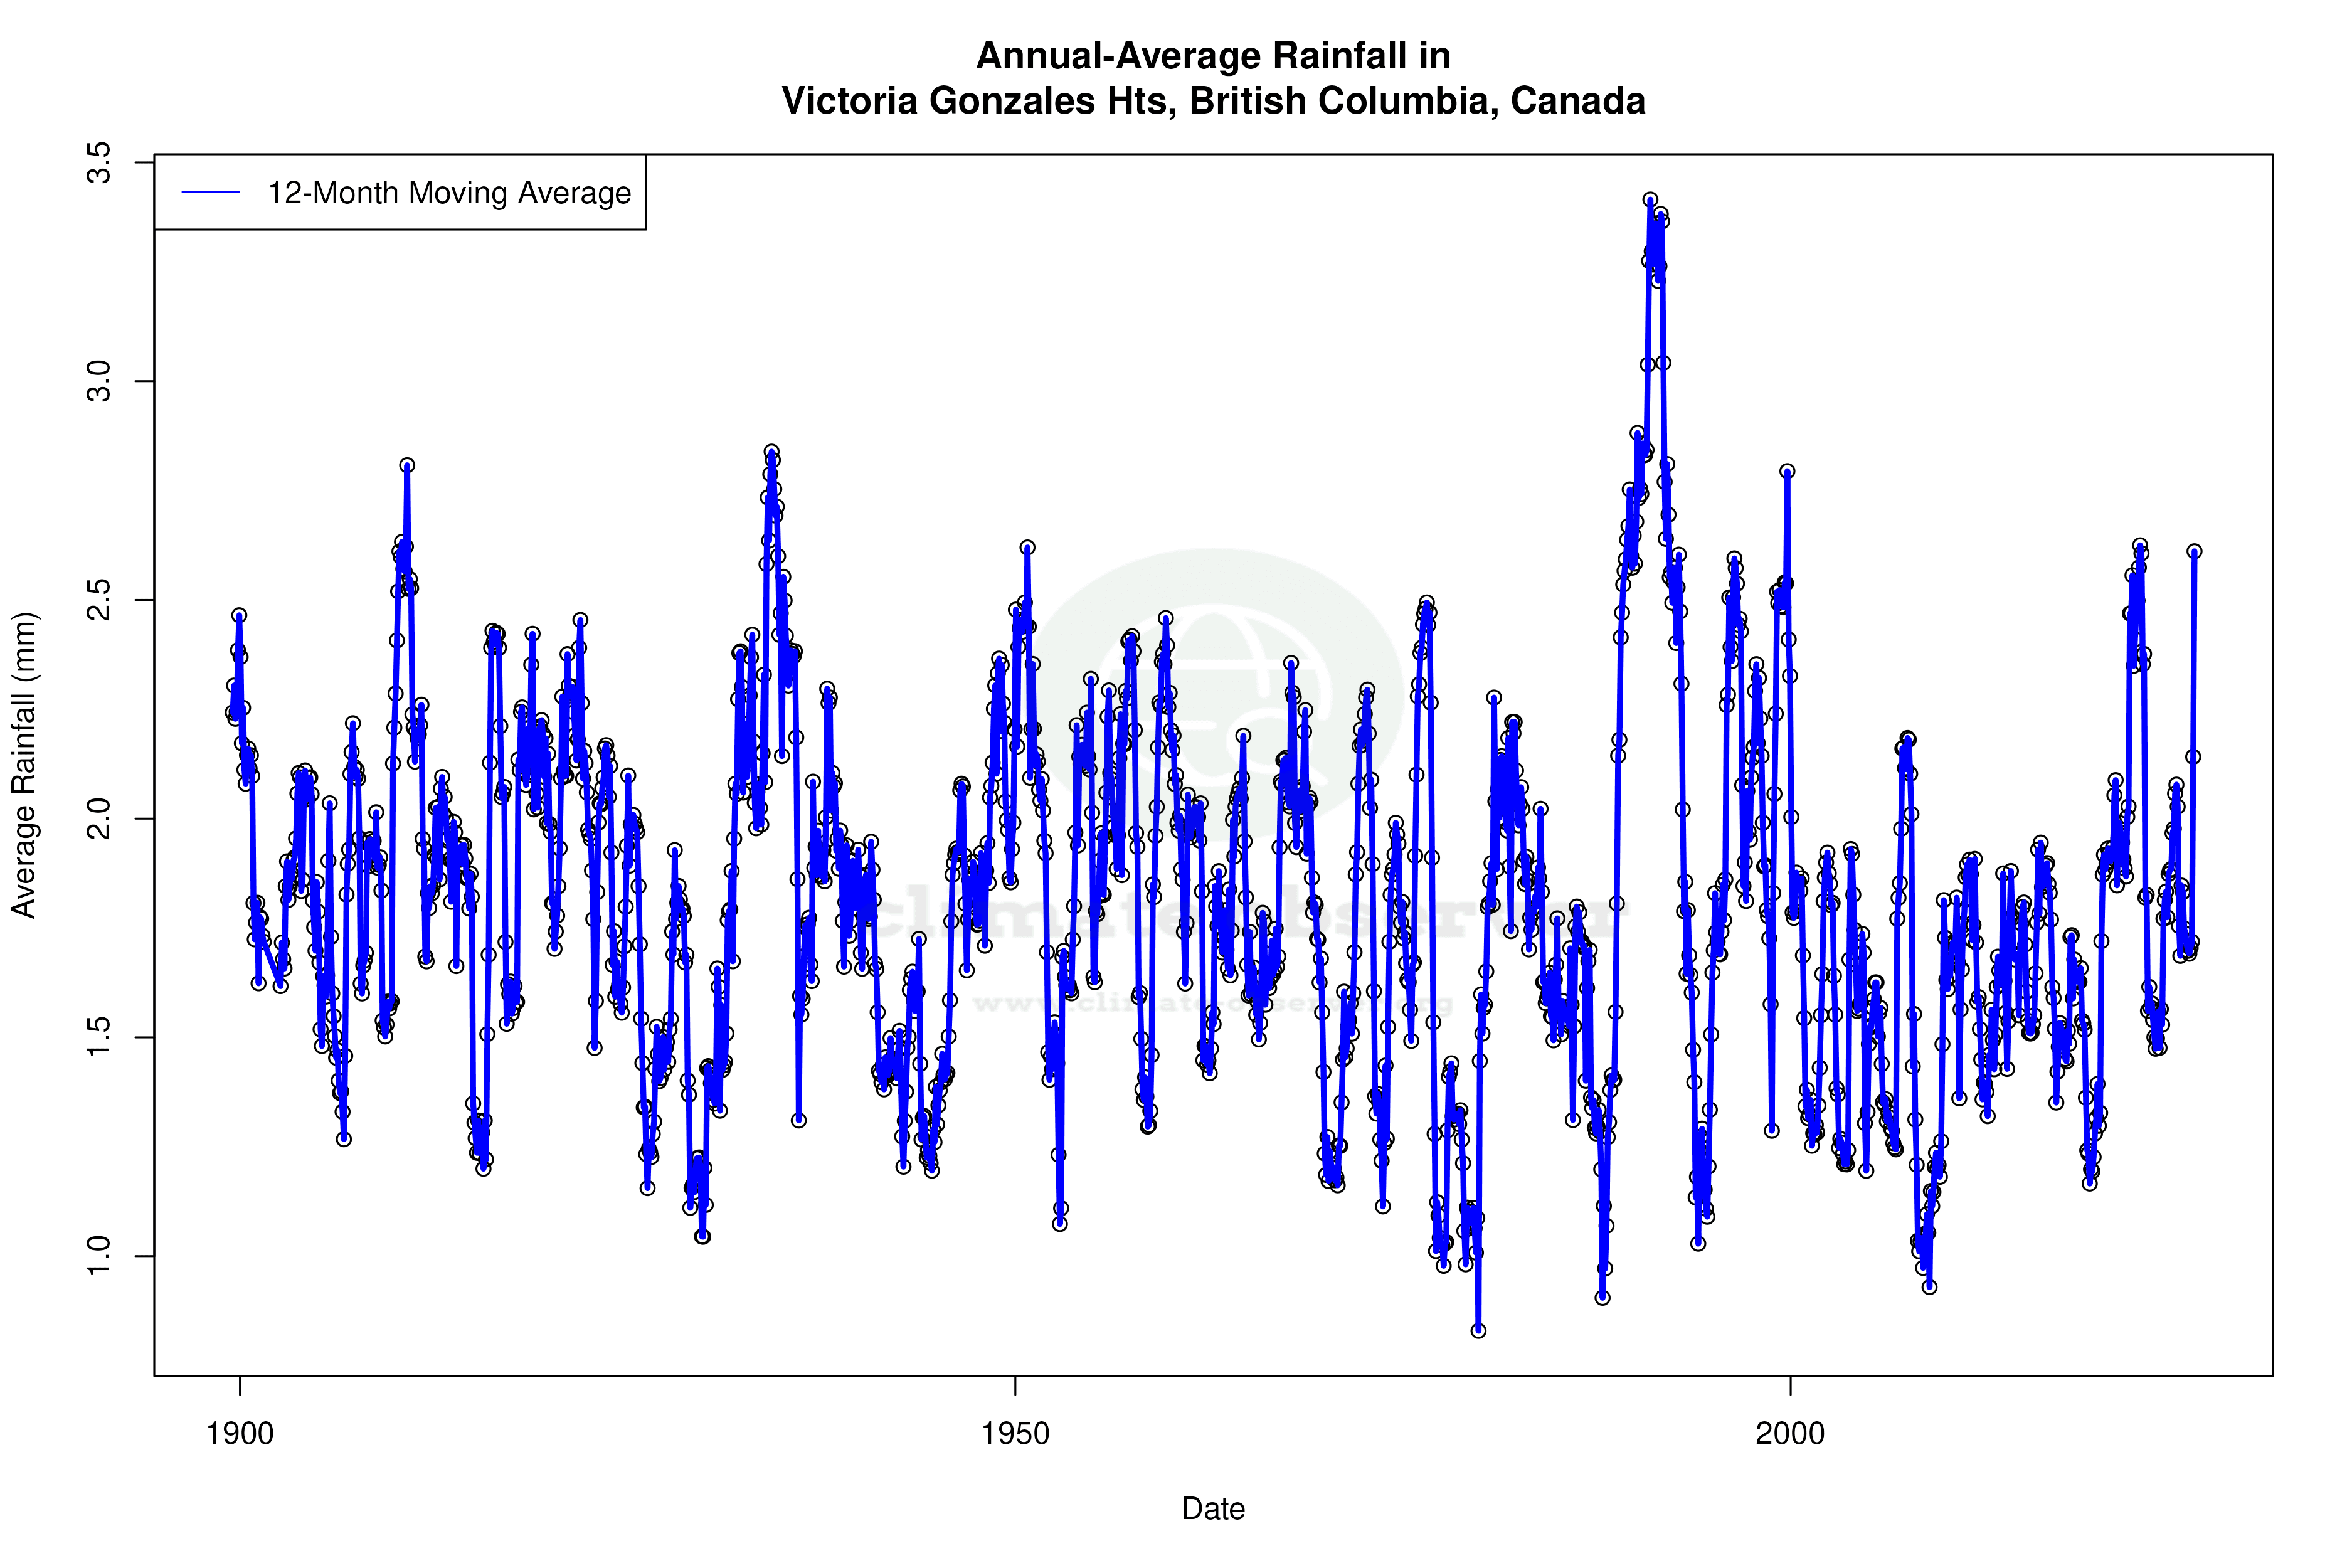


Max Temperature 12-Month MA | 1 of 6
Daily Data Points and Averages Throughout the Year
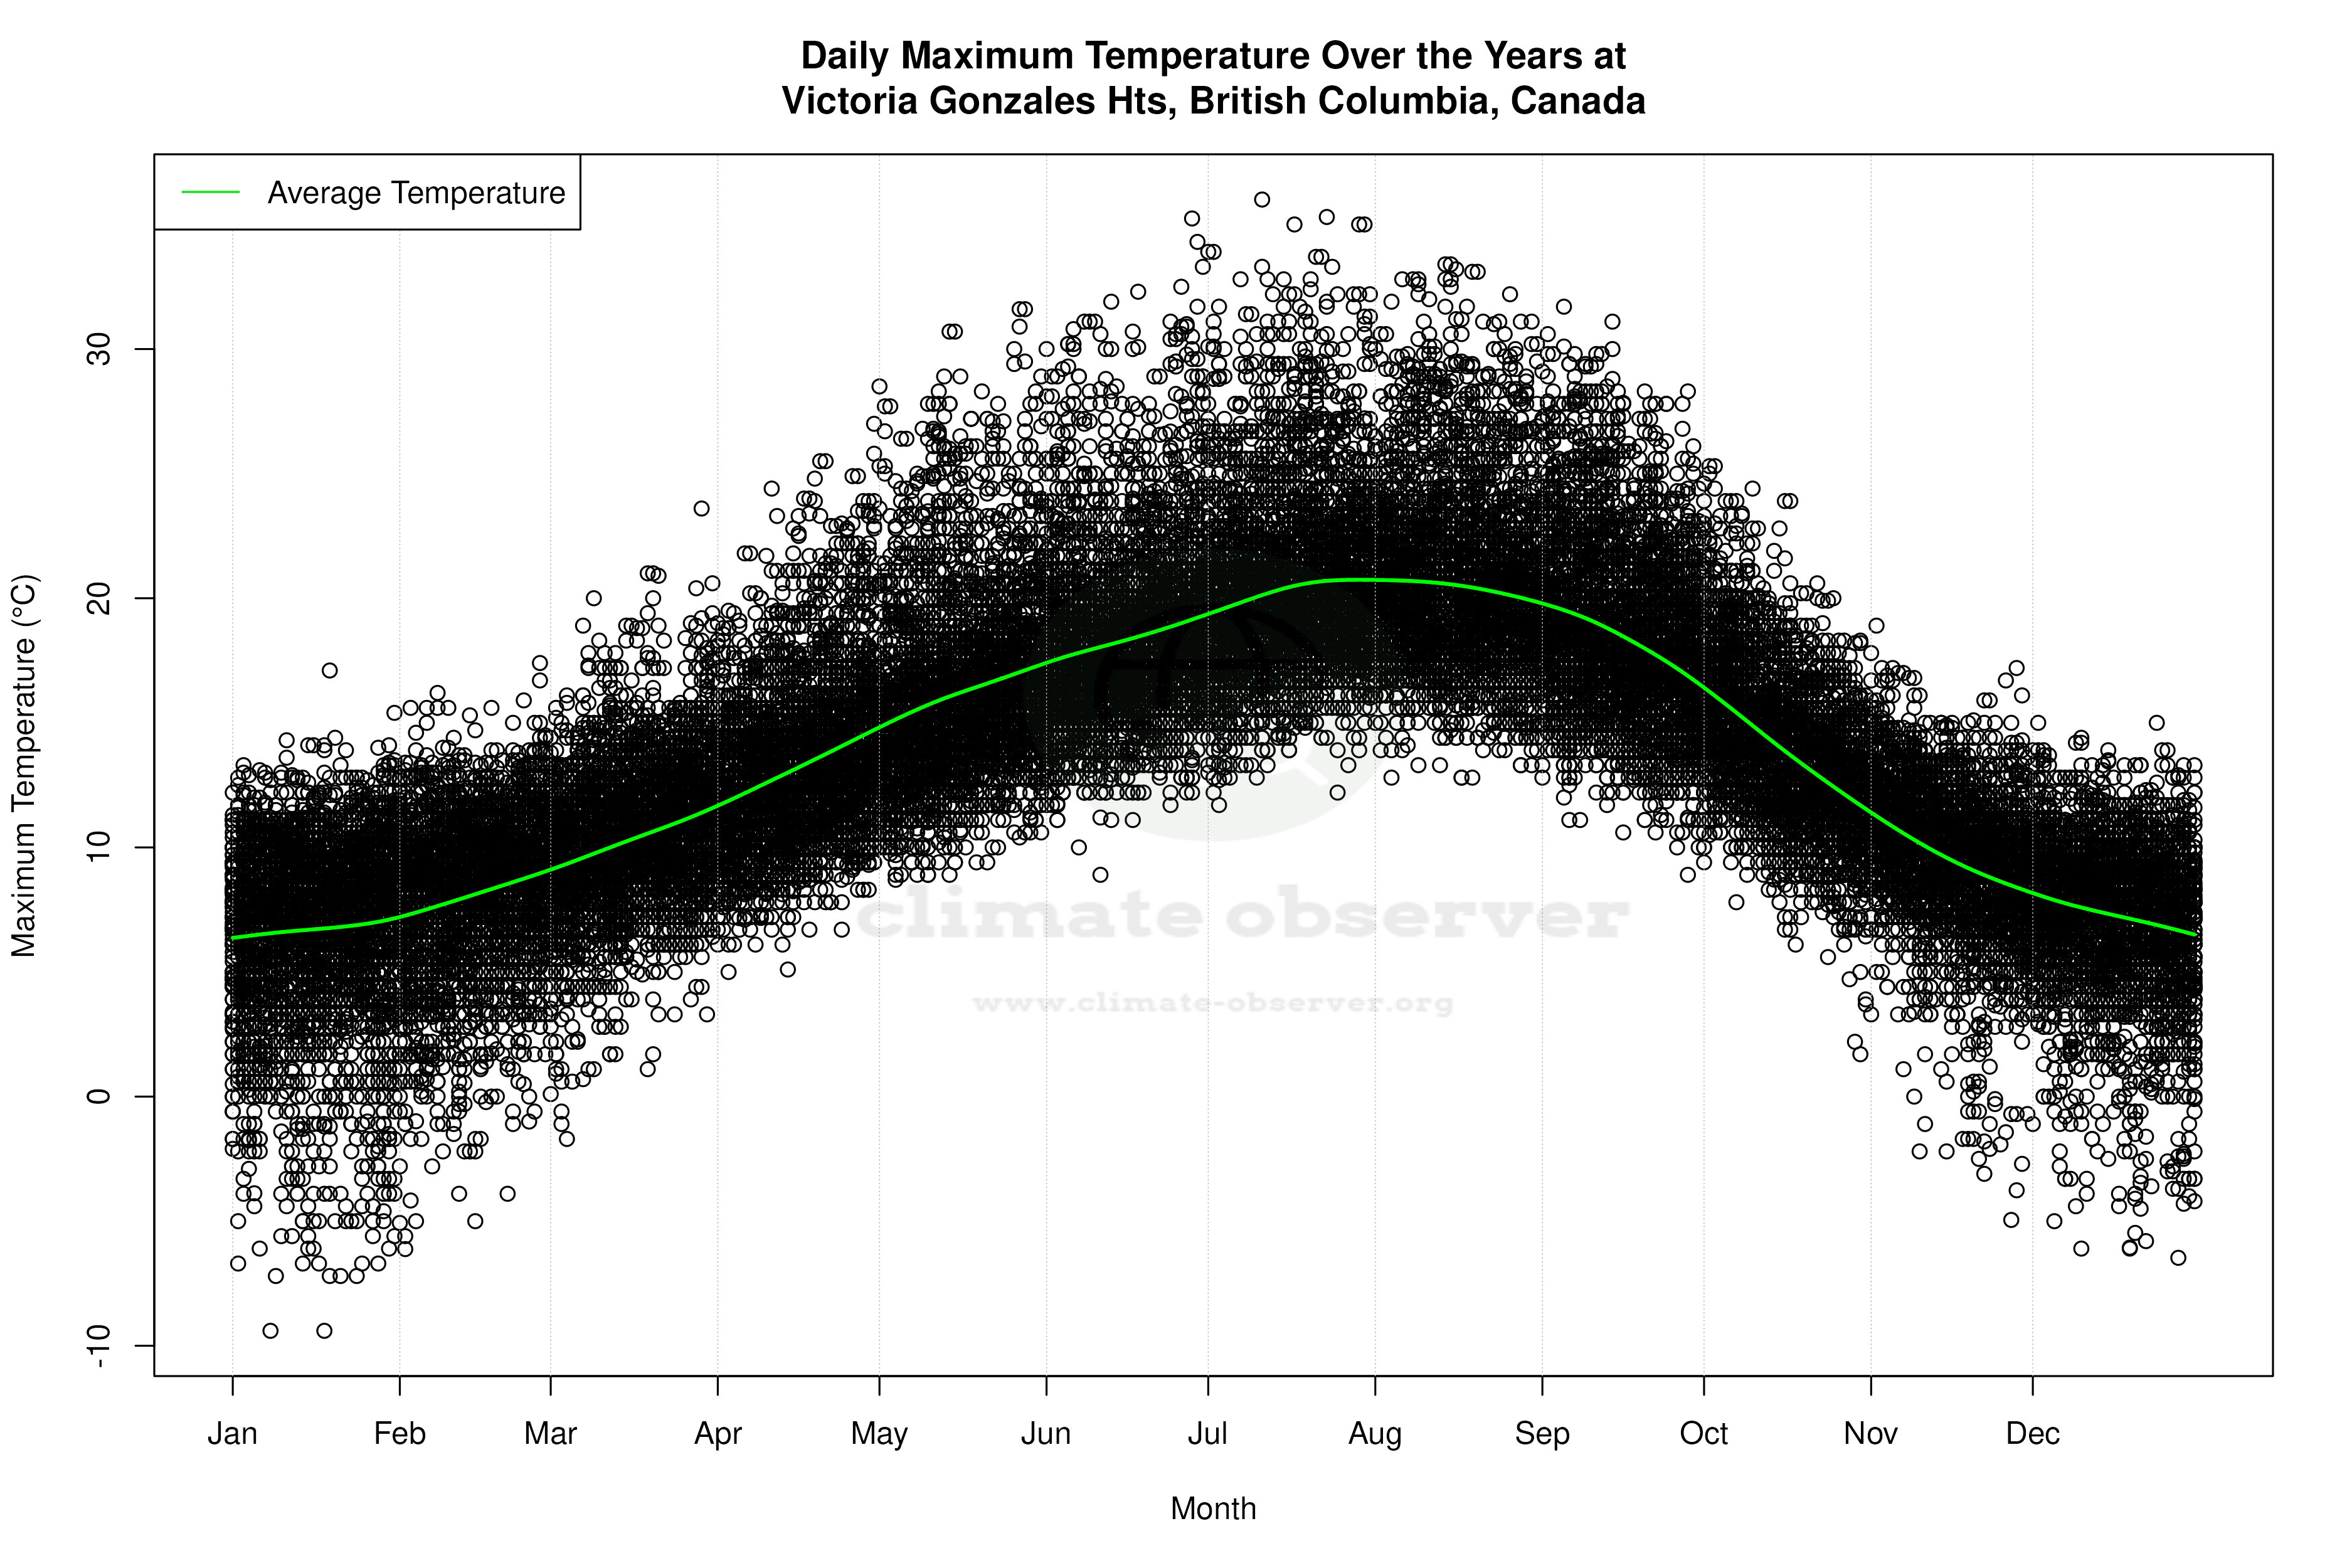
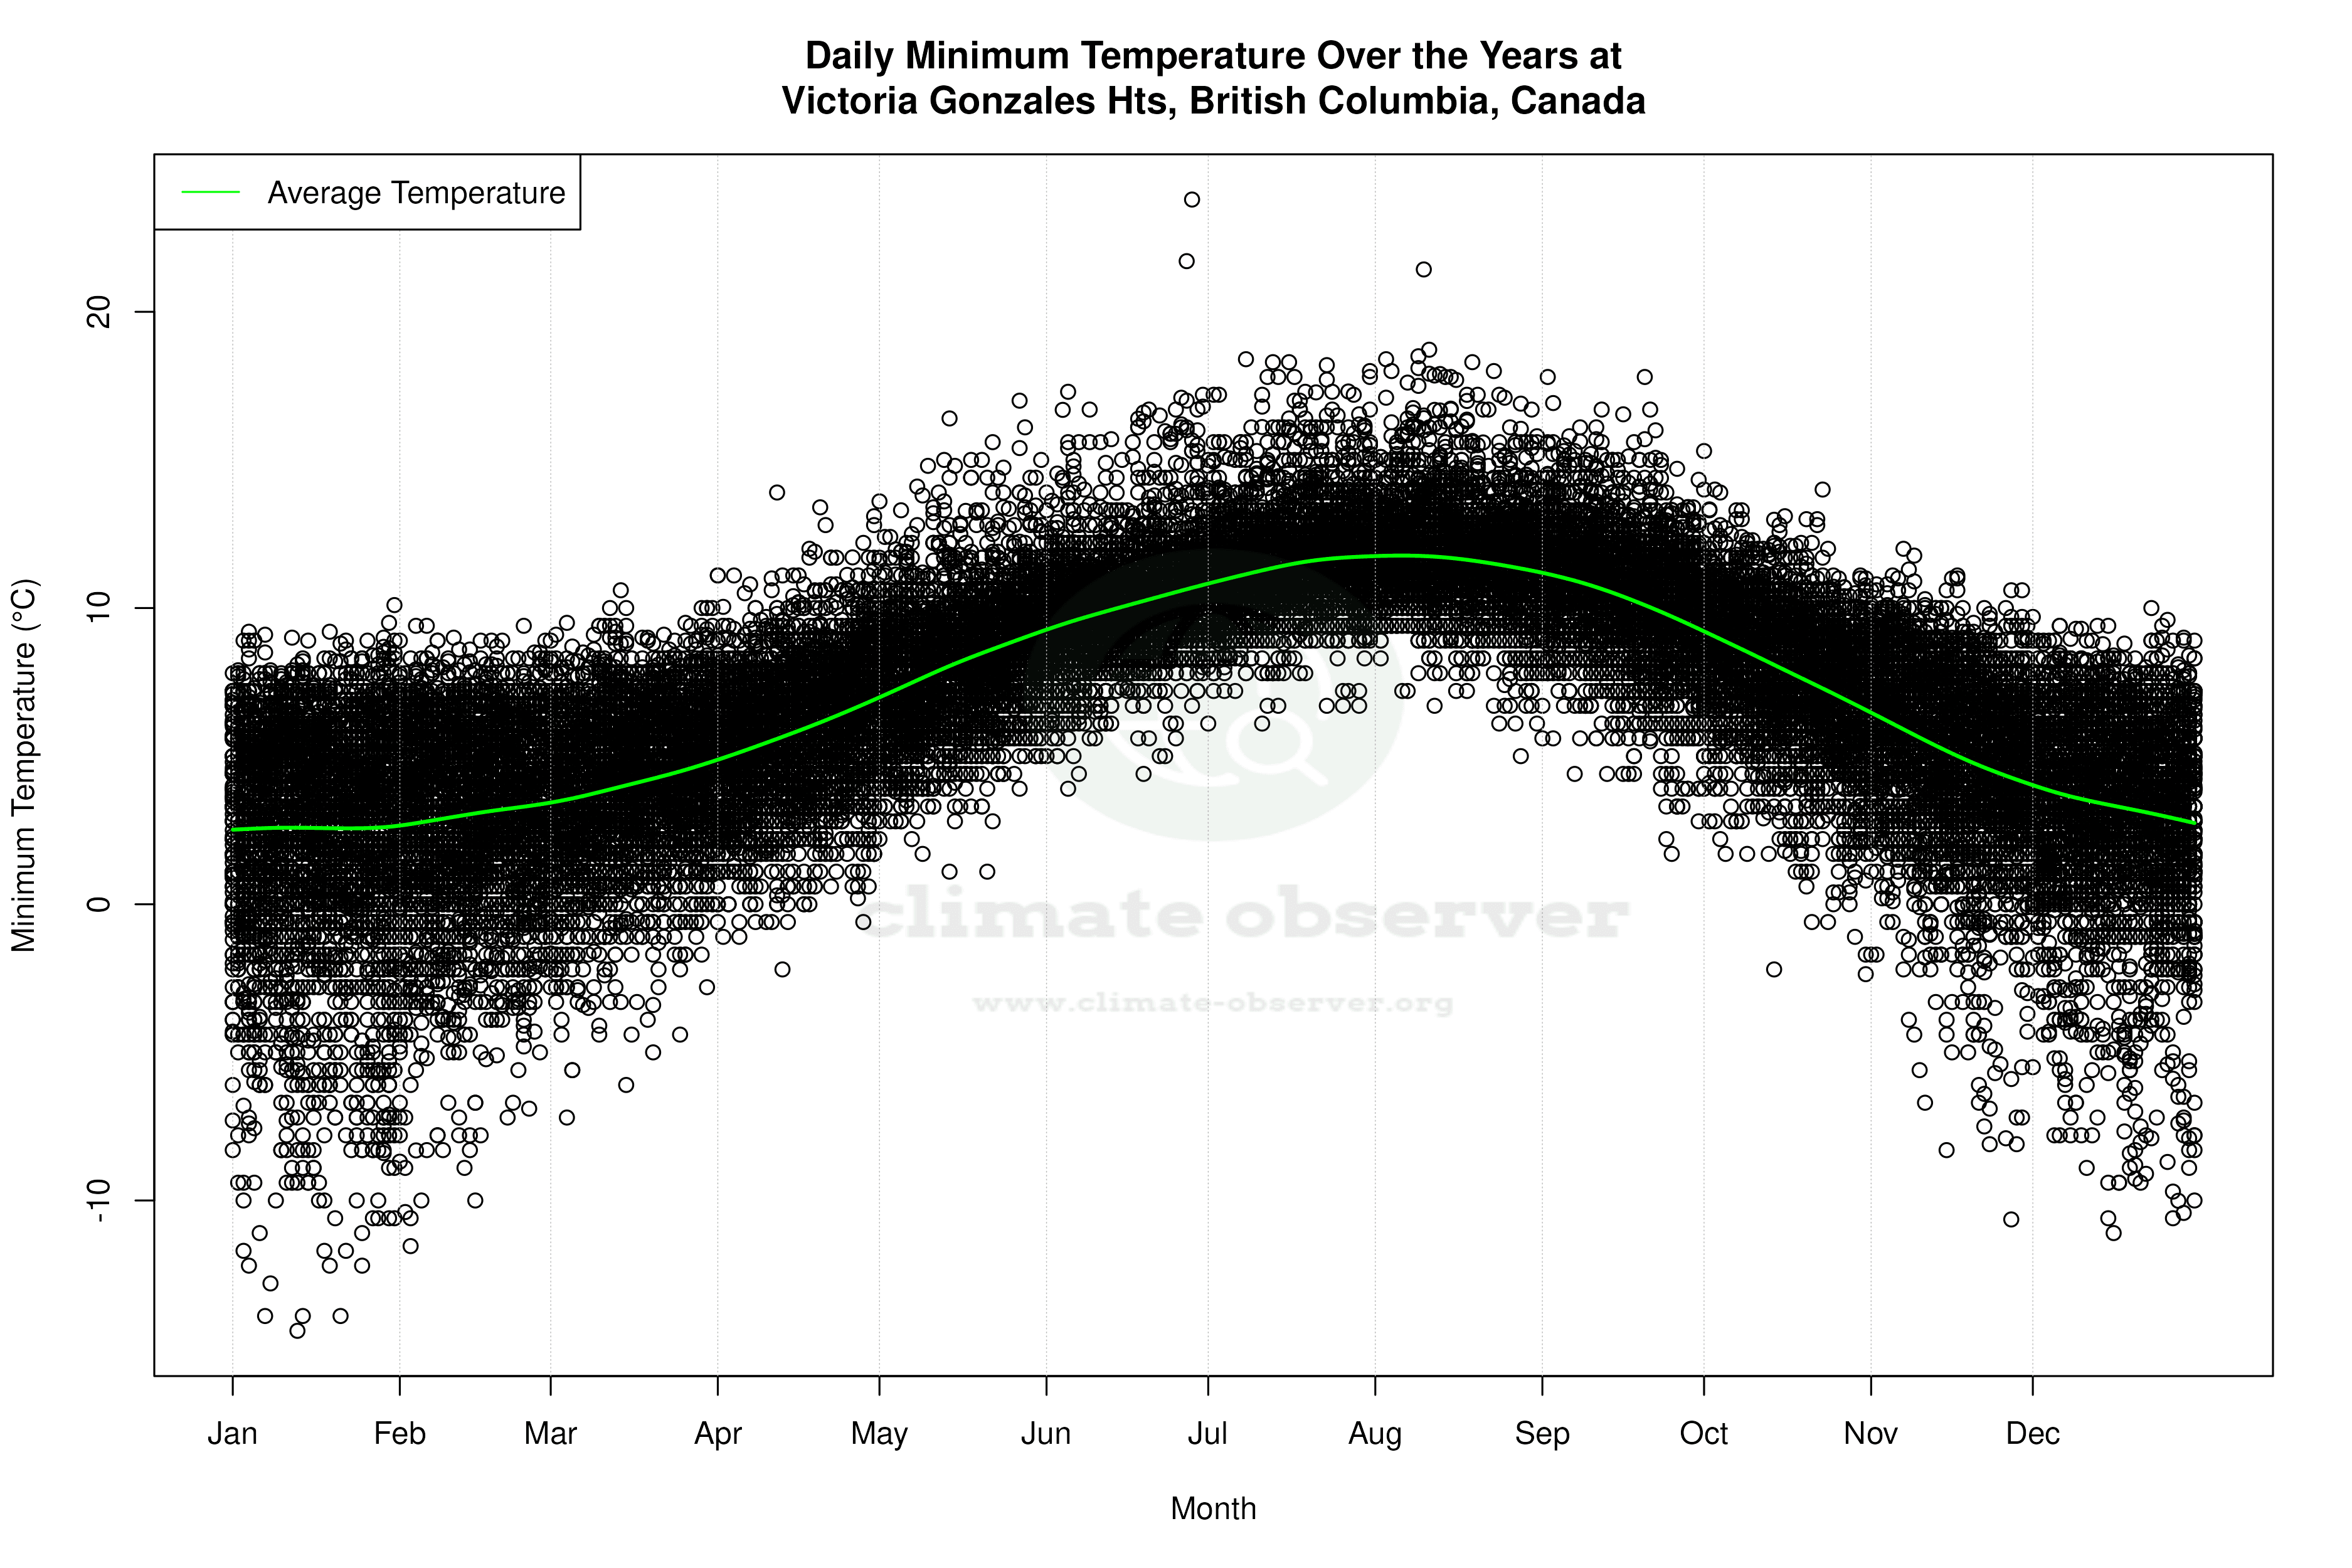
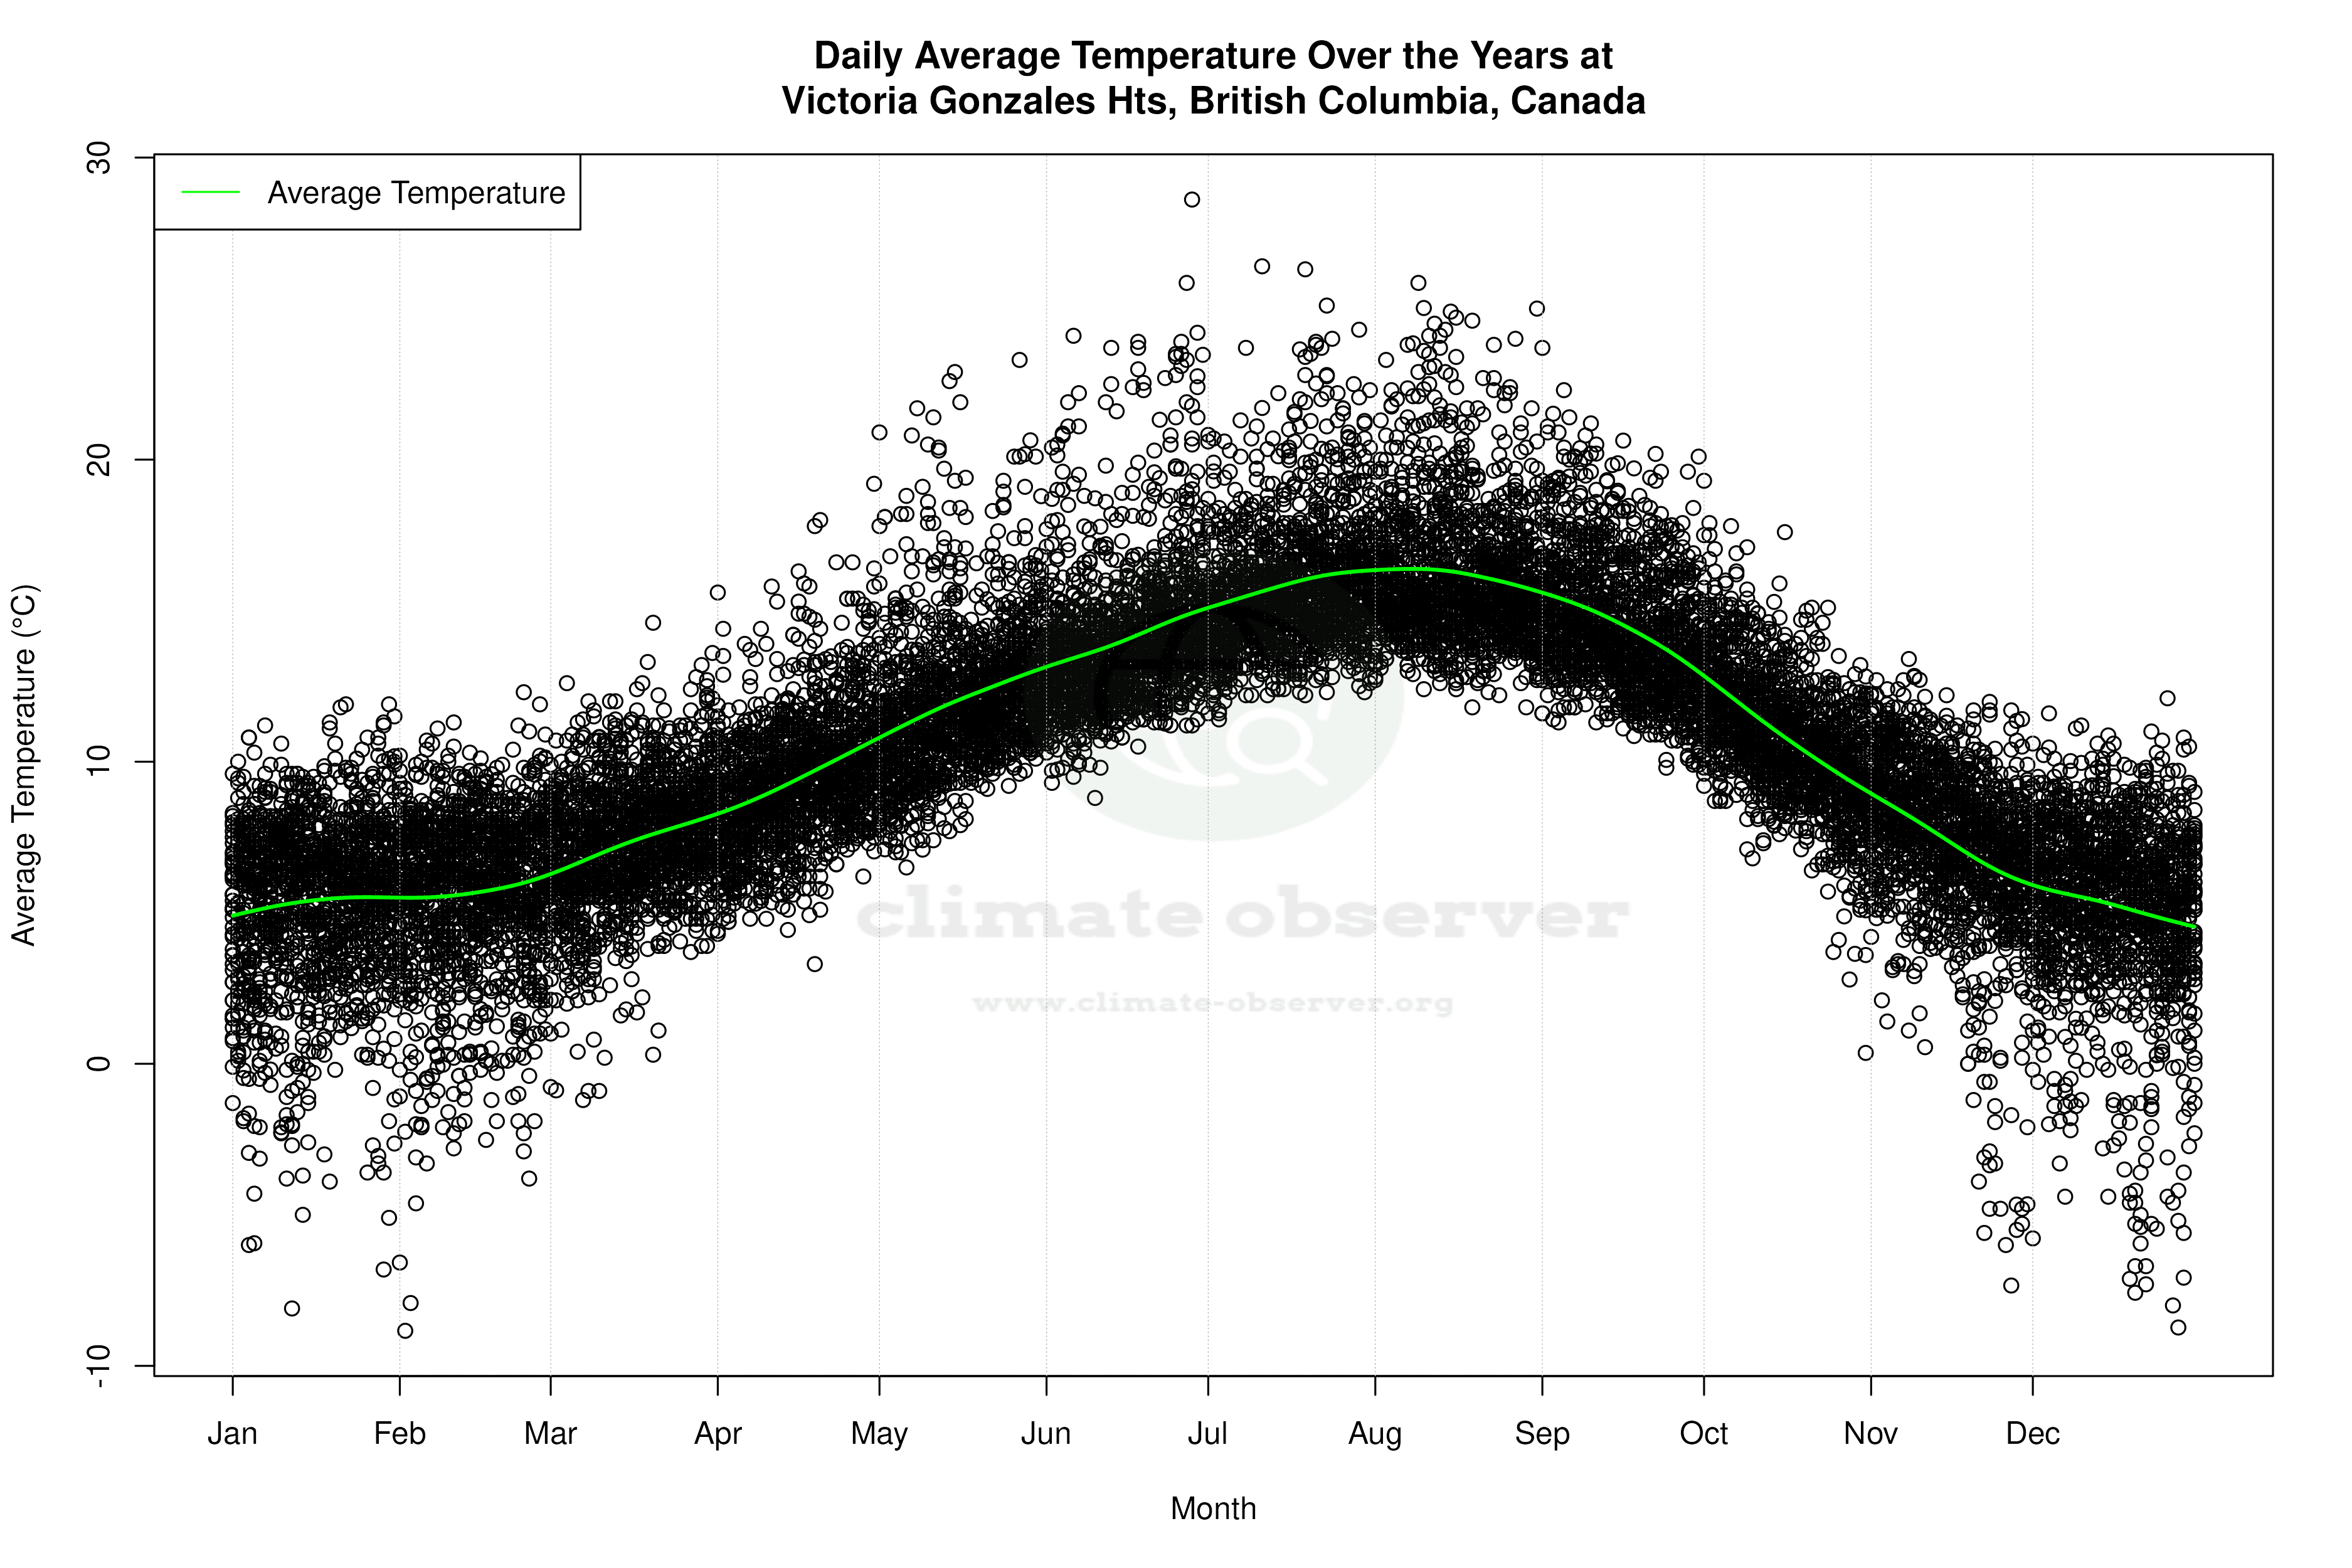


Average Max Temperature Throughout Year | 1 of 5
