Climate for Station: Atlin, British Columbia, Canada
Loading live weather...
Climate Analysis & Overview
Atlin, located in the Stikine Region of British Columbia, exhibits a complex climate narrative with contrasting temperature trends over different timescales. While the all-time data shows a slight warming, recent decades have seen a notable cooling trend. Precipitation patterns have become more evenly distributed, reflecting changes in climatic dynamics.
Geographical and Climatic Context
Atlin is situated at the northern edge of British Columbia, characterised by a subarctic climate (Dfc) under the Köppen classification. This region is influenced by its proximity to the Coast Mountains, which moderate temperatures and impact precipitation patterns. The presence of nearby bodies of water, such as Atlin Lake, also plays a role in local climate moderation, contributing to the unique weather patterns observed here.
Contrasting Temperature Trends
The all-time temperature trends for Atlin reveal a slight warming, with highs increasing by 0.12°C (0.22°F) and lows by 0.15°C (0.27°F). This gradual rise aligns with broader regional warming trends observed across Canada. However, the past decade has shown a stark contrast, with a cooling trend of -5.37°C (-9.67°F) for highs and -2.09°C (-3.76°F) for lows. This divergence indicates a complex interplay of local and global climatic factors affecting the region.
Record Extremes
Atlin has experienced significant temperature extremes, with a record high of 31.0°C (87.8°F) and a record low of -50.0°C (-58.0°F). These figures highlight the region's capacity for extreme weather conditions, a characteristic of its subarctic climate. Such extremes can have profound impacts on local ecosystems and human activities.
Precipitation Dynamics
The Precipitation Concentration Index (PCI) for Atlin has decreased from a baseline of 10.68 to a current value of 8.63. This change suggests that precipitation is now more evenly distributed throughout the year, reducing the likelihood of intense, concentrated rainfall events. Such a shift can influence water resource management and agricultural practices in the region.
Climatic Implications and Future Outlook
These climatic trends occur against the backdrop of Canada's regional climate goals, which aim to mitigate the impacts of climate change through adaptation and resilience strategies. The observed cooling trend over the past decade may be a temporary anomaly or part of a larger oscillation pattern. Meanwhile, the more even distribution of precipitation could offer some relief from the risks associated with concentrated rainfall events, such as flooding. Understanding these dynamics is crucial for developing effective climate adaptation strategies in Atlin and similar regions.
Station Statistics
10-Year Trend
High: -10.38 °F/decade
Low: -4.26 °F/decade
Rain: +0.068 in/decade
25-Year Trend
High: -1.68 °F/decade
Low: +0.33 °F/decade
Rain: +0.012 in/decade
50-Year Trend
High: -0.11 °F/decade
Low: +0.38 °F/decade
Rain: -0.004 in/decade
All-Time Trend
High: +0.20 °F/decade
Low: +0.26 °F/decade
Rain: +0.003 in/decade
Percentage Above-Average Days
Last 12 Months: 35.6%
This Year: 29.6%
Precipitation Concentration Index (PCI) ℹ️
Last 12 Months: 9.0
Historical Average: 11.0
Percentile Rank of Last 12 Months ℹ️
High: 1st percentile
Low: 13th percentile
Rain: 97th percentile
Change in Variance ℹ️
High: -8.2%
Low: -10.7%
Intraday: -26.5%
Data Coverage
85.7%
First Year of Data
1899
Station Location
Historical Weather Records
| Max High | Avg High | Min High | Max Avg | Avg Avg | Min Avg | Max Low | Avg Low | Min Low | Max Precipitation | Avg Precipitation | Max Snow | Avg Snow | |
|---|---|---|---|---|---|---|---|---|---|---|---|---|---|
| Record | 87.80 °F | — | -50.08 °F | 73.94 °F | — | -51.14 °F | 68.00 °F | — | -58.00 °F | 1.70 in | — | 15.00 in | — |
| January | 50.00 °F | 12.68 °F | -43.60 °F | 45.14 °F | 8.24 °F | -51.14 °F | 40.10 °F | -0.20 °F | -54.04 °F | 1.50 in | 0.05 in | 15.00 in | 0.42 in |
| February | 51.08 °F | 19.25 °F | -32.08 °F | 41.00 °F | 10.72 °F | -41.44 °F | 39.20 °F | 3.07 °F | -52.96 °F | 0.95 in | 0.04 in | 9.49 in | 0.29 in |
| March | 57.20 °F | 29.28 °F | -9.94 °F | 46.94 °F | 17.63 °F | -26.21 °F | 40.10 °F | 10.88 °F | -38.92 °F | 1.10 in | 0.03 in | 10.98 in | 0.20 in |
| April | 68.00 °F | 42.14 °F | 12.20 °F | 50.00 °F | 29.84 °F | -3.10 °F | 42.08 °F | 24.21 °F | -14.98 °F | 0.60 in | 0.02 in | 5.98 in | 0.08 in |
| May | 80.06 °F | 53.02 °F | 26.24 °F | 61.93 °F | 40.65 °F | 21.88 °F | 53.06 °F | 33.34 °F | 14.00 °F | 1.22 in | 0.03 in | 3.94 in | 0.01 in |
| June | 87.80 °F | 61.97 °F | 39.87 °F | 69.44 °F | 49.63 °F | 31.75 °F | 60.98 °F | 40.66 °F | 24.98 °F | 1.06 in | 0.04 in | 2.52 in | 0.00 in |
| July | 87.80 °F | 64.81 °F | 43.50 °F | 73.94 °F | 53.53 °F | 39.29 °F | 60.44 °F | 44.81 °F | 30.02 °F | 1.47 in | 0.05 in | 0.00 in | 0.00 in |
| August | 86.00 °F | 62.72 °F | 35.06 °F | 69.80 °F | 51.66 °F | 30.51 °F | 68.00 °F | 44.24 °F | 28.04 °F | 1.20 in | 0.05 in | 2.52 in | 0.00 in |
| September | 80.06 °F | 53.59 °F | 24.80 °F | 65.30 °F | 43.33 °F | 20.57 °F | 56.30 °F | 38.44 °F | 12.02 °F | 1.43 in | 0.06 in | 8.50 in | 0.02 in |
| October | 67.10 °F | 41.69 °F | 6.58 °F | 53.60 °F | 31.34 °F | -14.04 °F | 51.80 °F | 30.68 °F | -15.32 °F | 1.70 in | 0.07 in | 10.00 in | 0.15 in |
| November | 55.94 °F | 27.77 °F | -22.32 °F | 45.50 °F | 16.00 °F | -44.93 °F | 46.94 °F | 17.44 °F | -29.25 °F | 1.18 in | 0.05 in | 13.39 in | 0.33 in |
| December | 50.00 °F | 18.86 °F | -50.08 °F | 43.34 °F | 10.62 °F | -45.45 °F | 44.60 °F | 7.99 °F | -58.00 °F | 1.25 in | 0.05 in | 12.52 in | 0.36 in |
Data Visualisations
Remove WatermarksCurrent Year Climate Trends vs Historical

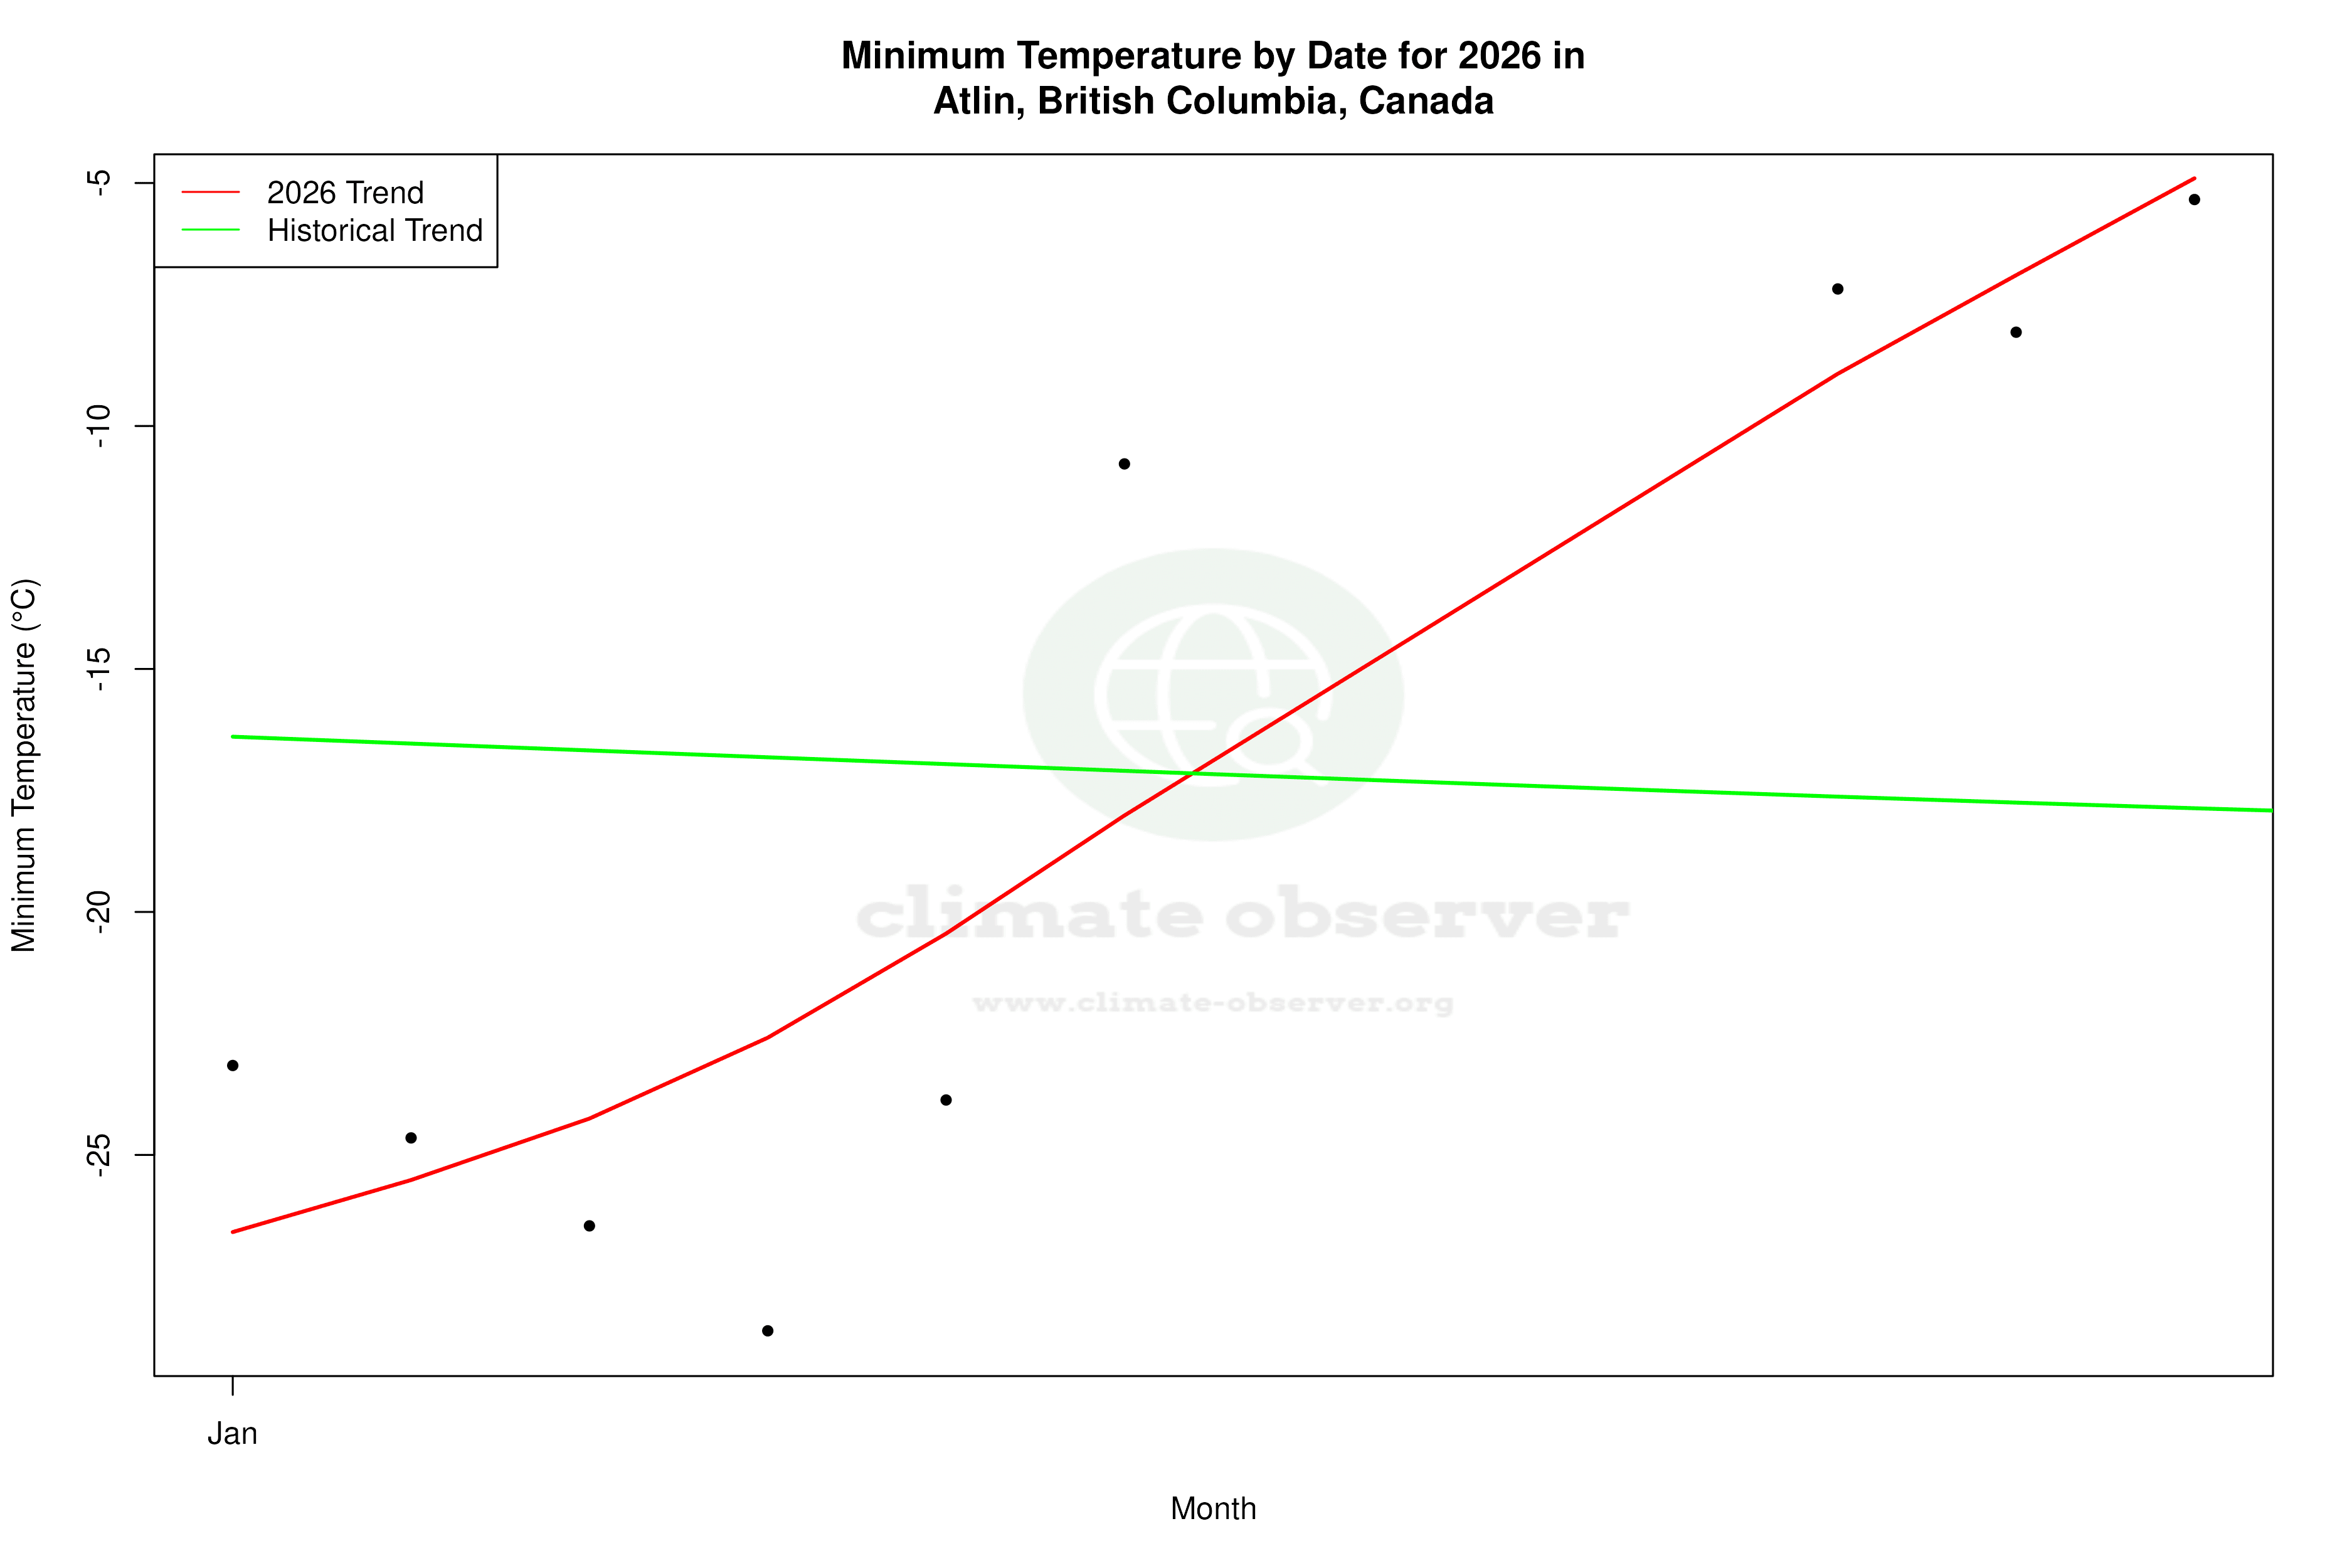


Max Temperature this Year | 1 of 6
Climate 12-Month Moving Averages


Max Temperature 12-Month MA | 1 of 6
Daily Data Points and Averages Throughout the Year


Average Max Temperature Throughout Year | 1 of 5
