Climate for Station: Baker Lake a, Nunavut, Canada
Loading live weather...
Climate Analysis & Overview
Baker Lake, located in the Kivalliq Region of Nunavut, is experiencing a warming trend, with recent decades showing a more pronounced increase in temperatures. Despite a slight decrease in precipitation concentration, the region continues to face significant climatic changes.
Arctic Warming Patterns
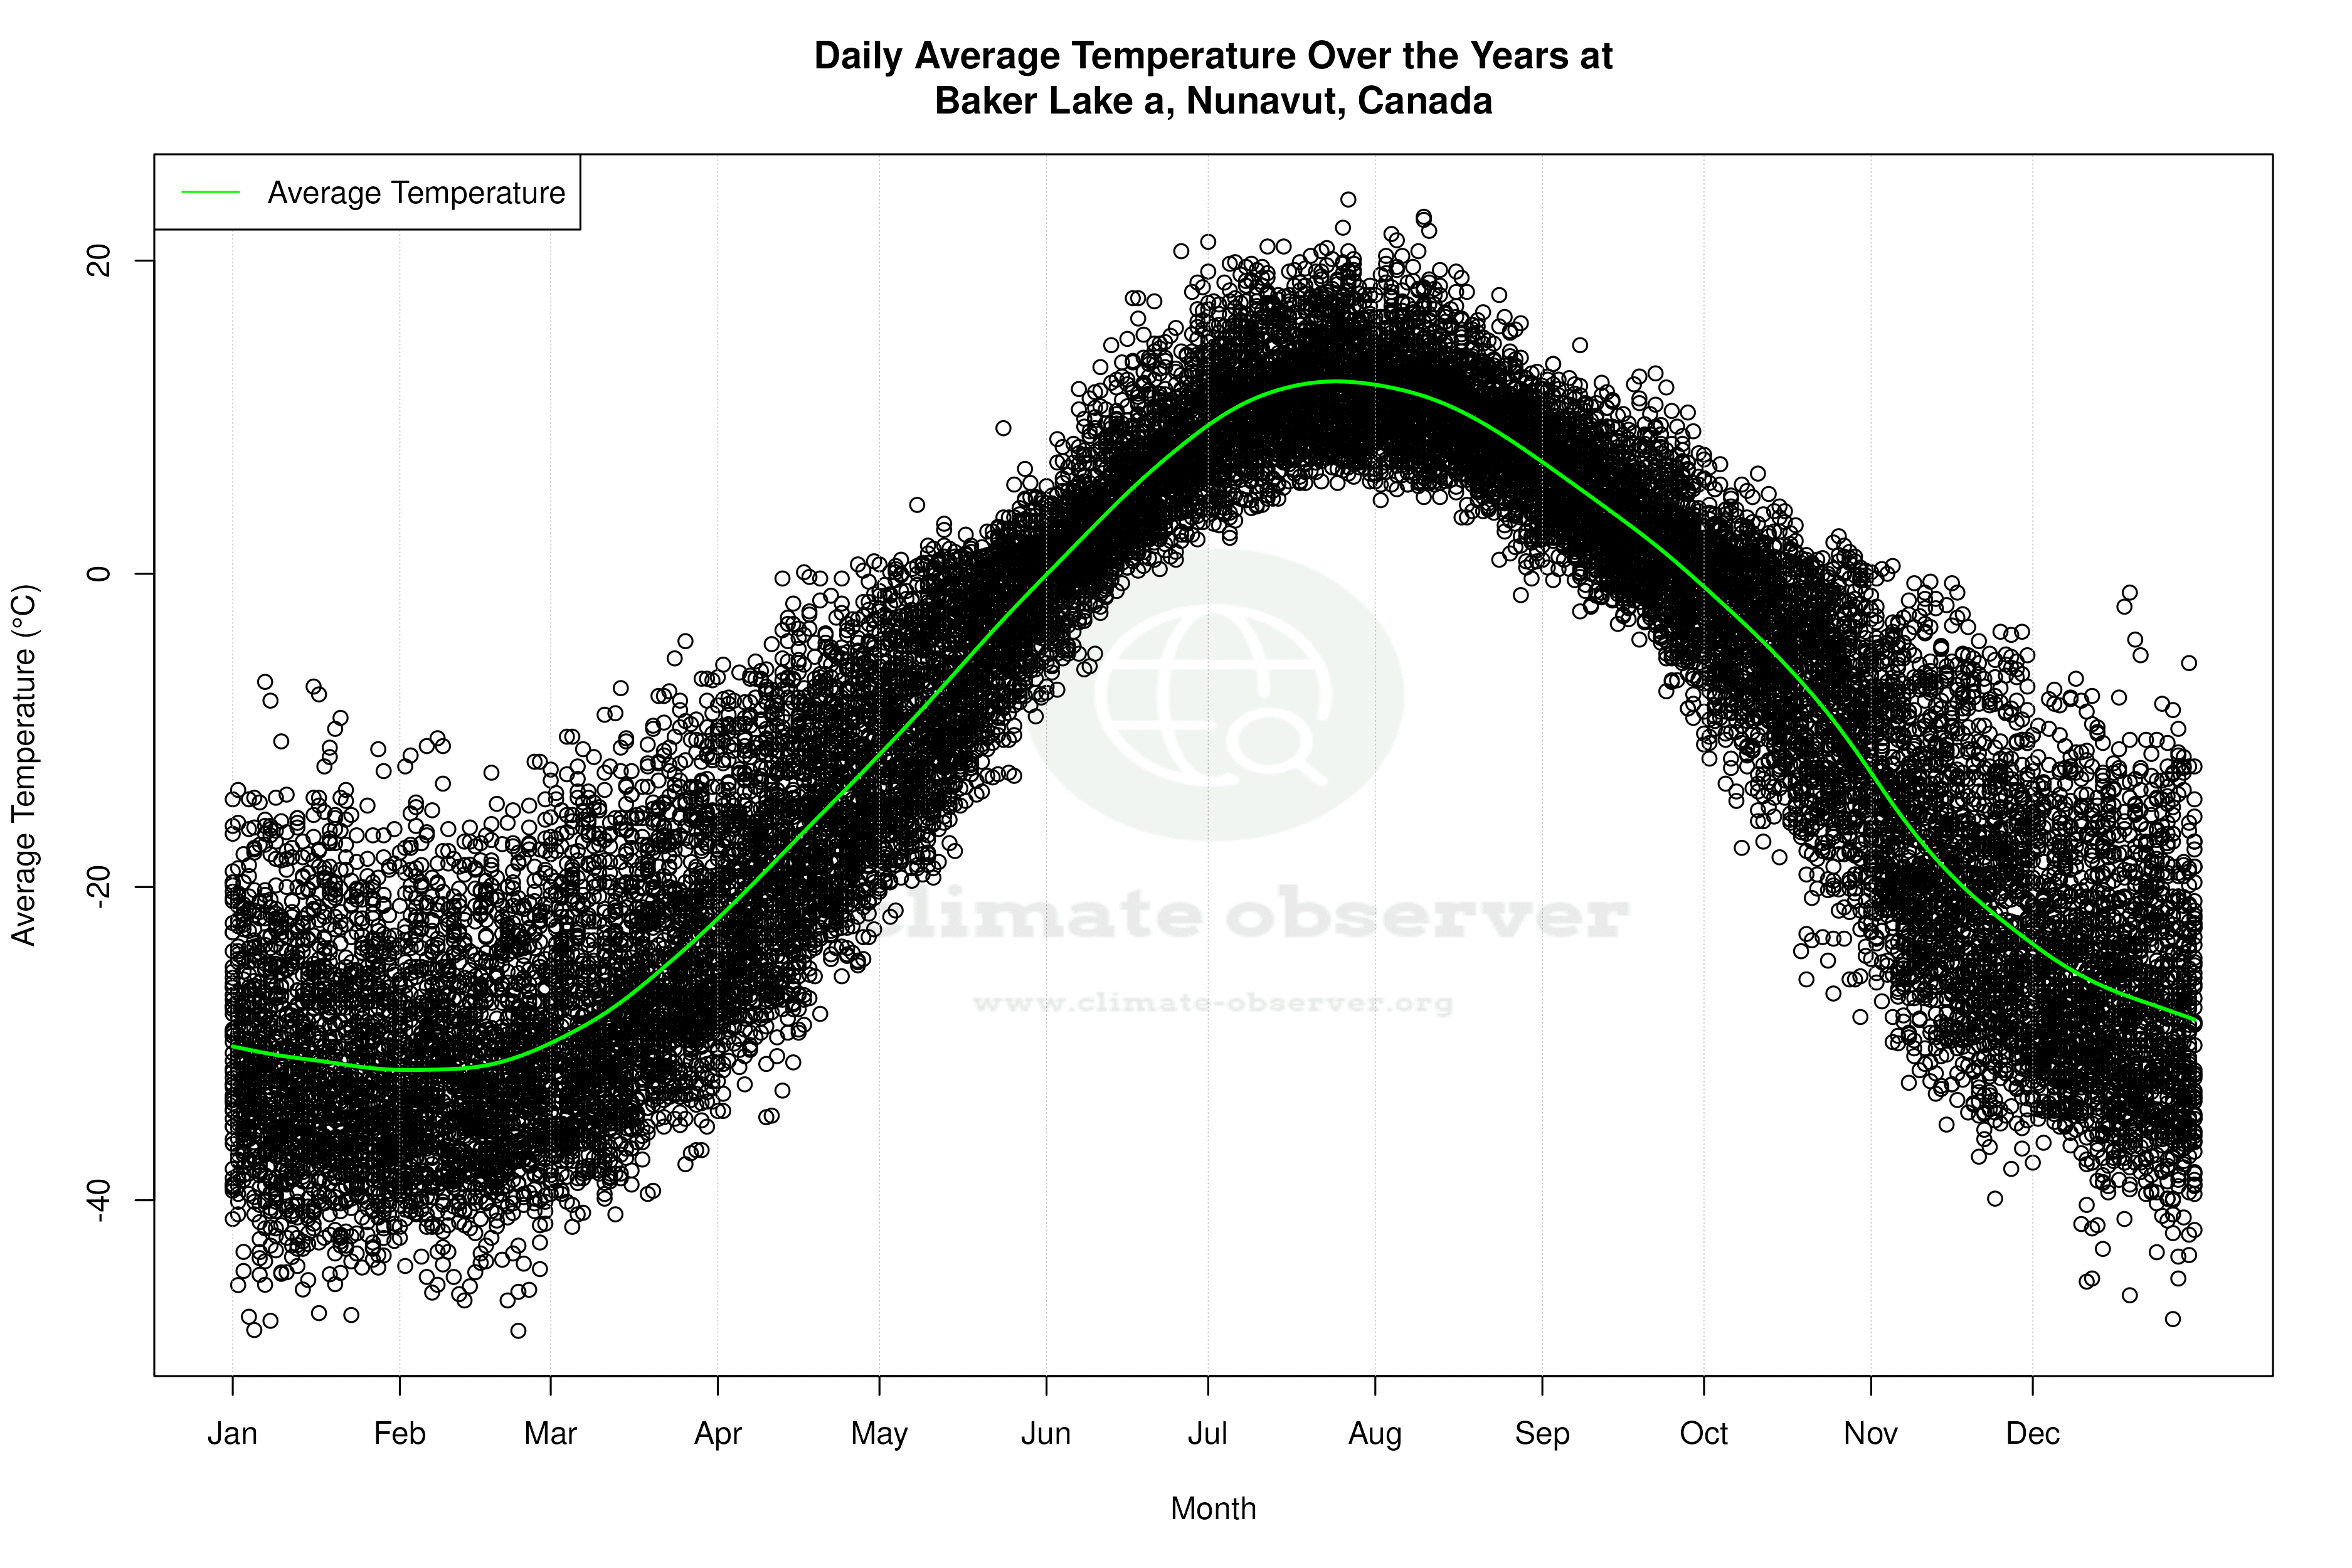
Baker Lake, situated at 64.3°N, -96.0833°W, is classified under the Köppen climate system as a tundra climate, characterized by long, harsh winters and short, cool summers. The local geography, with its expansive tundra and proximity to Hudson Bay, influences its climatic conditions. Over the past decade, Baker Lake has seen a notable warming trend, with average highs increasing by 2.47°C (4.45°F) and lows by 2.59°C (4.65°F). This is a significant rise compared to the all-time trend, where highs have risen by 0.47°C (0.85°F) and lows by 0.37°C (0.67°F). The accelerated warming in recent years highlights the region's vulnerability to climate change.
Temperature Extremes
Baker Lake's temperature records reflect the extremes of its climate. The highest recorded temperature is 33.6°C (92.5°F), while the lowest plummets to -51.52°C (-60.7°F). These extremes underscore the region's challenging weather conditions, where residents and ecosystems must adapt to significant temperature fluctuations.
Precipitation Dynamics
The Precipitation Concentration Index (PCI) for Baker Lake indicates a slight shift towards more evenly distributed precipitation events. The baseline PCI of 13.38 has decreased to 12.22, suggesting precipitation is becoming less concentrated in fewer events. This marginal change could imply a more consistent distribution of precipitation throughout the year, potentially affecting local hydrology and ecosystems.
Regional Climate Context
Baker Lake's climate trends are part of broader regional patterns observed across northern Canada, where warming is occurring at twice the global average. This aligns with Canada's climate goals, which aim to mitigate the impacts of climate change through emission reductions and adaptation strategies. Recent weather events, such as unusually warm Arctic summers, have further emphasised the need for robust climate action in these vulnerable regions.
Implications for the Future
The ongoing warming trend in Baker Lake raises concerns about the long-term impacts on local ecosystems and communities. As temperatures continue to rise, permafrost thawing and changes in wildlife habitats are anticipated, necessitating adaptive measures to sustain the region's ecological and cultural heritage. The slight decrease in PCI suggests potential shifts in precipitation patterns, which could influence water availability and ecosystem dynamics.
Station Statistics
10-Year Trend
High: +3.84 °F/decade
Low: +4.67 °F/decade
Rain: +0.013 in/decade
25-Year Trend
High: +1.90 °F/decade
Low: +1.49 °F/decade
Rain: -0.001 in/decade
50-Year Trend
High: +1.32 °F/decade
Low: +1.15 °F/decade
Rain: -0.002 in/decade
All-Time Trend
High: +0.84 °F/decade
Low: +0.67 °F/decade
Rain: +0.000 in/decade
Percentage Above-Average Days
Last 12 Months: 58.1%
This Year: 50.0%
Precipitation Concentration Index (PCI) ℹ️
Last 12 Months: 11.6
Historical Average: 14.8
Percentile Rank of Last 12 Months ℹ️
High: 95th percentile
Low: 96th percentile
Rain: 84th percentile
Change in Variance ℹ️
High: +1.0%
Low: -4.1%
Intraday: +3.8%
Data Coverage
91.5%
First Year of Data
1946
Station Location
Historical Weather Records
| Max High | Avg High | Min High | Max Avg | Avg Avg | Min Avg | Max Low | Avg Low | Min Low | Max Precipitation | Avg Precipitation | Max Snow | Avg Snow | |
|---|---|---|---|---|---|---|---|---|---|---|---|---|---|
| Record | 92.48 °F | — | -50.08 °F | 75.02 °F | — | -55.01 °F | 60.08 °F | — | -60.74 °F | 2.05 in | — | 11.93 in | — |
| January | 28.94 °F | -18.34 °F | -50.08 °F | 19.58 °F | -23.81 °F | -54.92 °F | 18.14 °F | -31.08 °F | -60.74 °F | 0.39 in | 0.01 in | 4.02 in | 0.10 in |
| February | 27.32 °F | -18.61 °F | -48.28 °F | 13.10 °F | -24.37 °F | -55.01 °F | 9.68 °F | -31.30 °F | -58.00 °F | 0.43 in | 0.01 in | 3.90 in | 0.10 in |
| March | 34.70 °F | -8.46 °F | -41.08 °F | 24.26 °F | -15.91 °F | -43.06 °F | 17.06 °F | -23.68 °F | -58.00 °F | 0.44 in | 0.01 in | 4.25 in | 0.14 in |
| April | 41.36 °F | 9.69 °F | -27.94 °F | 33.44 °F | 1.48 °F | -30.46 °F | 30.92 °F | -7.41 °F | -41.98 °F | 0.73 in | 0.02 in | 8.11 in | 0.18 in |
| May | 79.16 °F | 27.86 °F | -0.04 °F | 50.54 °F | 21.49 °F | -7.42 °F | 46.04 °F | 14.58 °F | -18.04 °F | 0.99 in | 0.02 in | 4.57 in | 0.11 in |
| June | 87.62 °F | 48.06 °F | 22.82 °F | 69.08 °F | 40.58 °F | 18.32 °F | 54.32 °F | 32.86 °F | 9.68 °F | 0.79 in | 0.03 in | 4.96 in | 0.04 in |
| July | 92.48 °F | 62.24 °F | 39.92 °F | 75.02 °F | 52.89 °F | 36.14 °F | 60.08 °F | 43.10 °F | 28.94 °F | 2.05 in | 0.04 in | 0.12 in | 0.00 in |
| August | 87.62 °F | 58.24 °F | 34.88 °F | 73.04 °F | 50.40 °F | 29.55 °F | 58.46 °F | 42.04 °F | 25.16 °F | 1.79 in | 0.05 in | 4.65 in | 0.01 in |
| September | 77.18 °F | 43.61 °F | 19.04 °F | 58.28 °F | 38.25 °F | 15.44 °F | 51.08 °F | 31.88 °F | 6.08 °F | 1.71 in | 0.05 in | 7.01 in | 0.09 in |
| October | 56.48 °F | 25.84 °F | -21.10 °F | 45.68 °F | 21.49 °F | -18.94 °F | 41.00 °F | 14.51 °F | -28.66 °F | 1.26 in | 0.04 in | 11.02 in | 0.30 in |
| November | 35.96 °F | 4.40 °F | -32.17 °F | 32.90 °F | -1.91 °F | -39.82 °F | 31.10 °F | -9.41 °F | -44.86 °F | 1.19 in | 0.02 in | 11.93 in | 0.25 in |
| December | 33.98 °F | -10.15 °F | -45.94 °F | 29.84 °F | -15.69 °F | -53.66 °F | 24.80 °F | -23.23 °F | -50.08 °F | 0.55 in | 0.01 in | 4.57 in | 0.14 in |
Data Visualisations
Remove WatermarksCurrent Year Climate Trends vs Historical


Max Temperature this Year | 1 of 6
Climate 12-Month Moving Averages


Max Temperature 12-Month MA | 1 of 6
Daily Data Points and Averages Throughout the Year


Average Max Temperature Throughout Year | 1 of 5
