Climate for Station: Cambridge Bay a, Nunavut, Canada
Loading live weather...
Climate Analysis & Overview
Cambridge Bay is experiencing a noticeable warming trend, particularly in its low temperatures, with a 3.44°C (6.19°F) rise over the last decade. This warming is set against a backdrop of more evenly distributed precipitation, as indicated by a decrease in the Precipitation Concentration Index.
Arctic Warming: A Decade of Change
Cambridge Bay, positioned in the Kitikmeot Region of Nunavut, Canada, is characterised by its Tundra climate (ET) under the Köppen classification. This remote location, near the Arctic Ocean, has seen significant changes in temperature over the past decade. Recent data indicates a notable warming trend, with low temperatures increasing by 3.44°C (6.19°F) and highs by 1.86°C (3.35°F). This suggests a greater impact on minimum temperatures, a common trend in polar regions where winter warming is often more pronounced.
Long-term Trends: A Subtle Rise
When examining the all-time data, a more modest warming is observed. High temperatures have risen by 0.41°C (0.74°F), while lows have increased by 0.38°C (0.68°F). This long-term trend indicates a gradual warming, reflecting broader global patterns of climate change. Despite these increases, Cambridge Bay still experiences extreme temperatures, with record highs reaching 28.9°C (84.0°F) and lows plunging to -52.8°C (-63.0°F).
Precipitation Patterns: A Shift Towards Even Distribution
The Precipitation Concentration Index (PCI) for Cambridge Bay has seen a slight decrease from a baseline of 12.4 to 11.4. This suggests that precipitation is becoming more evenly distributed throughout the year, rather than being concentrated in fewer, intense events. For the local community, this could mean a more predictable water supply, crucial for both ecological stability and human activities.
Regional Context: Aligning with Canada's Climate Goals
These climatic changes in Cambridge Bay align with Canada's broader climate goals, which aim to mitigate the impacts of global warming and adapt to its effects. The warming trends observed here reflect the national and international efforts to monitor and address climate change, particularly in vulnerable Arctic regions. Recent weather events, such as unseasonably warm winters, underscore the importance of ongoing research and adaptation strategies in these areas.
Geographical Influences: The Role of the Arctic Ocean
The proximity of Cambridge Bay to the Arctic Ocean plays a significant role in its climate patterns. The ocean acts as a thermal buffer, moderating temperature extremes but also contributing to the observed warming trends. As sea ice continues to retreat, the ocean's influence is likely to become even more pronounced, affecting both local weather patterns and the broader Arctic climate system.
Station Statistics
10-Year Trend
High: +3.11 °F/decade
Low: +6.79 °F/decade
Rain: +0.004 in/decade
25-Year Trend
High: +2.27 °F/decade
Low: +1.86 °F/decade
Rain: +0.003 in/decade
50-Year Trend
High: +1.36 °F/decade
Low: +1.25 °F/decade
Rain: +0.001 in/decade
All-Time Trend
High: +0.75 °F/decade
Low: +0.69 °F/decade
Rain: +0.000 in/decade
Percentage Above-Average Days
Last 12 Months: 57.0%
This Year: 49.7%
Precipitation Concentration Index (PCI) ℹ️
Last 12 Months: 11.2
Historical Average: 15.3
Percentile Rank of Last 12 Months ℹ️
High: 97th percentile
Low: 99th percentile
Rain: 95th percentile
Change in Variance ℹ️
High: -6.2%
Low: -6.2%
Intraday: -2.3%
Data Coverage
82.8%
First Year of Data
1929
Station Location
Historical Weather Records
| Max High | Avg High | Min High | Max Avg | Avg Avg | Min Avg | Max Low | Avg Low | Min Low | Max Precipitation | Avg Precipitation | Max Snow | Avg Snow | |
|---|---|---|---|---|---|---|---|---|---|---|---|---|---|
| Record | 84.02 °F | — | -52.96 °F | 66.38 °F | — | -54.76 °F | 59.00 °F | — | -63.04 °F | 1.32 in | — | 8.19 in | — |
| January | 46.04 °F | -19.37 °F | -52.96 °F | 13.28 °F | -24.68 °F | -50.62 °F | 5.18 °F | -32.32 °F | -63.04 °F | 0.47 in | 0.01 in | 4.69 in | 0.08 in |
| February | 15.08 °F | -20.86 °F | -52.06 °F | 8.24 °F | -26.51 °F | -54.76 °F | 2.48 °F | -34.06 °F | -59.08 °F | 0.22 in | 0.01 in | 4.57 in | 0.07 in |
| March | 24.80 °F | -14.07 °F | -44.14 °F | 17.24 °F | -20.51 °F | -50.08 °F | 12.02 °F | -28.57 °F | -54.94 °F | 0.40 in | 0.01 in | 4.02 in | 0.08 in |
| April | 42.98 °F | 2.46 °F | -29.92 °F | 27.86 °F | -5.01 °F | -37.12 °F | 24.98 °F | -14.27 °F | -45.04 °F | 0.50 in | 0.01 in | 5.00 in | 0.09 in |
| May | 52.70 °F | 22.61 °F | -2.92 °F | 40.64 °F | 16.64 °F | -10.66 °F | 37.04 °F | 8.97 °F | -31.00 °F | 0.82 in | 0.01 in | 6.18 in | 0.11 in |
| June | 73.94 °F | 41.74 °F | 15.08 °F | 64.04 °F | 36.50 °F | 13.10 °F | 53.06 °F | 30.73 °F | 5.90 °F | 1.19 in | 0.02 in | 7.01 in | 0.06 in |
| July | 84.02 °F | 54.88 °F | 36.86 °F | 66.38 °F | 47.62 °F | 34.88 °F | 59.00 °F | 40.38 °F | 21.02 °F | 1.32 in | 0.03 in | 1.02 in | 0.00 in |
| August | 78.98 °F | 50.21 °F | 30.02 °F | 62.42 °F | 44.56 °F | 28.94 °F | 57.02 °F | 38.85 °F | 15.98 °F | 1.25 in | 0.03 in | 6.22 in | 0.01 in |
| September | 61.52 °F | 36.27 °F | 10.94 °F | 48.92 °F | 33.05 °F | 9.32 °F | 46.94 °F | 28.29 °F | 1.04 °F | 1.10 in | 0.03 in | 4.02 in | 0.10 in |
| October | 44.42 °F | 19.06 °F | -19.48 °F | 38.84 °F | 14.74 °F | -24.34 °F | 37.22 °F | 7.50 °F | -28.12 °F | 0.82 in | 0.02 in | 8.19 in | 0.20 in |
| November | 32.00 °F | -1.61 °F | -34.96 °F | 30.74 °F | -6.78 °F | -42.70 °F | 30.02 °F | -14.88 °F | -47.02 °F | 0.60 in | 0.01 in | 5.98 in | 0.13 in |
| December | 25.88 °F | -13.56 °F | -49.00 °F | 23.36 °F | -18.75 °F | -46.66 °F | 16.34 °F | -26.39 °F | -56.92 °F | 0.40 in | 0.01 in | 4.02 in | 0.08 in |
Data Visualisations
Remove WatermarksCurrent Year Climate Trends vs Historical


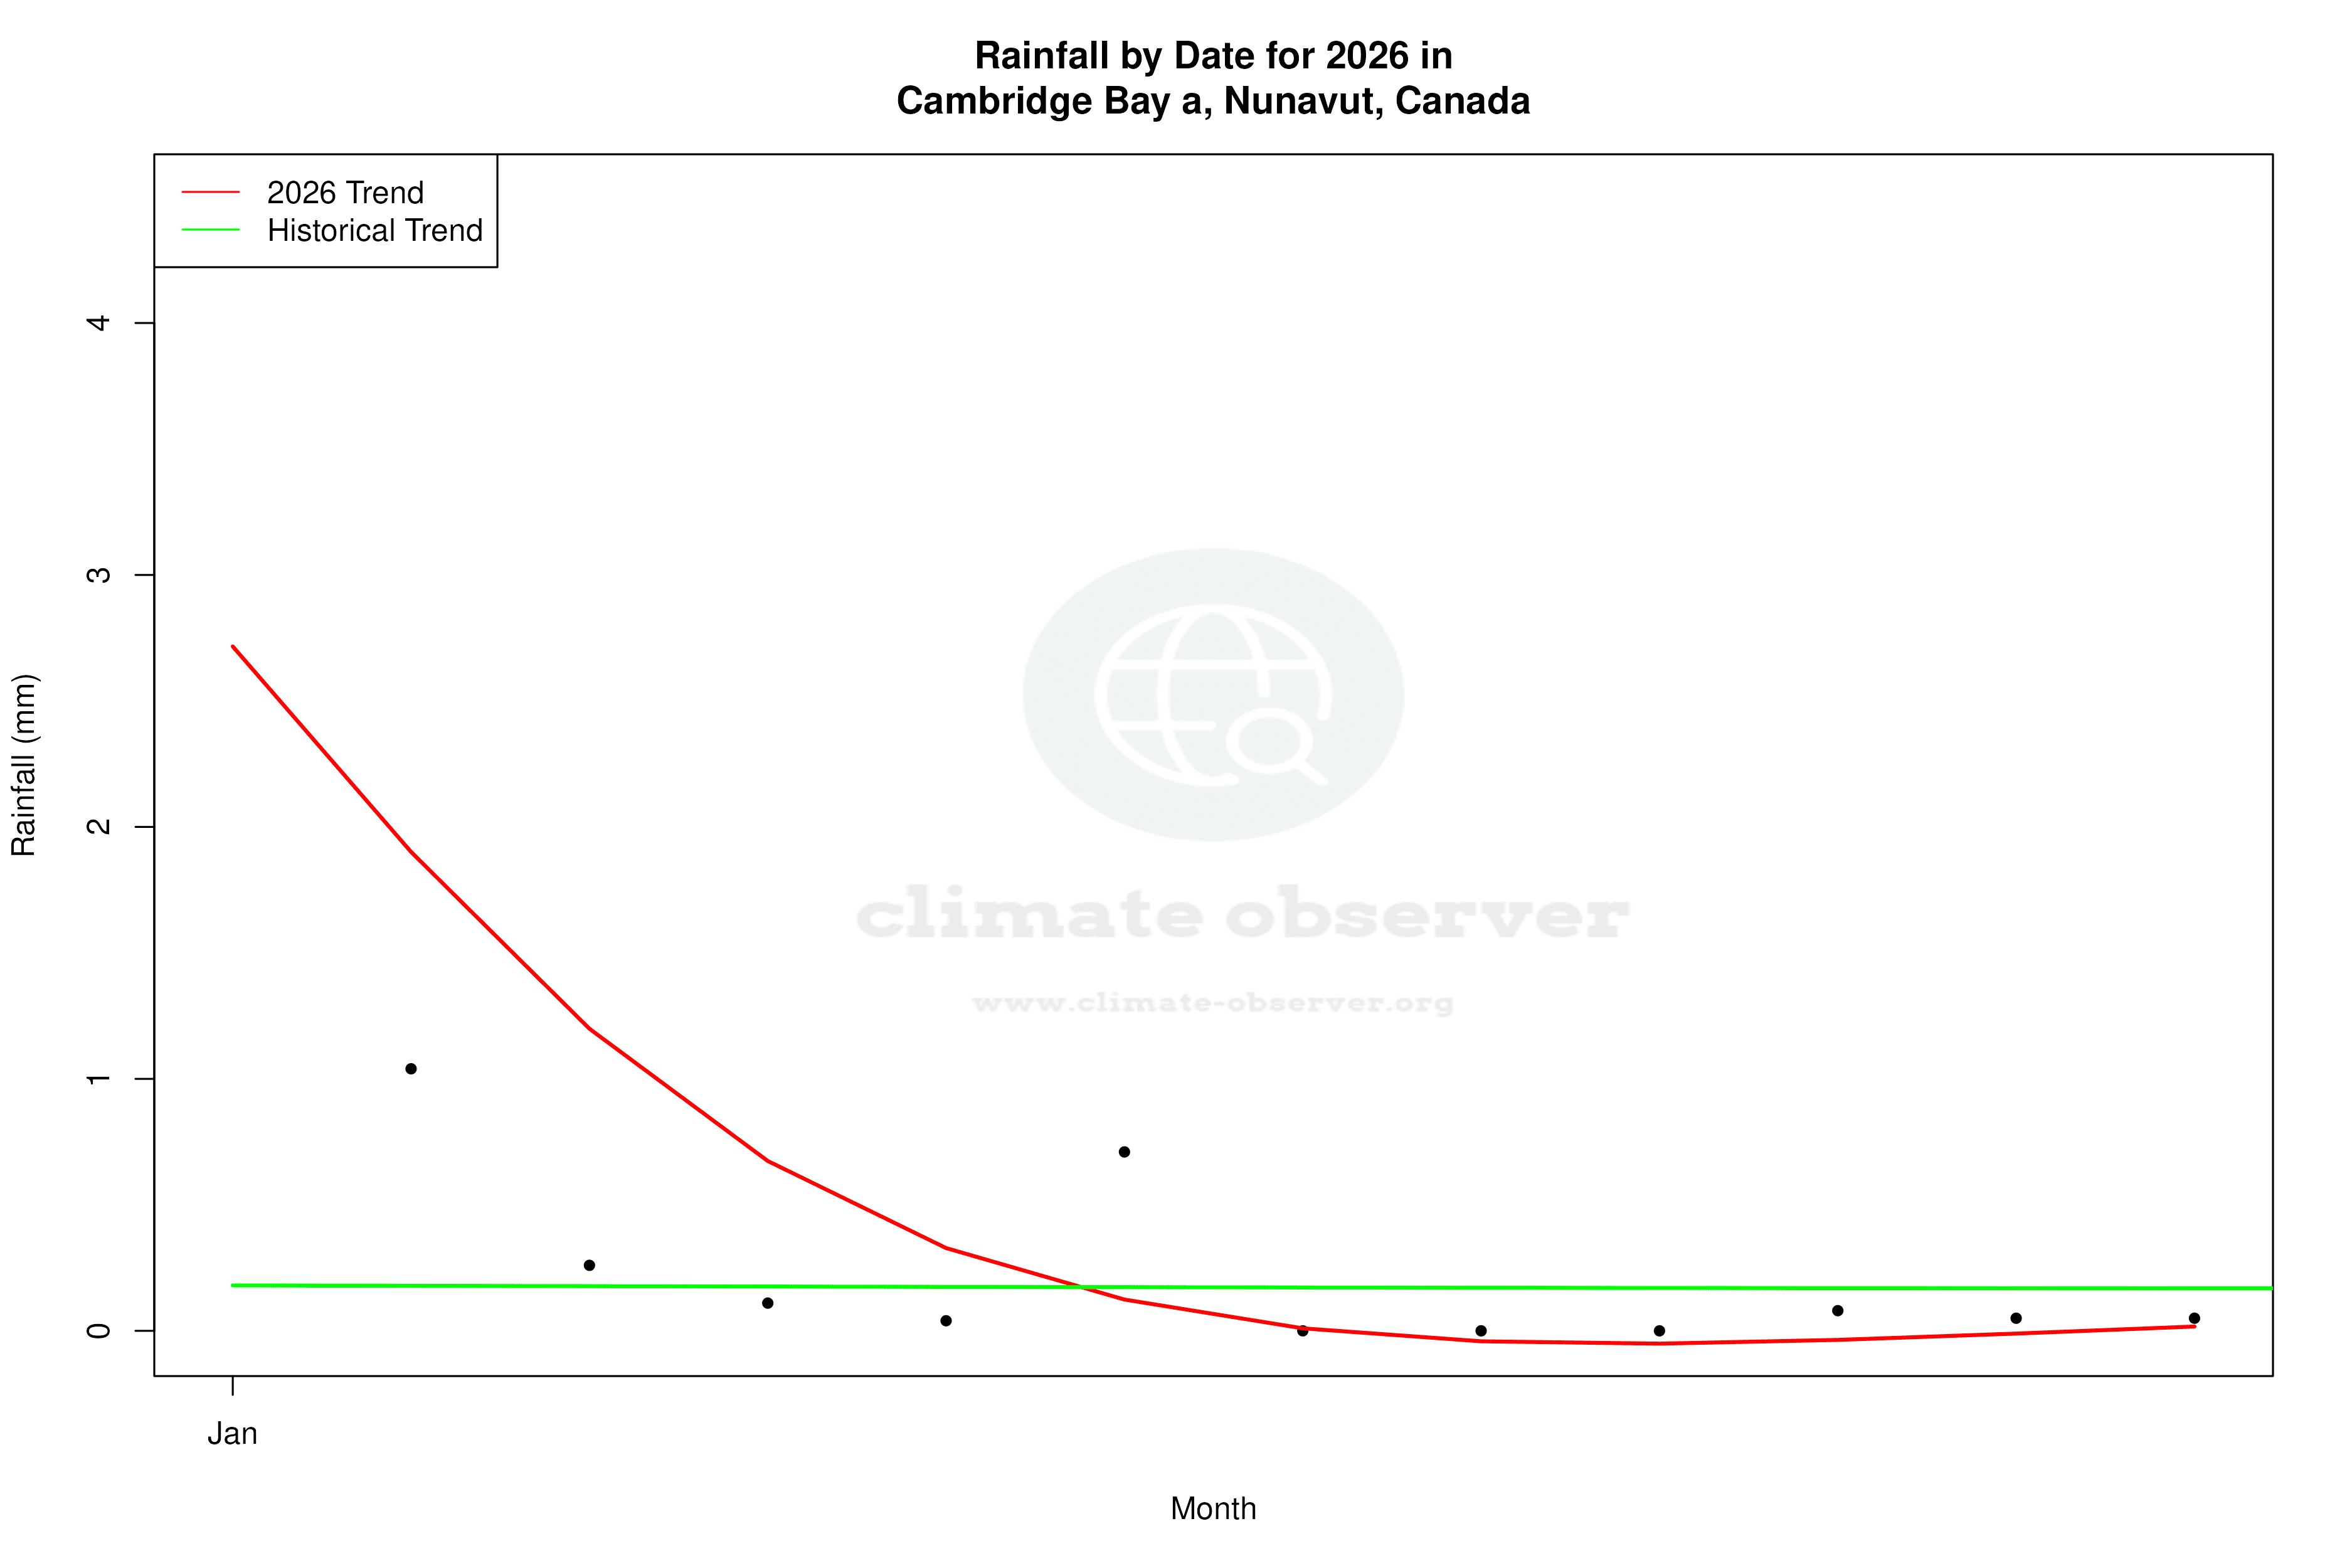


Max Temperature this Year | 1 of 6
Climate 12-Month Moving Averages


Max Temperature 12-Month MA | 1 of 6
Daily Data Points and Averages Throughout the Year


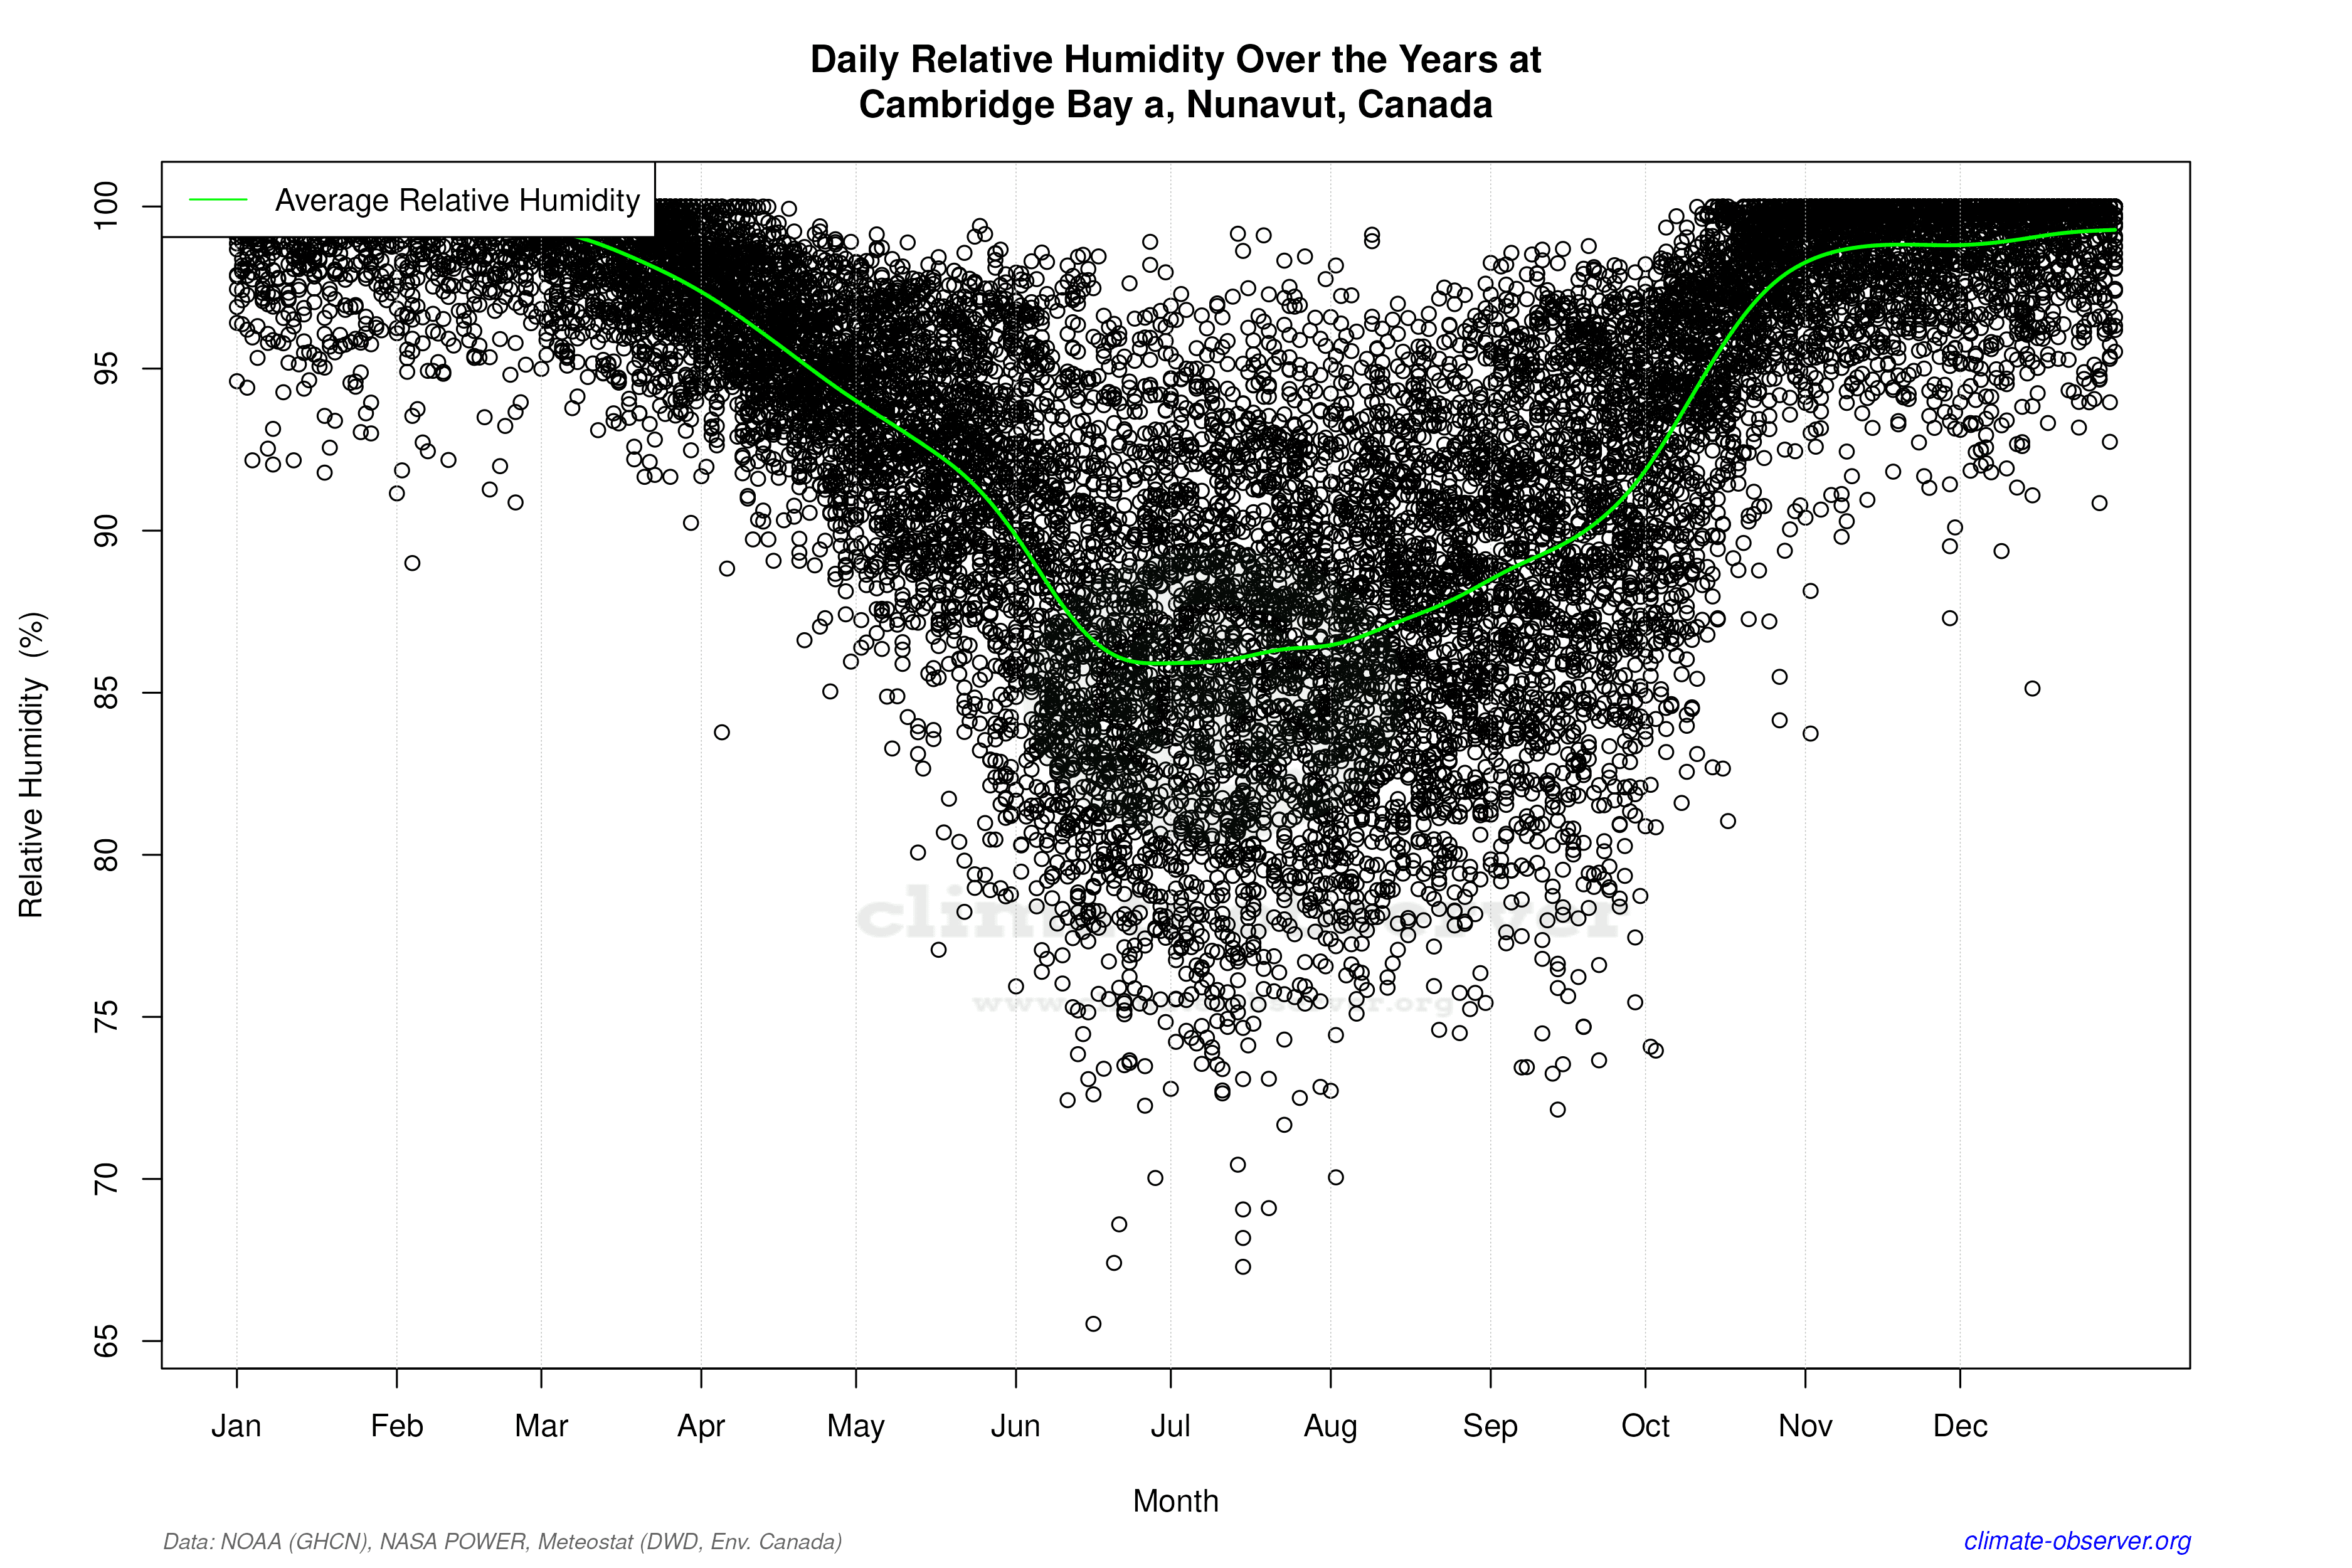

Average Max Temperature Throughout Year | 1 of 5
