Climate for Station: Resolute Cars, Nunavut, Canada
Loading live weather...
Climate Analysis & Overview
Resolute, located in the Qikiqtaaluk Region of Nunavut, Canada, exhibits a marked warming trend over the past decade, with significant increases in both high and low temperatures. Despite this, the all-time trends indicate a more gradual warming pattern. Precipitation is slightly more concentrated than in the past, suggesting changes in weather event distribution.
Arctic Climate Dynamics
Resolute is situated in a polar climate zone, classified under the Köppen climate classification as ET, which is characterised by long, extremely cold winters and short, cool summers. The geography of Resolute, surrounded by the icy waters of the Arctic Archipelago, heavily influences its climate. This location results in significant temperature fluctuations and a generally harsh environment. Over the past decade, the area has experienced a notable warming trend, with highs increasing by 1.54°C (2.77°F) and lows by 2.54°C (4.57°F). These changes are more pronounced than the all-time trends, which show a rise of 0.36°C (0.65°F) in highs and 0.43°C (0.77°F) in lows. This suggests a recent acceleration in warming, possibly linked to broader Arctic climate changes and Canada's regional climate goals to mitigate such impacts.
Temperature Extremes and Records
The temperature extremes in Resolute are stark, with historical records showing a maximum of 20.1°C (68.2°F) and a minimum of -52.2°C (-62.0°F). These records highlight the severe cold that can dominate the region, while the relatively moderate maximum temperature underscores the brief and mild nature of its summers. The all-time warming trends, though less dramatic than recent changes, still indicate a gradual shift towards warmer conditions over the years.
Precipitation Patterns and PCI
The Precipitation Concentration Index (PCI) for Resolute has seen a slight increase from a baseline of 12.49 to a current value of 12.68. The PCI is a measure of how precipitation is distributed over time; a higher value indicates that precipitation is becoming more concentrated in fewer, more intense events. This marginal change suggests that while the overall distribution of precipitation events has not drastically altered, there is a slight trend towards more concentrated rainfall or snowfall events. This could have implications for local ecosystems and infrastructure, especially in a region where resources are scarce.
Implications of Warming Trends
The warming trends observed in Resolute align with broader patterns seen across the Arctic, where temperatures are rising at more than twice the global average. These changes are likely to have profound impacts on the local environment, including permafrost thaw, sea ice melt, and shifts in wildlife patterns. The significant increase in low temperatures over the past decade is particularly noteworthy, as it may affect the stability of permafrost and the traditional ways of life for Indigenous communities. As Canada continues to address climate change, understanding these regional nuances is crucial for developing effective adaptation and mitigation strategies.
Station Statistics
10-Year Trend
High: +2.46 °F/decade
Low: +4.61 °F/decade
Rain: +0.001 in/decade
25-Year Trend
High: +1.70 °F/decade
Low: +1.11 °F/decade
Rain: -0.001 in/decade
50-Year Trend
High: +1.28 °F/decade
Low: +1.31 °F/decade
Rain: -0.000 in/decade
All-Time Trend
High: +0.65 °F/decade
Low: +0.78 °F/decade
Rain: +0.000 in/decade
Percentage Above-Average Days
Last 12 Months: 57.5%
This Year: 46.2%
Precipitation Concentration Index (PCI) ℹ️
Last 12 Months: 15.0
Historical Average: 16.6
Percentile Rank of Last 12 Months ℹ️
High: 94th percentile
Low: 97th percentile
Rain: 91st percentile
Change in Variance ℹ️
High: -12.4%
Low: -10.7%
Intraday: +6.8%
Data Coverage
96.1%
First Year of Data
1947
Station Location
Historical Weather Records
| Max High | Avg High | Min High | Max Avg | Avg Avg | Min Avg | Max Low | Avg Low | Min Low | Max Precipitation | Avg Precipitation | Max Snow | Avg Snow | |
|---|---|---|---|---|---|---|---|---|---|---|---|---|---|
| Record | 68.18 °F | — | -49.72 °F | 59.72 °F | — | -57.46 °F | 53.96 °F | — | -61.96 °F | 1.36 in | — | 10.63 in | — |
| January | 30.56 °F | -18.10 °F | -47.02 °F | 19.58 °F | -24.20 °F | -55.12 °F | 12.56 °F | -30.98 °F | -61.96 °F | 0.30 in | 0.01 in | 5.28 in | 0.05 in |
| February | 24.98 °F | -20.39 °F | -49.72 °F | 15.98 °F | -26.42 °F | -57.46 °F | 1.94 °F | -33.05 °F | -61.60 °F | 0.18 in | 0.00 in | 2.20 in | 0.05 in |
| March | 27.14 °F | -15.84 °F | -48.64 °F | 19.58 °F | -21.94 °F | -54.04 °F | 13.82 °F | -28.84 °F | -61.06 °F | 0.18 in | 0.01 in | 5.51 in | 0.07 in |
| April | 32.00 °F | -1.15 °F | -34.06 °F | 26.06 °F | -7.06 °F | -40.36 °F | 23.00 °F | -14.67 °F | -43.78 °F | 0.27 in | 0.01 in | 3.39 in | 0.08 in |
| May | 42.98 °F | 19.10 °F | -5.98 °F | 37.22 °F | 14.28 °F | -11.92 °F | 33.08 °F | 7.80 °F | -20.92 °F | 1.36 in | 0.01 in | 3.39 in | 0.12 in |
| June | 64.94 °F | 36.16 °F | 12.92 °F | 55.94 °F | 32.34 °F | 12.02 °F | 52.34 °F | 27.97 °F | 1.94 °F | 1.21 in | 0.02 in | 4.25 in | 0.09 in |
| July | 68.18 °F | 45.24 °F | 32.00 °F | 59.72 °F | 40.20 °F | 30.38 °F | 53.96 °F | 35.00 °F | 26.42 °F | 0.90 in | 0.03 in | 3.70 in | 0.05 in |
| August | 59.54 °F | 40.50 °F | 23.90 °F | 53.06 °F | 36.27 °F | 21.02 °F | 46.22 °F | 31.96 °F | 15.26 °F | 1.03 in | 0.04 in | 4.09 in | 0.10 in |
| September | 55.22 °F | 28.20 °F | 3.02 °F | 41.18 °F | 25.17 °F | -1.12 °F | 39.92 °F | 20.70 °F | -5.08 °F | 0.72 in | 0.03 in | 6.14 in | 0.22 in |
| October | 38.48 °F | 13.17 °F | -23.80 °F | 34.34 °F | 8.74 °F | -25.60 °F | 32.72 °F | 2.22 °F | -35.14 °F | 0.48 in | 0.02 in | 5.59 in | 0.21 in |
| November | 26.96 °F | -2.84 °F | -36.94 °F | 25.16 °F | -8.08 °F | -38.56 °F | 21.92 °F | -15.07 °F | -45.04 °F | 0.36 in | 0.01 in | 10.63 in | 0.11 in |
| December | 29.66 °F | -12.11 °F | -41.98 °F | 24.08 °F | -17.70 °F | -45.76 °F | 17.60 °F | -24.82 °F | -50.98 °F | 0.45 in | 0.01 in | 2.76 in | 0.07 in |
Data Visualisations
Remove WatermarksCurrent Year Climate Trends vs Historical


Max Temperature this Year | 1 of 6
Climate 12-Month Moving Averages


Max Temperature 12-Month MA | 1 of 6
Daily Data Points and Averages Throughout the Year


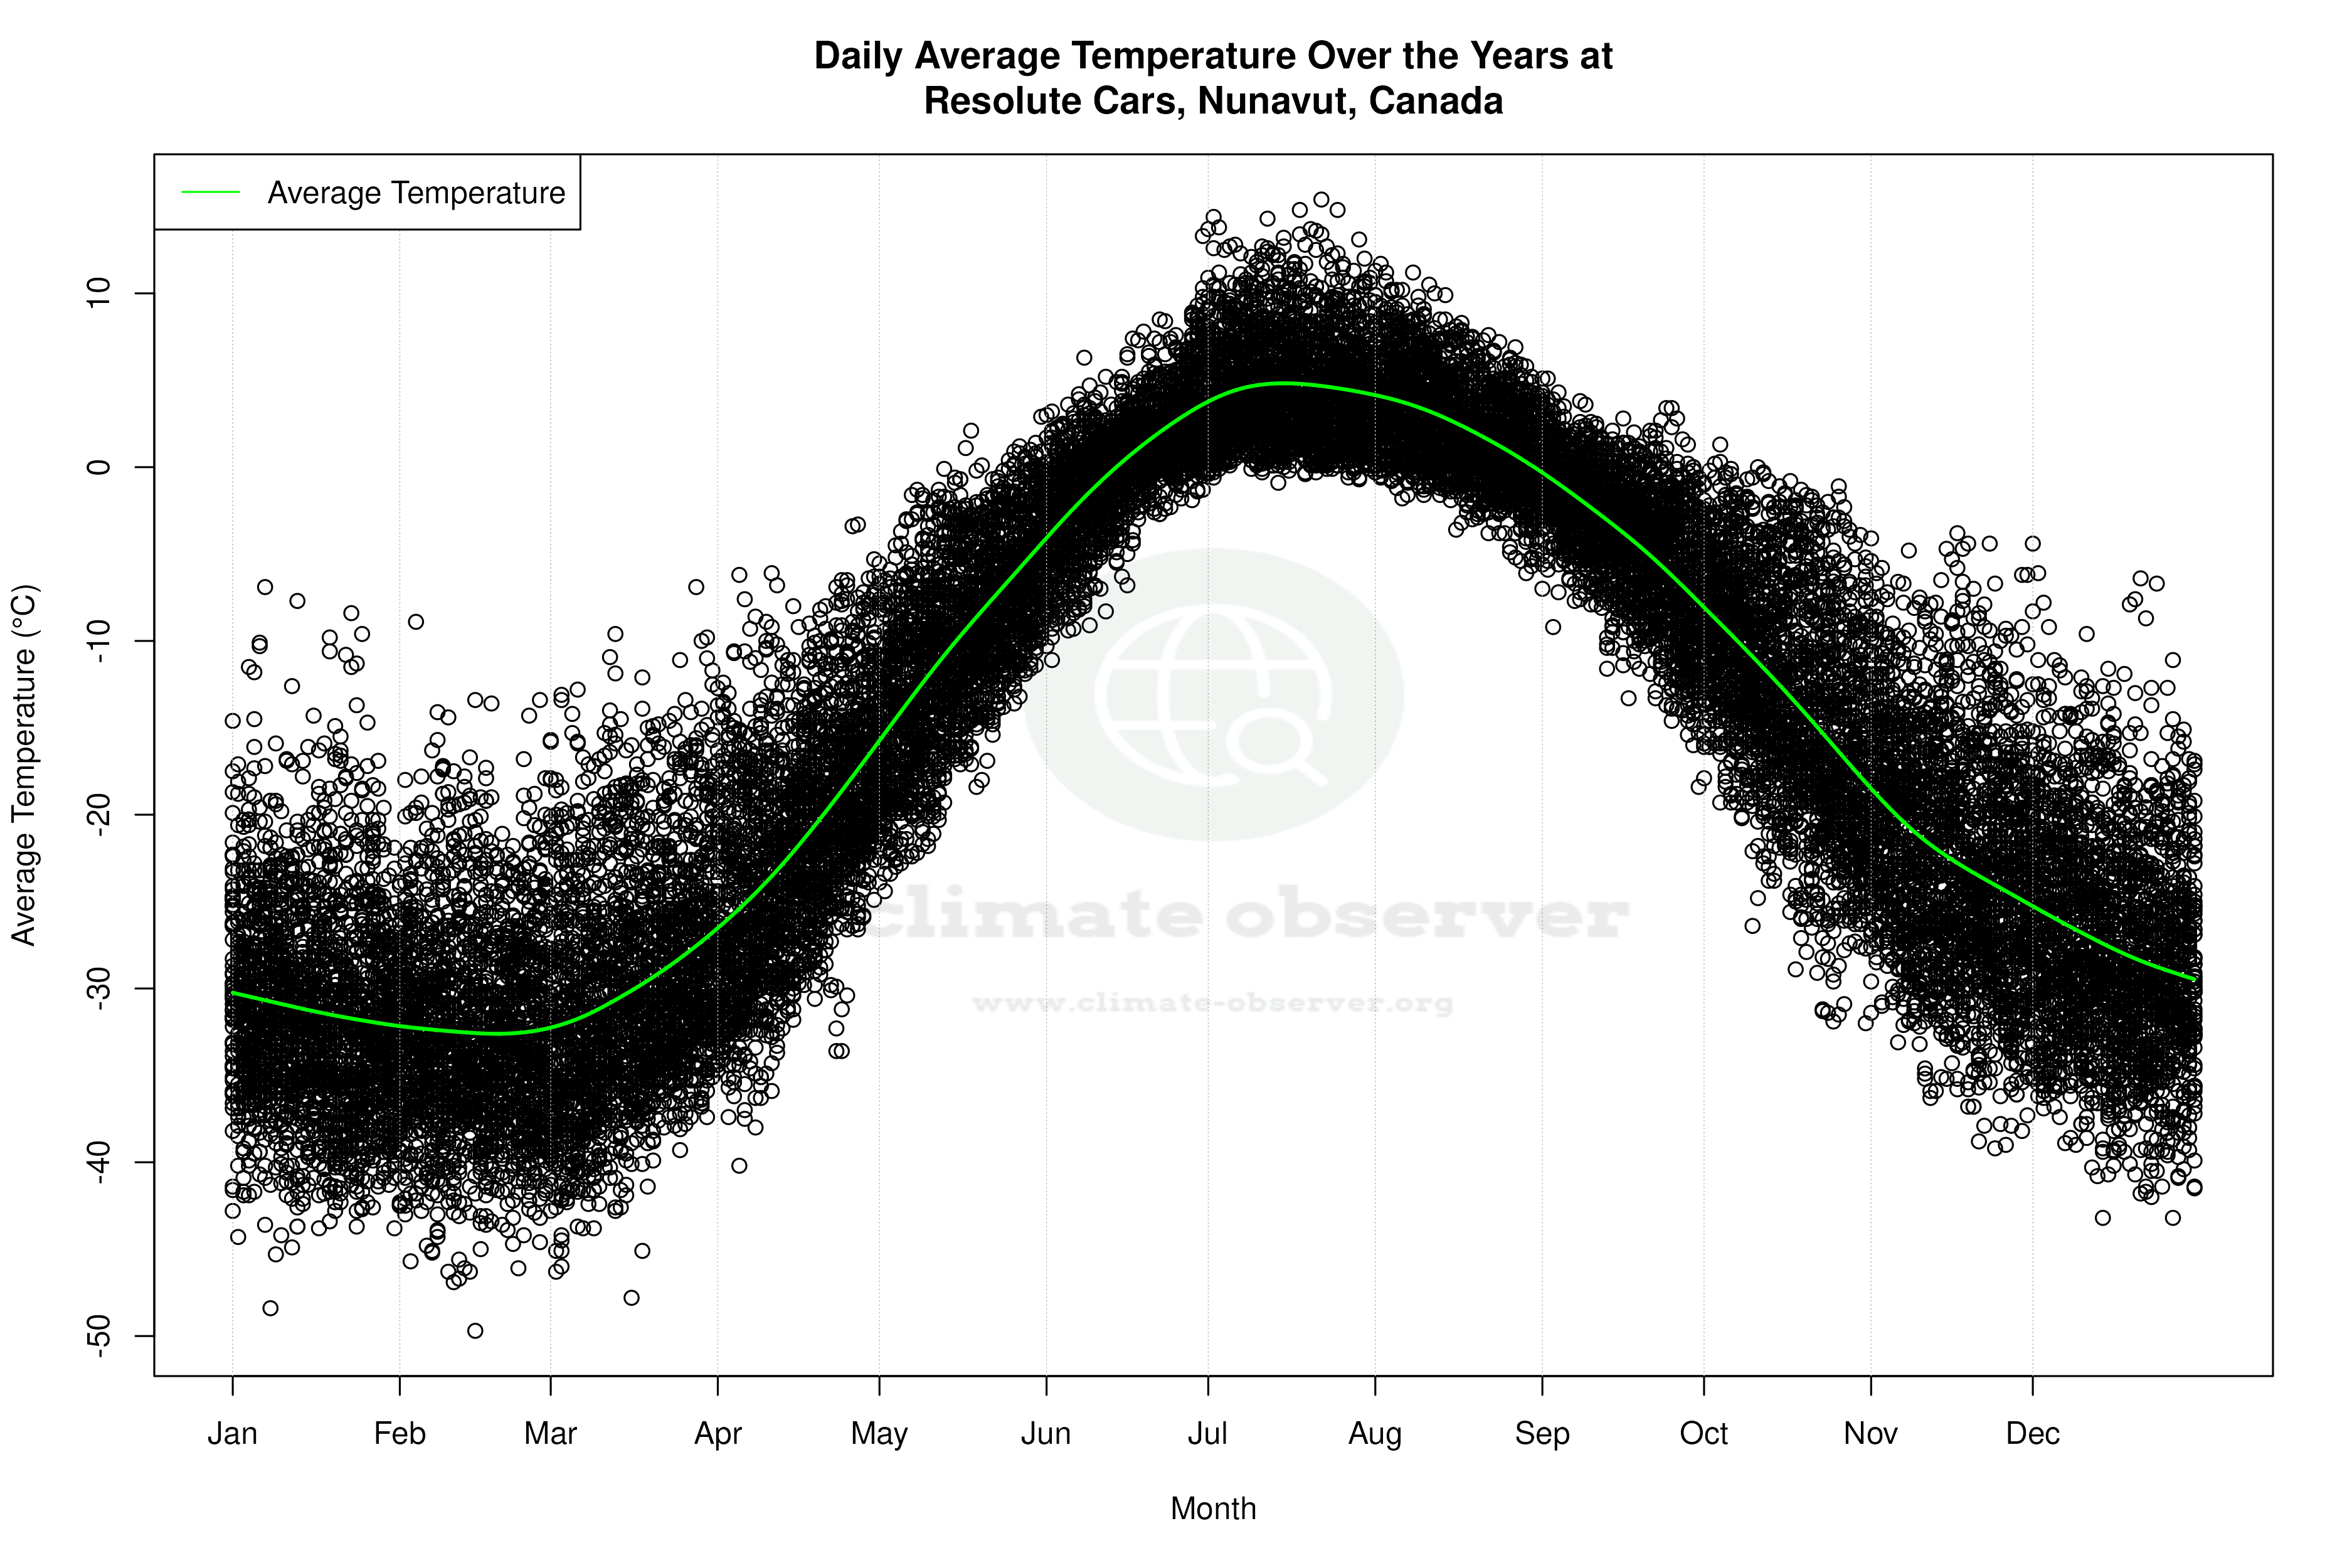


Average Max Temperature Throughout Year | 1 of 5
