Climate for Station: Banff, Alberta, Canada
Loading live weather...
Climate Analysis & Overview
Banff, nestled in the heart of the Canadian Rockies, is experiencing a warming trend with notable increases in both high and low temperatures over the past decade. While precipitation patterns show a slight shift towards more even distribution, the region's climate remains defined by its mountainous terrain and unique Köppen classification.
Mountainous Climate Dynamics
Banff, located at 51.1833°N, 115.5667°W, is classified under the Köppen climate system as a subarctic climate (Dfc), characterized by cold, snowy winters and mild summers. The surrounding Rocky Mountains significantly influence local weather patterns, causing rapid changes in temperature and precipitation. The elevation and topography contribute to the area's distinct seasonal variations.
Warming Trends in the Rockies
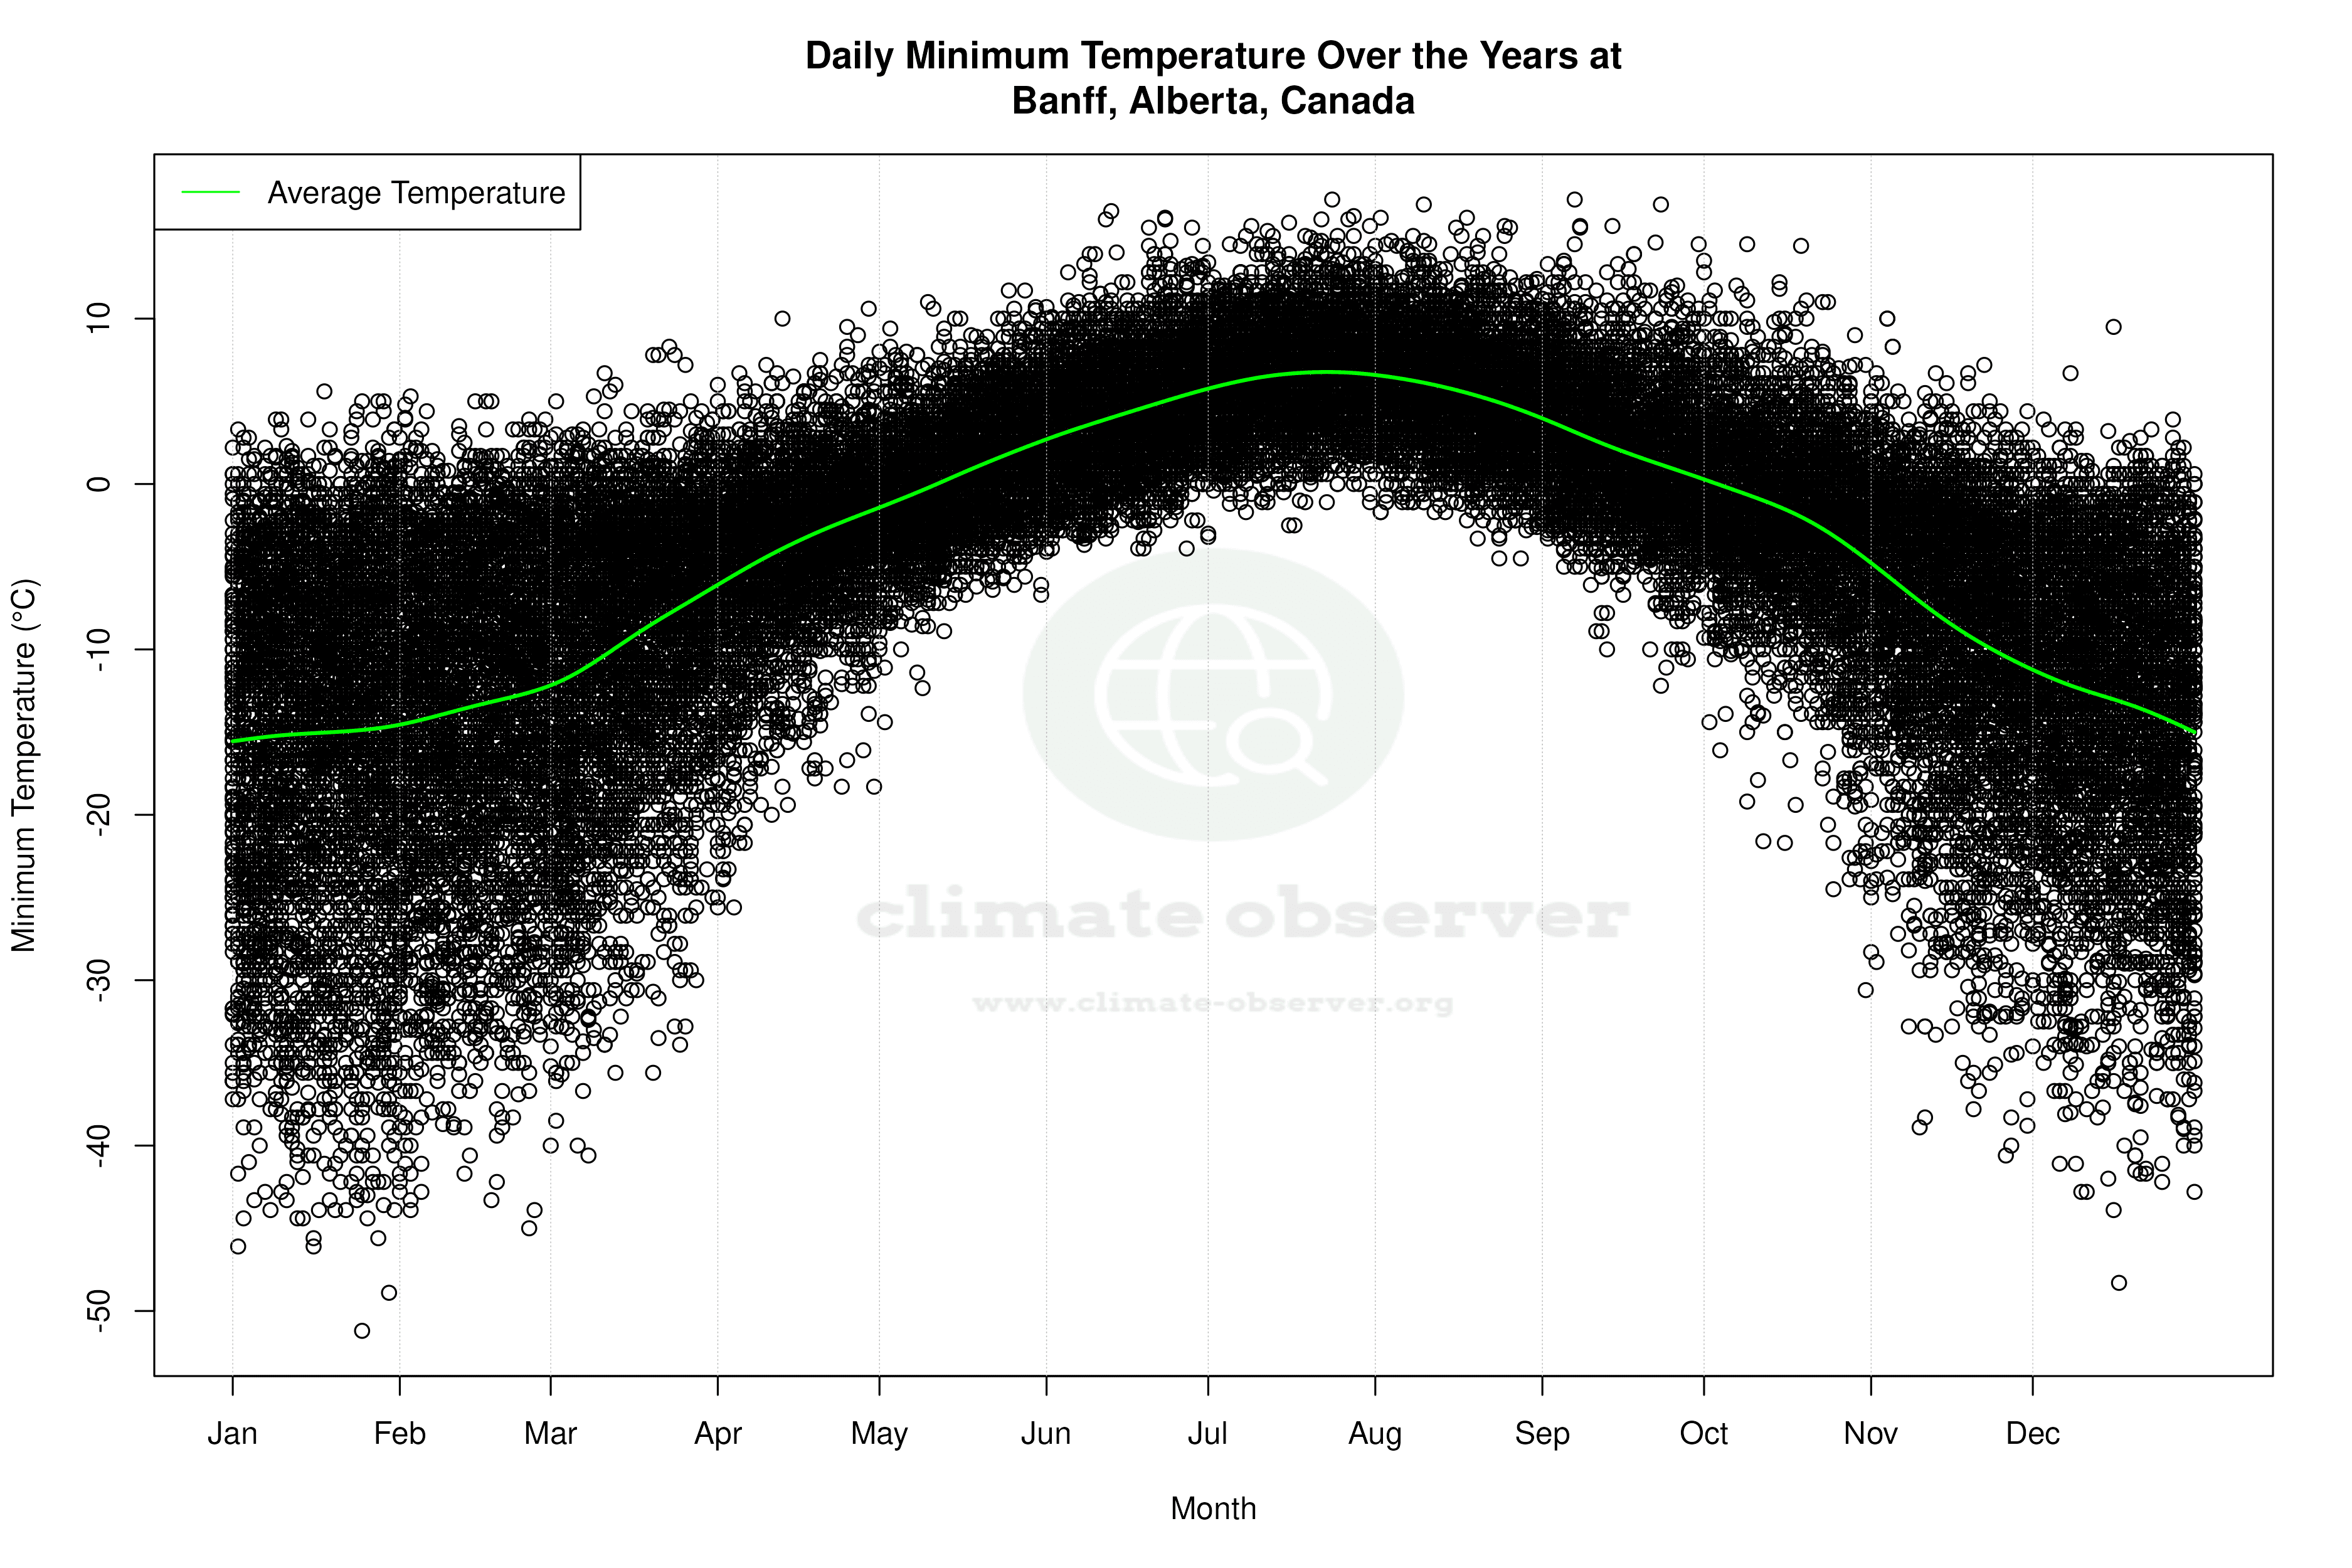
The all-time temperature trends reveal a consistent warming pattern. Highs have increased by 0.17°C (0.31°F), while lows have risen by 0.10°C (0.18°F). Over the past decade, this warming has accelerated, with highs climbing by 0.41°C (0.74°F) and lows by a more pronounced 1.29°C (2.32°F). These trends suggest a shift towards milder winters and warmer summers, potentially impacting local ecosystems and tourism patterns.
Extreme Temperature Records
Banff's climate extremes are marked by a record high of 37.8°C (100.0°F) and a chilling record low of -51.2°C (-60.2°F). These extremes underscore the region's capacity for significant thermal oscillations, influenced by its altitude and latitude. Such variability is a hallmark of Banff's climate, offering both challenges and opportunities for adaptation.
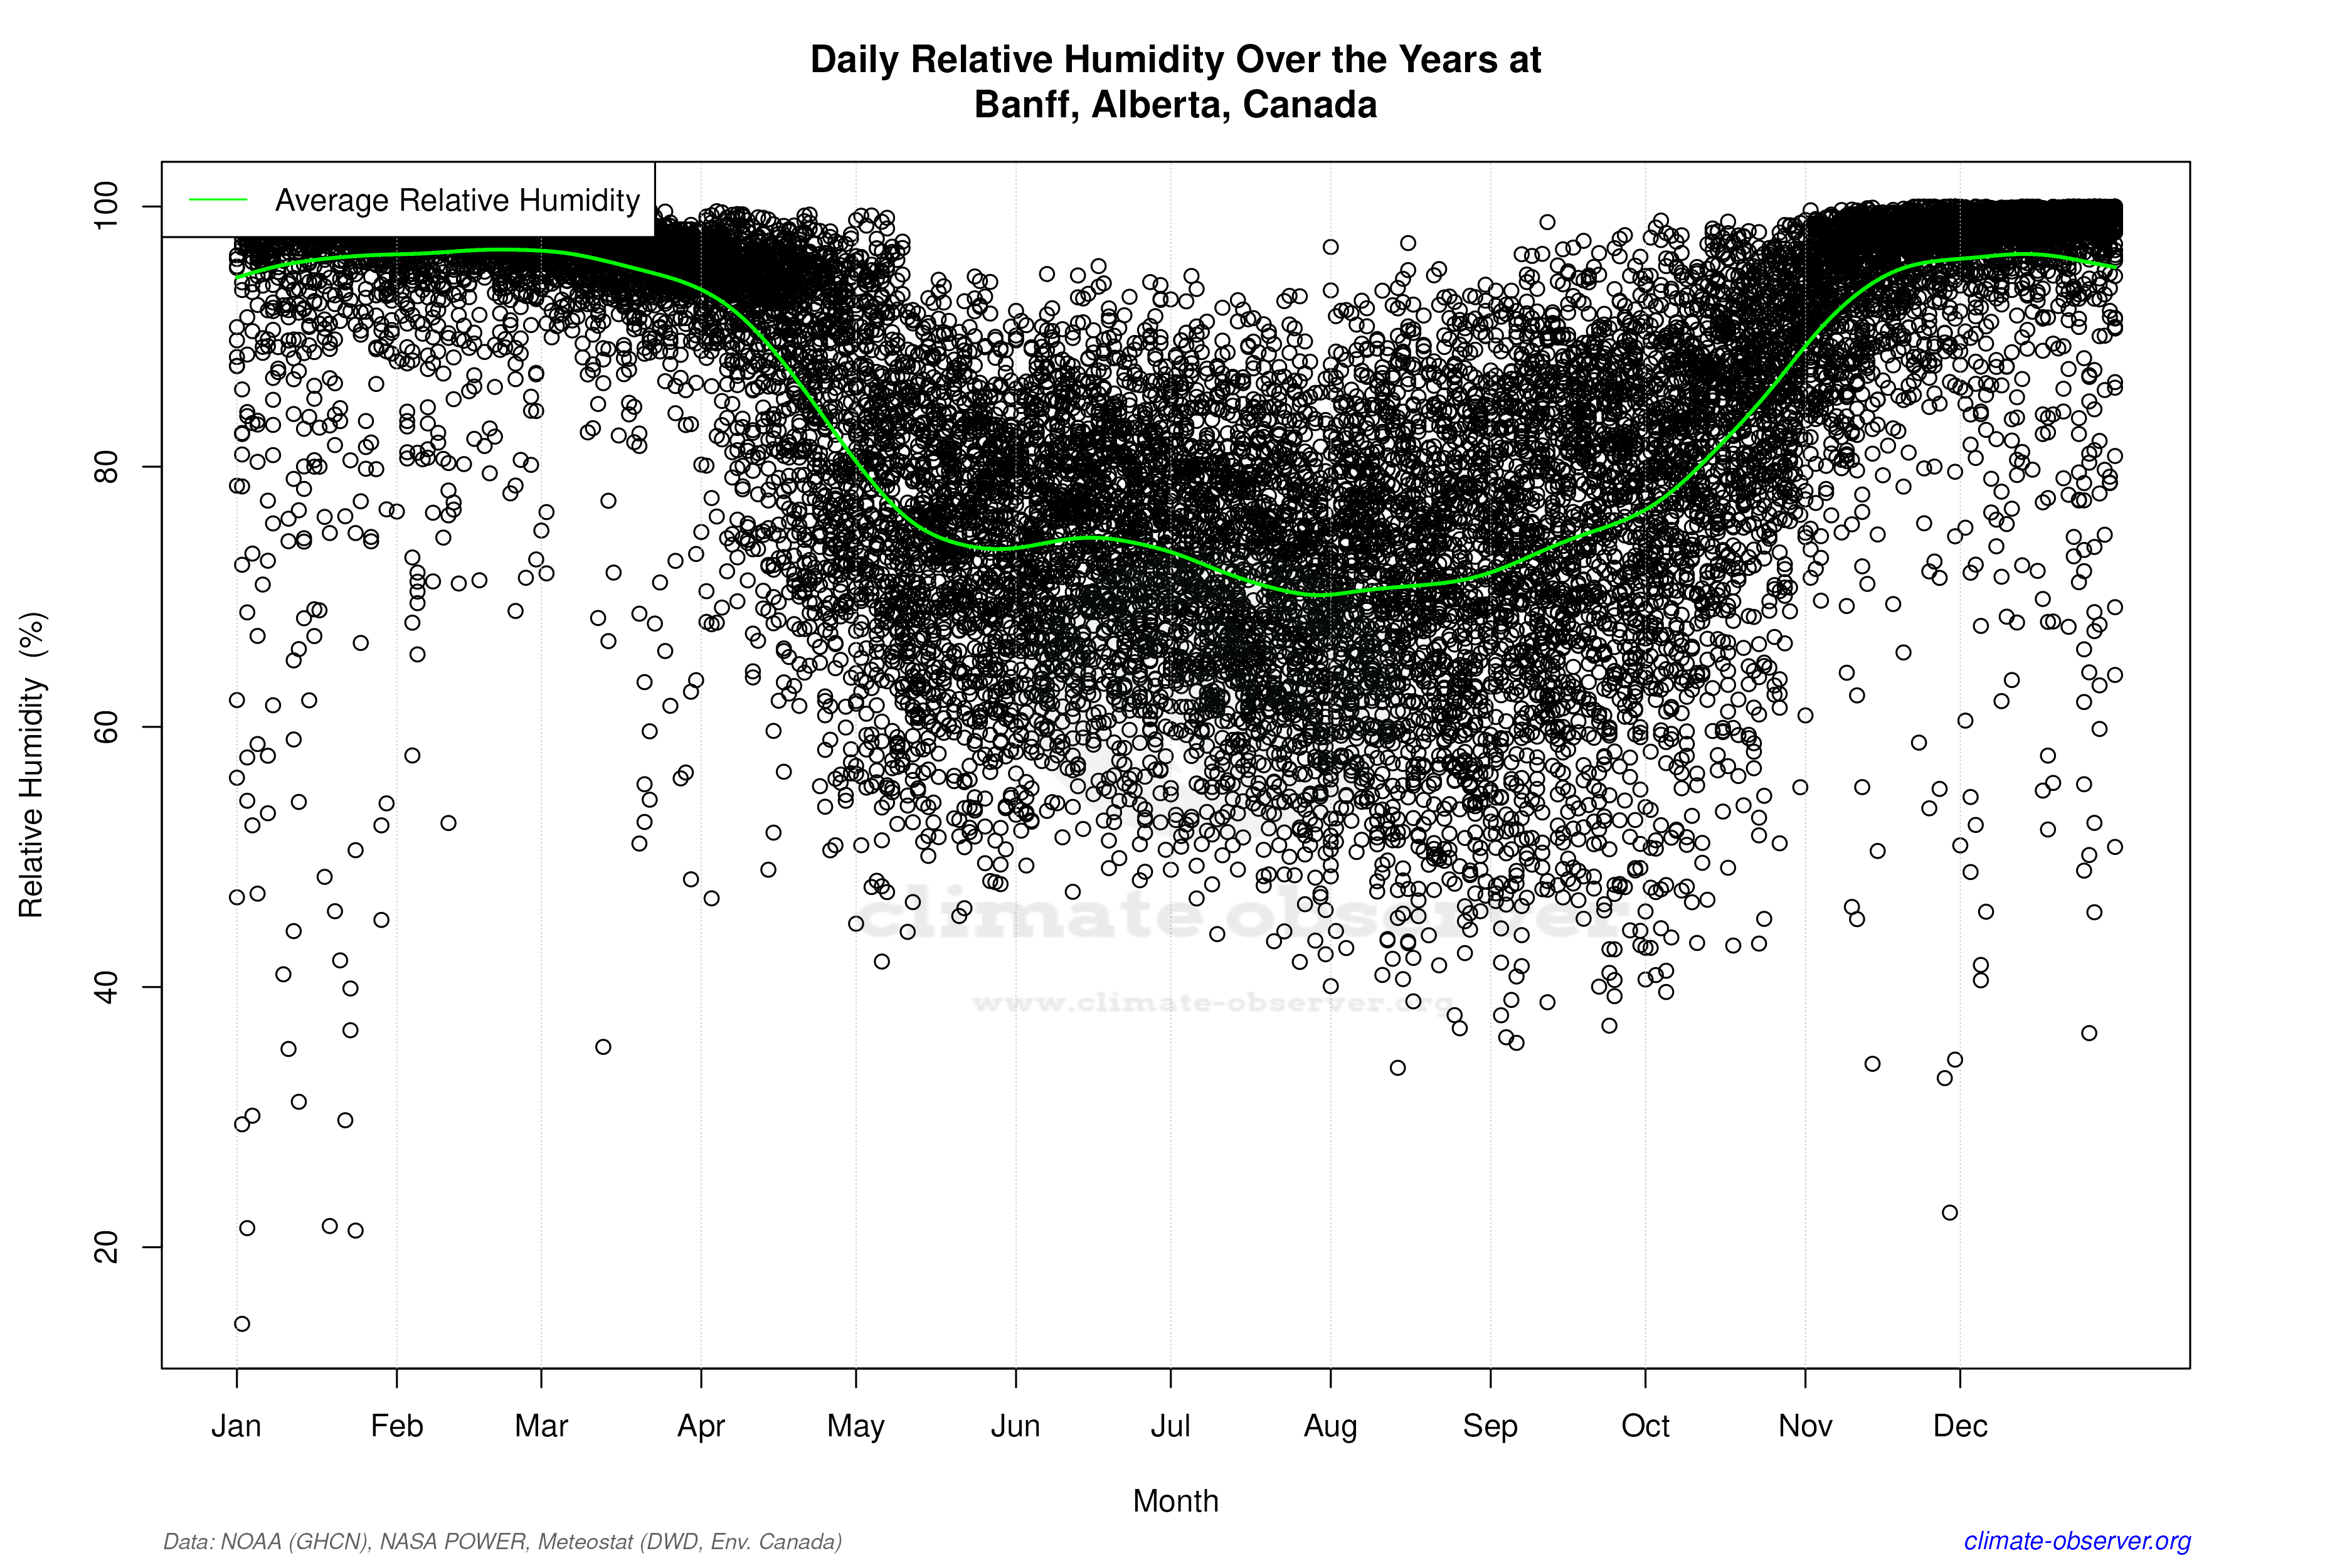
Precipitation Patterns and Distribution
The Precipitation Concentration Index (PCI) provides insight into how rainfall is distributed throughout the year. A baseline PCI of 11.64 compared to the current 11.55 indicates a slight shift towards more evenly distributed precipitation events. This marginal change suggests that while precipitation remains moderately concentrated, there is a trend towards a more balanced distribution, which could affect water resource management and local agriculture.
Regional Climate Context
Canada's commitment to reducing greenhouse gas emissions and enhancing climate resilience aligns with the observed trends in Banff. Recent weather events, such as unseasonal temperature spikes and heavy snowfall, highlight the importance of ongoing climate monitoring. As Banff continues to adapt to these changes, understanding its unique climatic profile is crucial for informed decision-making in both conservation and development efforts.
Station Statistics
10-Year Trend
High: +0.46 °F/decade
Low: +3.22 °F/decade
Rain: +0.018 in/decade
25-Year Trend
High: +1.14 °F/decade
Low: +0.88 °F/decade
Rain: +0.000 in/decade
50-Year Trend
High: +0.70 °F/decade
Low: -0.32 °F/decade
Rain: -0.004 in/decade
All-Time Trend
High: +0.31 °F/decade
Low: +0.19 °F/decade
Rain: -0.000 in/decade
Percentage Above-Average Days
Last 12 Months: 42.2%
This Year: 22.0%
Precipitation Concentration Index (PCI) ℹ️
Last 12 Months: 10.2
Historical Average: 11.9
Percentile Rank of Last 12 Months ℹ️
High: 88th percentile
Low: 98th percentile
Rain: 91st percentile
Change in Variance ℹ️
High: +4.8%
Low: -5.8%
Intraday: +4.1%
Data Coverage
83.9%
First Year of Data
1887
Station Location
Historical Weather Records
| Max High | Avg High | Min High | Max Avg | Avg Avg | Min Avg | Max Low | Avg Low | Min Low | Max Precipitation | Avg Precipitation | Max Snow | Avg Snow | |
|---|---|---|---|---|---|---|---|---|---|---|---|---|---|
| Record | 100.04 °F | — | -34.96 °F | 80.24 °F | — | -33.18 °F | 62.96 °F | — | -60.16 °F | 2.36 in | — | 23.07 in | — |
| January | 54.14 °F | 22.92 °F | -34.96 °F | 46.22 °F | 15.05 °F | -31.72 °F | 42.08 °F | 4.89 °F | -60.16 °F | 1.31 in | 0.04 in | 17.91 in | 0.42 in |
| February | 58.46 °F | 29.74 °F | -23.98 °F | 44.96 °F | 18.74 °F | -29.02 °F | 41.54 °F | 8.03 °F | -49.00 °F | 1.46 in | 0.03 in | 19.02 in | 0.35 in |
| March | 68.00 °F | 37.60 °F | -6.32 °F | 58.46 °F | 27.86 °F | -15.70 °F | 46.94 °F | 15.20 °F | -41.08 °F | 1.60 in | 0.04 in | 15.98 in | 0.32 in |
| April | 78.08 °F | 48.05 °F | 6.08 °F | 59.54 °F | 37.40 °F | 7.16 °F | 51.08 °F | 25.48 °F | -15.11 °F | 1.85 in | 0.05 in | 13.58 in | 0.31 in |
| May | 84.92 °F | 57.98 °F | 25.16 °F | 71.60 °F | 47.39 °F | 19.74 °F | 53.06 °F | 33.04 °F | 6.08 °F | 2.11 in | 0.07 in | 19.02 in | 0.16 in |
| June | 100.04 °F | 64.94 °F | 34.02 °F | 79.70 °F | 55.07 °F | 32.92 °F | 61.70 °F | 39.65 °F | 24.62 °F | 2.36 in | 0.09 in | 5.98 in | 0.02 in |
| July | 99.32 °F | 72.80 °F | 44.06 °F | 80.24 °F | 60.58 °F | 37.13 °F | 62.96 °F | 43.72 °F | 26.24 °F | 2.09 in | 0.06 in | 2.99 in | 0.00 in |
| August | 93.56 °F | 71.05 °F | 37.40 °F | 77.72 °F | 59.25 °F | 26.71 °F | 62.42 °F | 42.03 °F | 23.90 °F | 1.98 in | 0.07 in | 2.28 in | 0.00 in |
| September | 90.32 °F | 61.18 °F | 26.96 °F | 77.18 °F | 50.93 °F | 25.16 °F | 62.96 °F | 35.76 °F | 1.94 °F | 1.90 in | 0.06 in | 9.29 in | 0.08 in |
| October | 79.70 °F | 49.34 °F | 5.00 °F | 70.88 °F | 40.05 °F | -14.42 °F | 58.10 °F | 28.93 °F | -23.08 °F | 1.80 in | 0.04 in | 17.99 in | 0.21 in |
| November | 61.70 °F | 33.23 °F | -17.45 °F | 54.14 °F | 26.90 °F | -20.92 °F | 50.00 °F | 17.14 °F | -41.08 °F | 2.10 in | 0.04 in | 20.98 in | 0.41 in |
| December | 54.50 °F | 24.21 °F | -34.06 °F | 50.72 °F | 15.98 °F | -33.18 °F | 49.10 °F | 8.48 °F | -54.94 °F | 1.95 in | 0.04 in | 23.07 in | 0.44 in |
Data Visualisations
Remove WatermarksCurrent Year Climate Trends vs Historical


Max Temperature this Year | 1 of 6
Climate 12-Month Moving Averages


Max Temperature 12-Month MA | 1 of 6
Daily Data Points and Averages Throughout the Year


Average Max Temperature Throughout Year | 1 of 5
