Climate for Station: Ottawa Cda, Ontario, Canada
Loading live weather...
Climate Analysis & Overview
Ottawa's climate is experiencing a noticeable warming trend, with recent decades showing a sharper increase in temperatures compared to the all-time average. The distribution of precipitation has become more even, indicating a shift in weather patterns. These changes align with broader regional climate goals to understand and mitigate climate impacts.
Continental Climate Dynamics
Ottawa, located at 45.38°N, 75.72°W, experiences a humid continental climate (Köppen classification Dfb), characterised by cold, snowy winters and warm, humid summers. The local geography, including the Ottawa River, influences these patterns by moderating temperatures slightly and contributing to local humidity levels. Over the past decade, Ottawa has seen a warming trend with average high temperatures increasing by 1.47°C (2.65°F) and low temperatures by 0.88°C (1.58°F). This is more pronounced than the all-time warming trend which shows a rise of 0.11°C (0.20°F) for highs and 0.24°C (0.43°F) for lows. This suggests an acceleration in temperature changes recently.
Thermal Extremes and Records
Ottawa's temperature records highlight the city's capacity for extremes. The highest recorded temperature is 37.8°C (100.0°F), while the lowest is -38.9°C (-38.0°F), illustrating the wide thermal range typical of continental climates. These extremes are significant for infrastructure and energy planning, as they require robust systems to handle both intense heat and severe cold.
Precipitation Patterns and Shifts
The Precipitation Concentration Index (PCI) for Ottawa has shifted from a baseline of 10.81 to a current value of 9.07. A PCI below 10 indicates that precipitation is now more evenly distributed throughout the year, a change from the past where rainfall might have been more concentrated in fewer events. This even distribution can mitigate flooding risks and improve water resource management, aligning with regional climate adaptation strategies.
Implications for Regional Climate Goals
These climatic shifts in Ottawa are reflective of broader trends observed across Eastern Ontario and Canada as a whole. The warming trend, particularly in recent years, underscores the importance of Canada's climate goals, which focus on reducing greenhouse gas emissions and enhancing resilience to climate impacts. Recent weather events, such as unseasonal heatwaves or prolonged cold snaps, further highlight the urgency of these initiatives. Understanding these localised changes is crucial for developing effective strategies to address climate challenges.
Station Statistics
10-Year Trend
High: +2.16 °F/decade
Low: +1.39 °F/decade
Rain: -0.015 in/decade
25-Year Trend
High: +0.75 °F/decade
Low: +0.48 °F/decade
Rain: +0.004 in/decade
50-Year Trend
High: +0.81 °F/decade
Low: +0.64 °F/decade
Rain: -0.001 in/decade
All-Time Trend
High: +0.19 °F/decade
Low: +0.42 °F/decade
Rain: +0.000 in/decade
Percentage Above-Average Days
Last 12 Months: 51.2%
This Year: 40.9%
Precipitation Concentration Index (PCI) ℹ️
Last 12 Months: 10.4
Historical Average: 10.2
Percentile Rank of Last 12 Months ℹ️
High: 86th percentile
Low: 88th percentile
Rain: 39th percentile
Change in Variance ℹ️
High: -7.1%
Low: -11.3%
Intraday: -9.5%
Data Coverage
87.4%
First Year of Data
1889
Station Location
Historical Weather Records
| Max High | Avg High | Min High | Max Avg | Avg Avg | Min Avg | Max Low | Avg Low | Min Low | Max Precipitation | Avg Precipitation | Max Snow | Avg Snow | |
|---|---|---|---|---|---|---|---|---|---|---|---|---|---|
| Record | 100.04 °F | — | -25.06 °F | 87.62 °F | — | -25.91 °F | 77.00 °F | — | -38.02 °F | 3.88 in | — | 22.01 in | — |
| January | 53.60 °F | 21.31 °F | -18.40 °F | 49.28 °F | 13.79 °F | -25.91 °F | 41.36 °F | 4.71 °F | -36.04 °F | 2.20 in | 0.08 in | 22.01 in | 0.64 in |
| February | 60.80 °F | 23.89 °F | -18.04 °F | 49.10 °F | 16.77 °F | -17.82 °F | 40.10 °F | 6.03 °F | -36.94 °F | 1.80 in | 0.08 in | 17.99 in | 0.63 in |
| March | 80.06 °F | 34.93 °F | -0.94 °F | 62.78 °F | 27.56 °F | -11.38 °F | 51.26 °F | 18.24 °F | -34.06 °F | 1.74 in | 0.09 in | 19.02 in | 0.42 in |
| April | 88.16 °F | 51.55 °F | 19.94 °F | 74.66 °F | 42.76 °F | 12.47 °F | 63.32 °F | 32.86 °F | -5.08 °F | 1.74 in | 0.09 in | 12.99 in | 0.10 in |
| May | 95.36 °F | 66.19 °F | 36.50 °F | 81.68 °F | 55.88 °F | 31.46 °F | 69.80 °F | 44.85 °F | 19.04 °F | 2.99 in | 0.09 in | 7.52 in | 0.00 in |
| June | 98.06 °F | 75.50 °F | 50.00 °F | 84.38 °F | 65.10 °F | 40.46 °F | 77.00 °F | 54.52 °F | 32.00 °F | 2.62 in | 0.11 in | 0.00 in | 0.00 in |
| July | 100.04 °F | 80.03 °F | 53.96 °F | 85.28 °F | 69.58 °F | 52.70 °F | 75.56 °F | 58.93 °F | 37.94 °F | 3.11 in | 0.11 in | 0.00 in | 0.00 in |
| August | 100.04 °F | 77.67 °F | 55.04 °F | 87.62 °F | 67.30 °F | 46.58 °F | 76.64 °F | 56.59 °F | 35.06 °F | 3.07 in | 0.10 in | 0.00 in | 0.00 in |
| September | 98.06 °F | 69.05 °F | 42.08 °F | 81.14 °F | 58.97 °F | 37.40 °F | 72.32 °F | 49.08 °F | 24.08 °F | 3.88 in | 0.10 in | 0.00 in | 0.00 in |
| October | 87.80 °F | 55.88 °F | 28.04 °F | 73.40 °F | 47.24 °F | 27.68 °F | 65.30 °F | 38.47 °F | 8.96 °F | 2.47 in | 0.09 in | 8.50 in | 0.02 in |
| November | 75.20 °F | 40.70 °F | 8.06 °F | 67.10 °F | 34.91 °F | 5.90 °F | 60.80 °F | 27.67 °F | -11.02 °F | 2.10 in | 0.09 in | 20.98 in | 0.23 in |
| December | 62.96 °F | 26.35 °F | -25.06 °F | 51.26 °F | 20.77 °F | -18.76 °F | 48.02 °F | 12.37 °F | -38.02 °F | 2.88 in | 0.10 in | 14.80 in | 0.61 in |
Data Visualisations
Remove WatermarksCurrent Year Climate Trends vs Historical
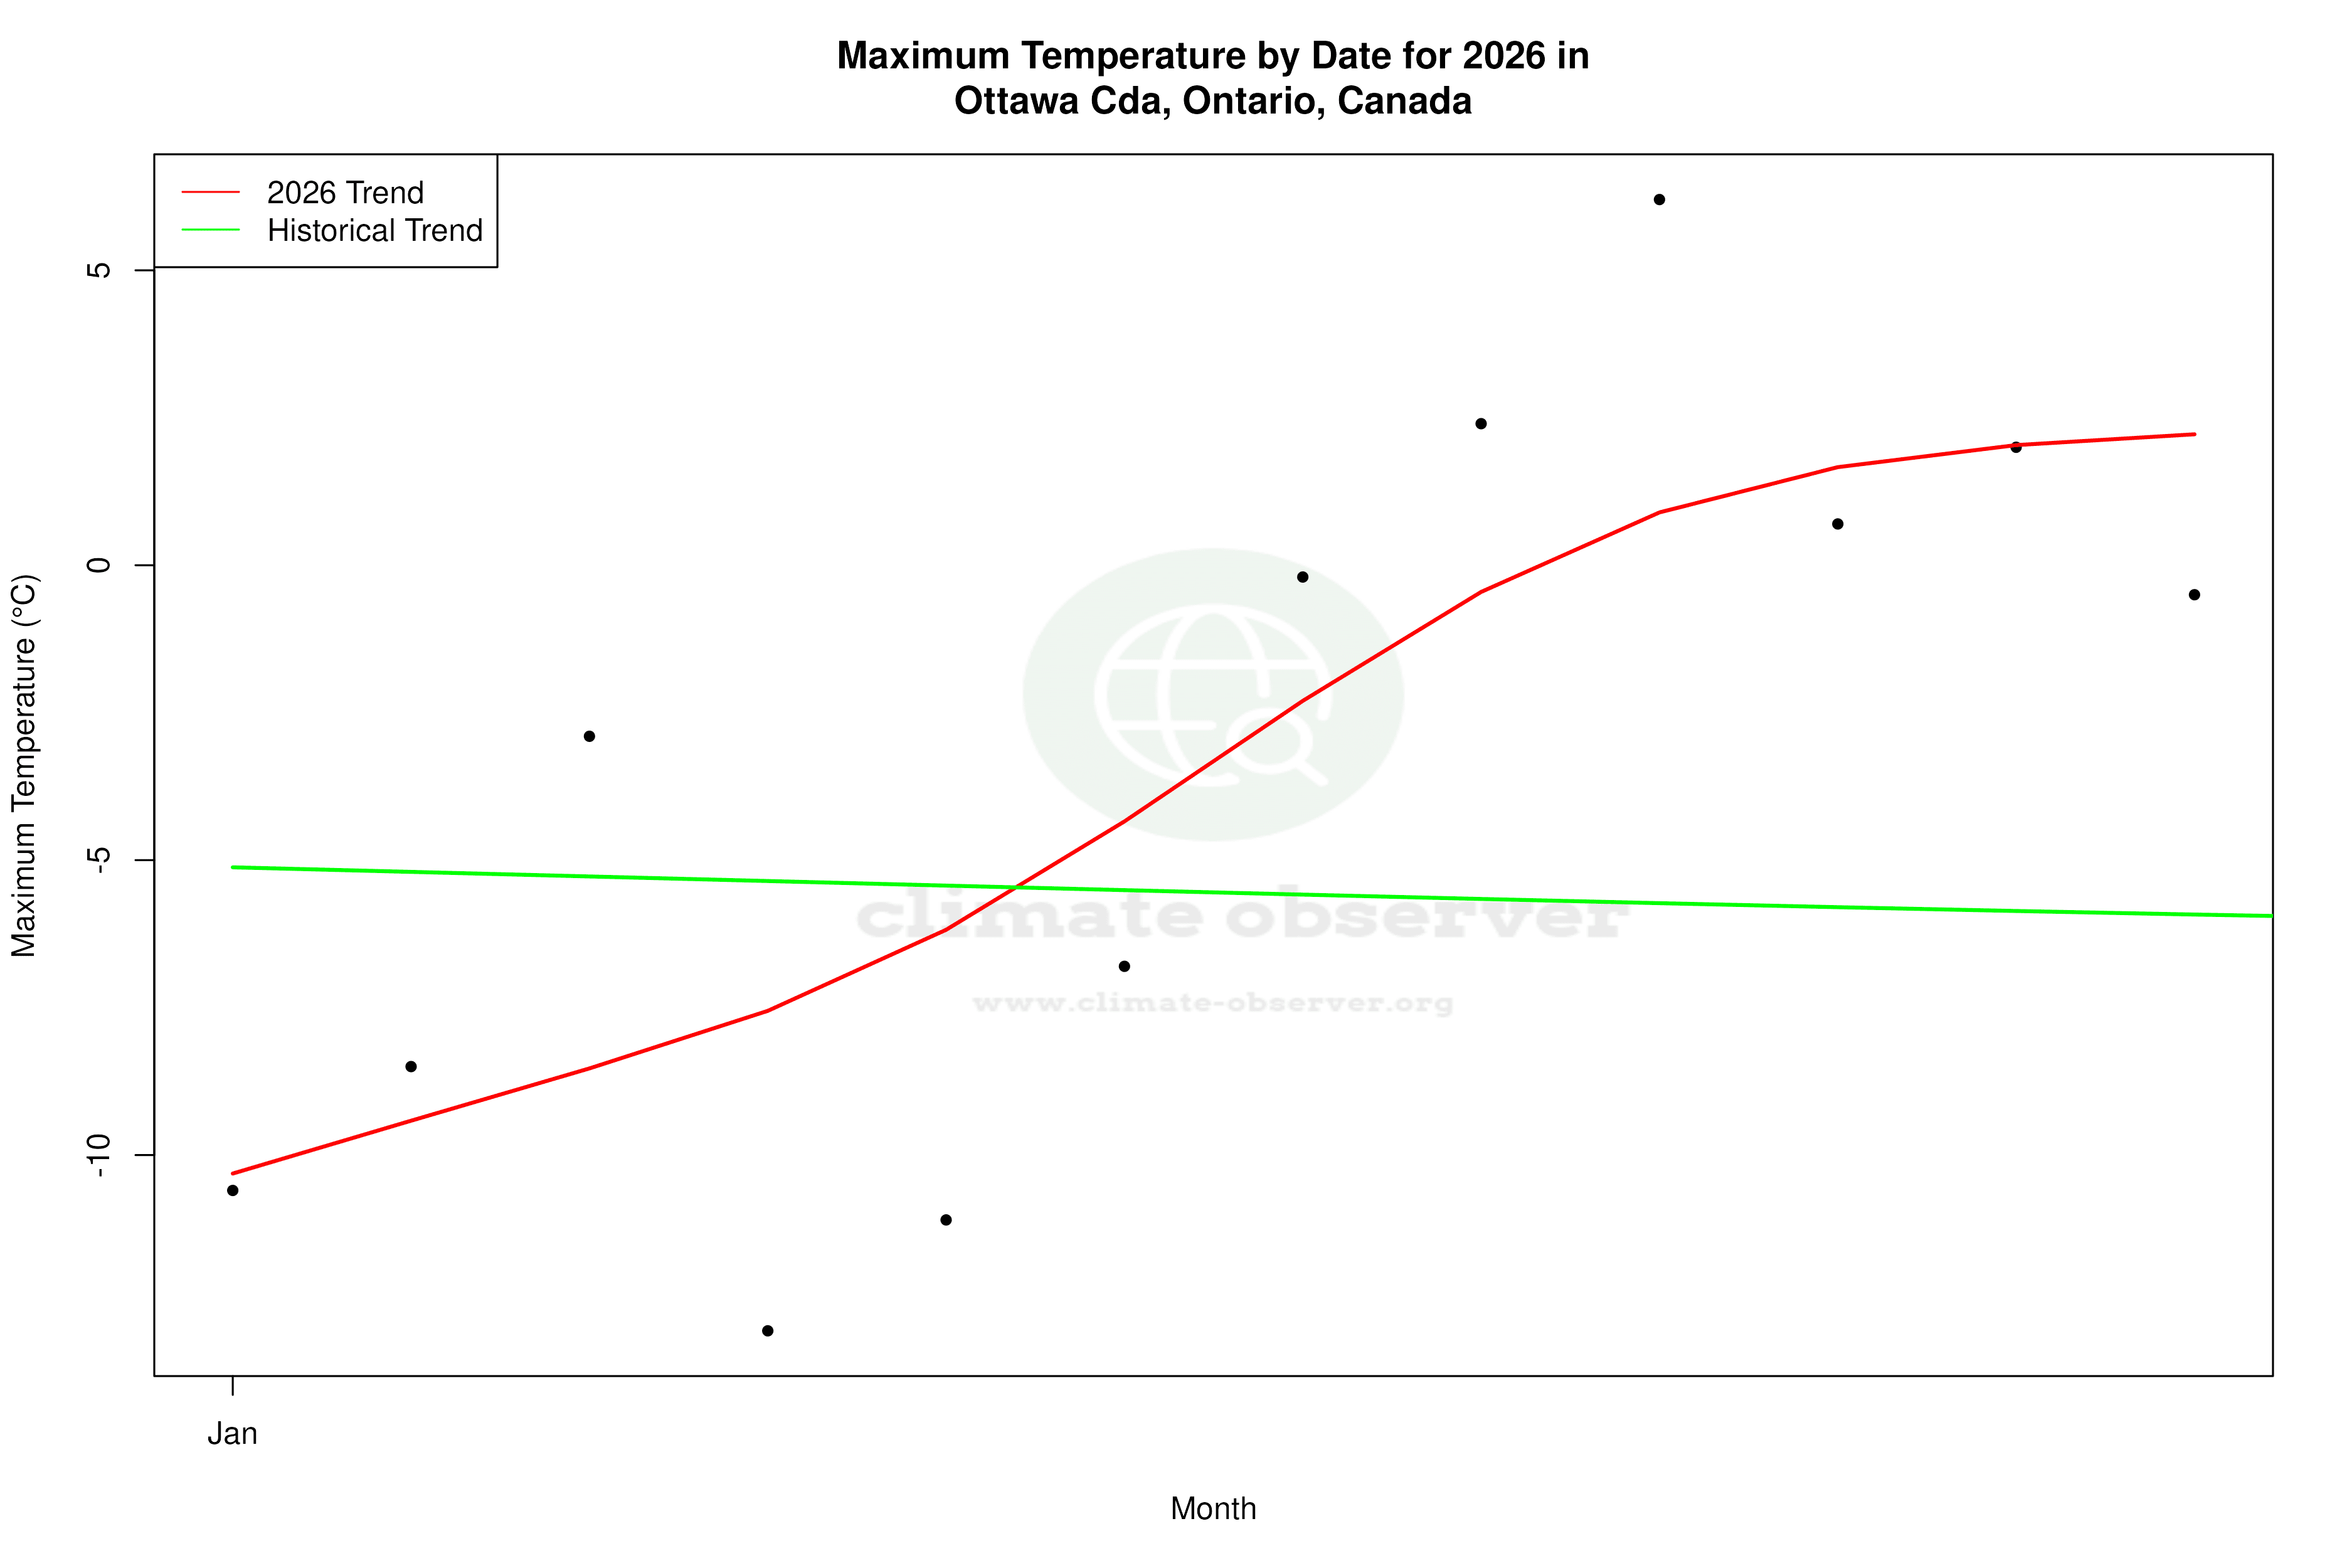


Max Temperature this Year | 1 of 6
Climate 12-Month Moving Averages


Max Temperature 12-Month MA | 1 of 6
Daily Data Points and Averages Throughout the Year


Average Max Temperature Throughout Year | 1 of 5
