Climate for Station: Ottawa Macdonald-Cartier Int'l, Ontario, Canada
Loading live weather...
Climate Analysis & Overview
Ottawa Macdonald-Cartier International Airport is experiencing a notable warming trend, particularly in its minimum temperatures, with a 1.80°C (3.24°F) rise over the past decade. The Precipitation Concentration Index (PCI) indicates a more even distribution of rainfall compared to historical patterns, suggesting changes in local precipitation dynamics.
Climate Classification and Geographic Influences
Ottawa's Macdonald-Cartier International Airport is situated within the humid continental climate zone, characterised by significant temperature variations between seasons. This Köppen classification reflects the influence of its inland position, far from the moderating effects of large water bodies. The Ottawa River and surrounding terrain contribute to local microclimates, affecting both temperature and precipitation patterns. The airport's location at 45.3167°N, 75.6667°W ensures it experiences cold winters and warm summers, typical of Eastern Ontario.
Temperature Trends: A Decade of Change
Over the past decade, Ottawa has seen a significant warming trend in its minimum temperatures, with an increase of 1.80°C (3.24°F). This is contrasted by a more modest rise in maximum temperatures, which have increased by 0.32°C (0.58°F). These changes suggest that while daytime temperatures have risen slightly, nighttime temperatures have warmed more substantially. When examining all-time trends, both highs and lows show a warming pattern, with highs increasing by 0.18°C (0.32°F) and lows by 0.17°C (0.31°F). This consistent warming aligns with broader regional climate goals aimed at understanding and mitigating climate change impacts.
Precipitation Patterns: A Shift Towards Evenness
The Precipitation Concentration Index (PCI) at Ottawa Macdonald-Cartier has decreased from a baseline of 10.82 to a current value of 9.08. This reduction indicates a more even distribution of precipitation events throughout the year, as opposed to being concentrated in fewer, more intense events. A PCI value below 10 suggests a relatively uniform distribution, which may influence agricultural practices and water resource management in the region.
Record Extremes: A Tale of Temperature Extremes
The airport has recorded a maximum temperature of 37.8°C (100.0°F) and a minimum of -36.1°C (-33.0°F). These extremes highlight the significant seasonal variability experienced in Ottawa. The record high underscores the potential for intense summer heatwaves, while the record low exemplifies the harshness of Canadian winters. Understanding these extremes is crucial for infrastructure planning and public health preparedness.
Regional Climate Context and Implications
Ottawa's climate trends are reflective of broader patterns observed across Canada, where warming temperatures and changing precipitation patterns are prevalent. These changes are critical for policymakers and scientists as they work towards achieving national climate targets and adapting to evolving weather patterns. Recent weather events, such as unseasonably warm winters or intense summer storms, provide context for these statistical trends, underscoring the need for continued monitoring and adaptation strategies.
Station Statistics
10-Year Trend
High: +0.39 °F/decade
Low: +3.12 °F/decade
Rain: -0.005 in/decade
25-Year Trend
High: +0.47 °F/decade
Low: +0.41 °F/decade
Rain: +0.002 in/decade
50-Year Trend
High: +0.69 °F/decade
Low: +0.43 °F/decade
Rain: +0.000 in/decade
All-Time Trend
High: +0.32 °F/decade
Low: +0.31 °F/decade
Rain: +0.001 in/decade
Percentage Above-Average Days
Last 12 Months: 50.7%
This Year: 39.2%
Precipitation Concentration Index (PCI) ℹ️
Last 12 Months: 9.0
Historical Average: 10.2
Percentile Rank of Last 12 Months ℹ️
High: 74th percentile
Low: 84th percentile
Rain: 39th percentile
Change in Variance ℹ️
High: -2.7%
Low: -9.2%
Intraday: +9.5%
Data Coverage
94.7%
First Year of Data
1938
Station Location
Historical Weather Records
| Max High | Avg High | Min High | Max Avg | Avg Avg | Min Avg | Max Low | Avg Low | Min Low | Max Precipitation | Avg Precipitation | Max Snow | Avg Snow | |
|---|---|---|---|---|---|---|---|---|---|---|---|---|---|
| Record | 100.04 °F | — | -18.58 °F | 85.28 °F | — | -23.98 °F | 77.00 °F | — | -32.98 °F | 3.88 in | — | 15.98 in | — |
| January | 55.22 °F | 21.29 °F | -18.58 °F | 49.28 °F | 13.89 °F | -23.98 °F | 43.34 °F | 5.02 °F | -32.08 °F | 1.72 in | 0.08 in | 15.20 in | 0.65 in |
| February | 60.80 °F | 24.60 °F | -11.92 °F | 44.60 °F | 16.85 °F | -17.82 °F | 40.10 °F | 7.49 °F | -32.98 °F | 1.59 in | 0.08 in | 15.59 in | 0.65 in |
| March | 81.32 °F | 35.50 °F | -0.94 °F | 63.14 °F | 27.73 °F | -11.38 °F | 51.08 °F | 19.00 °F | -23.08 °F | 1.74 in | 0.08 in | 15.98 in | 0.48 in |
| April | 87.98 °F | 51.78 °F | 19.04 °F | 74.66 °F | 42.74 °F | 14.54 °F | 61.70 °F | 32.76 °F | 1.94 °F | 1.82 in | 0.10 in | 10.51 in | 0.12 in |
| May | 96.44 °F | 66.11 °F | 35.78 °F | 80.06 °F | 55.90 °F | 31.46 °F | 69.08 °F | 44.97 °F | 21.92 °F | 1.88 in | 0.10 in | 5.91 in | 0.01 in |
| June | 96.98 °F | 75.22 °F | 51.08 °F | 84.38 °F | 65.07 °F | 43.34 °F | 75.20 °F | 54.61 °F | 31.82 °F | 2.62 in | 0.11 in | 0.00 in | 0.00 in |
| July | 98.42 °F | 80.03 °F | 57.92 °F | 85.28 °F | 69.74 °F | 53.42 °F | 77.00 °F | 59.30 °F | 41.00 °F | 3.11 in | 0.11 in | 0.00 in | 0.00 in |
| August | 100.04 °F | 77.58 °F | 51.98 °F | 85.10 °F | 67.34 °F | 46.58 °F | 76.10 °F | 57.17 °F | 36.68 °F | 2.64 in | 0.11 in | 0.00 in | 0.00 in |
| September | 95.18 °F | 68.75 °F | 39.92 °F | 80.78 °F | 58.98 °F | 37.40 °F | 71.96 °F | 48.79 °F | 26.60 °F | 3.88 in | 0.11 in | 0.59 in | 0.00 in |
| October | 87.80 °F | 55.91 °F | 32.00 °F | 70.88 °F | 47.15 °F | 27.68 °F | 62.60 °F | 38.16 °F | 16.88 °F | 2.34 in | 0.10 in | 11.50 in | 0.04 in |
| November | 75.02 °F | 41.37 °F | 8.06 °F | 66.38 °F | 34.75 °F | 5.90 °F | 58.64 °F | 27.26 °F | -7.06 °F | 1.82 in | 0.10 in | 11.10 in | 0.28 in |
| December | 64.22 °F | 26.94 °F | -14.08 °F | 51.44 °F | 20.76 °F | -18.76 °F | 45.32 °F | 12.78 °F | -29.92 °F | 1.72 in | 0.10 in | 14.02 in | 0.69 in |
Data Visualisations
Remove WatermarksCurrent Year Climate Trends vs Historical


Max Temperature this Year | 1 of 6
Climate 12-Month Moving Averages


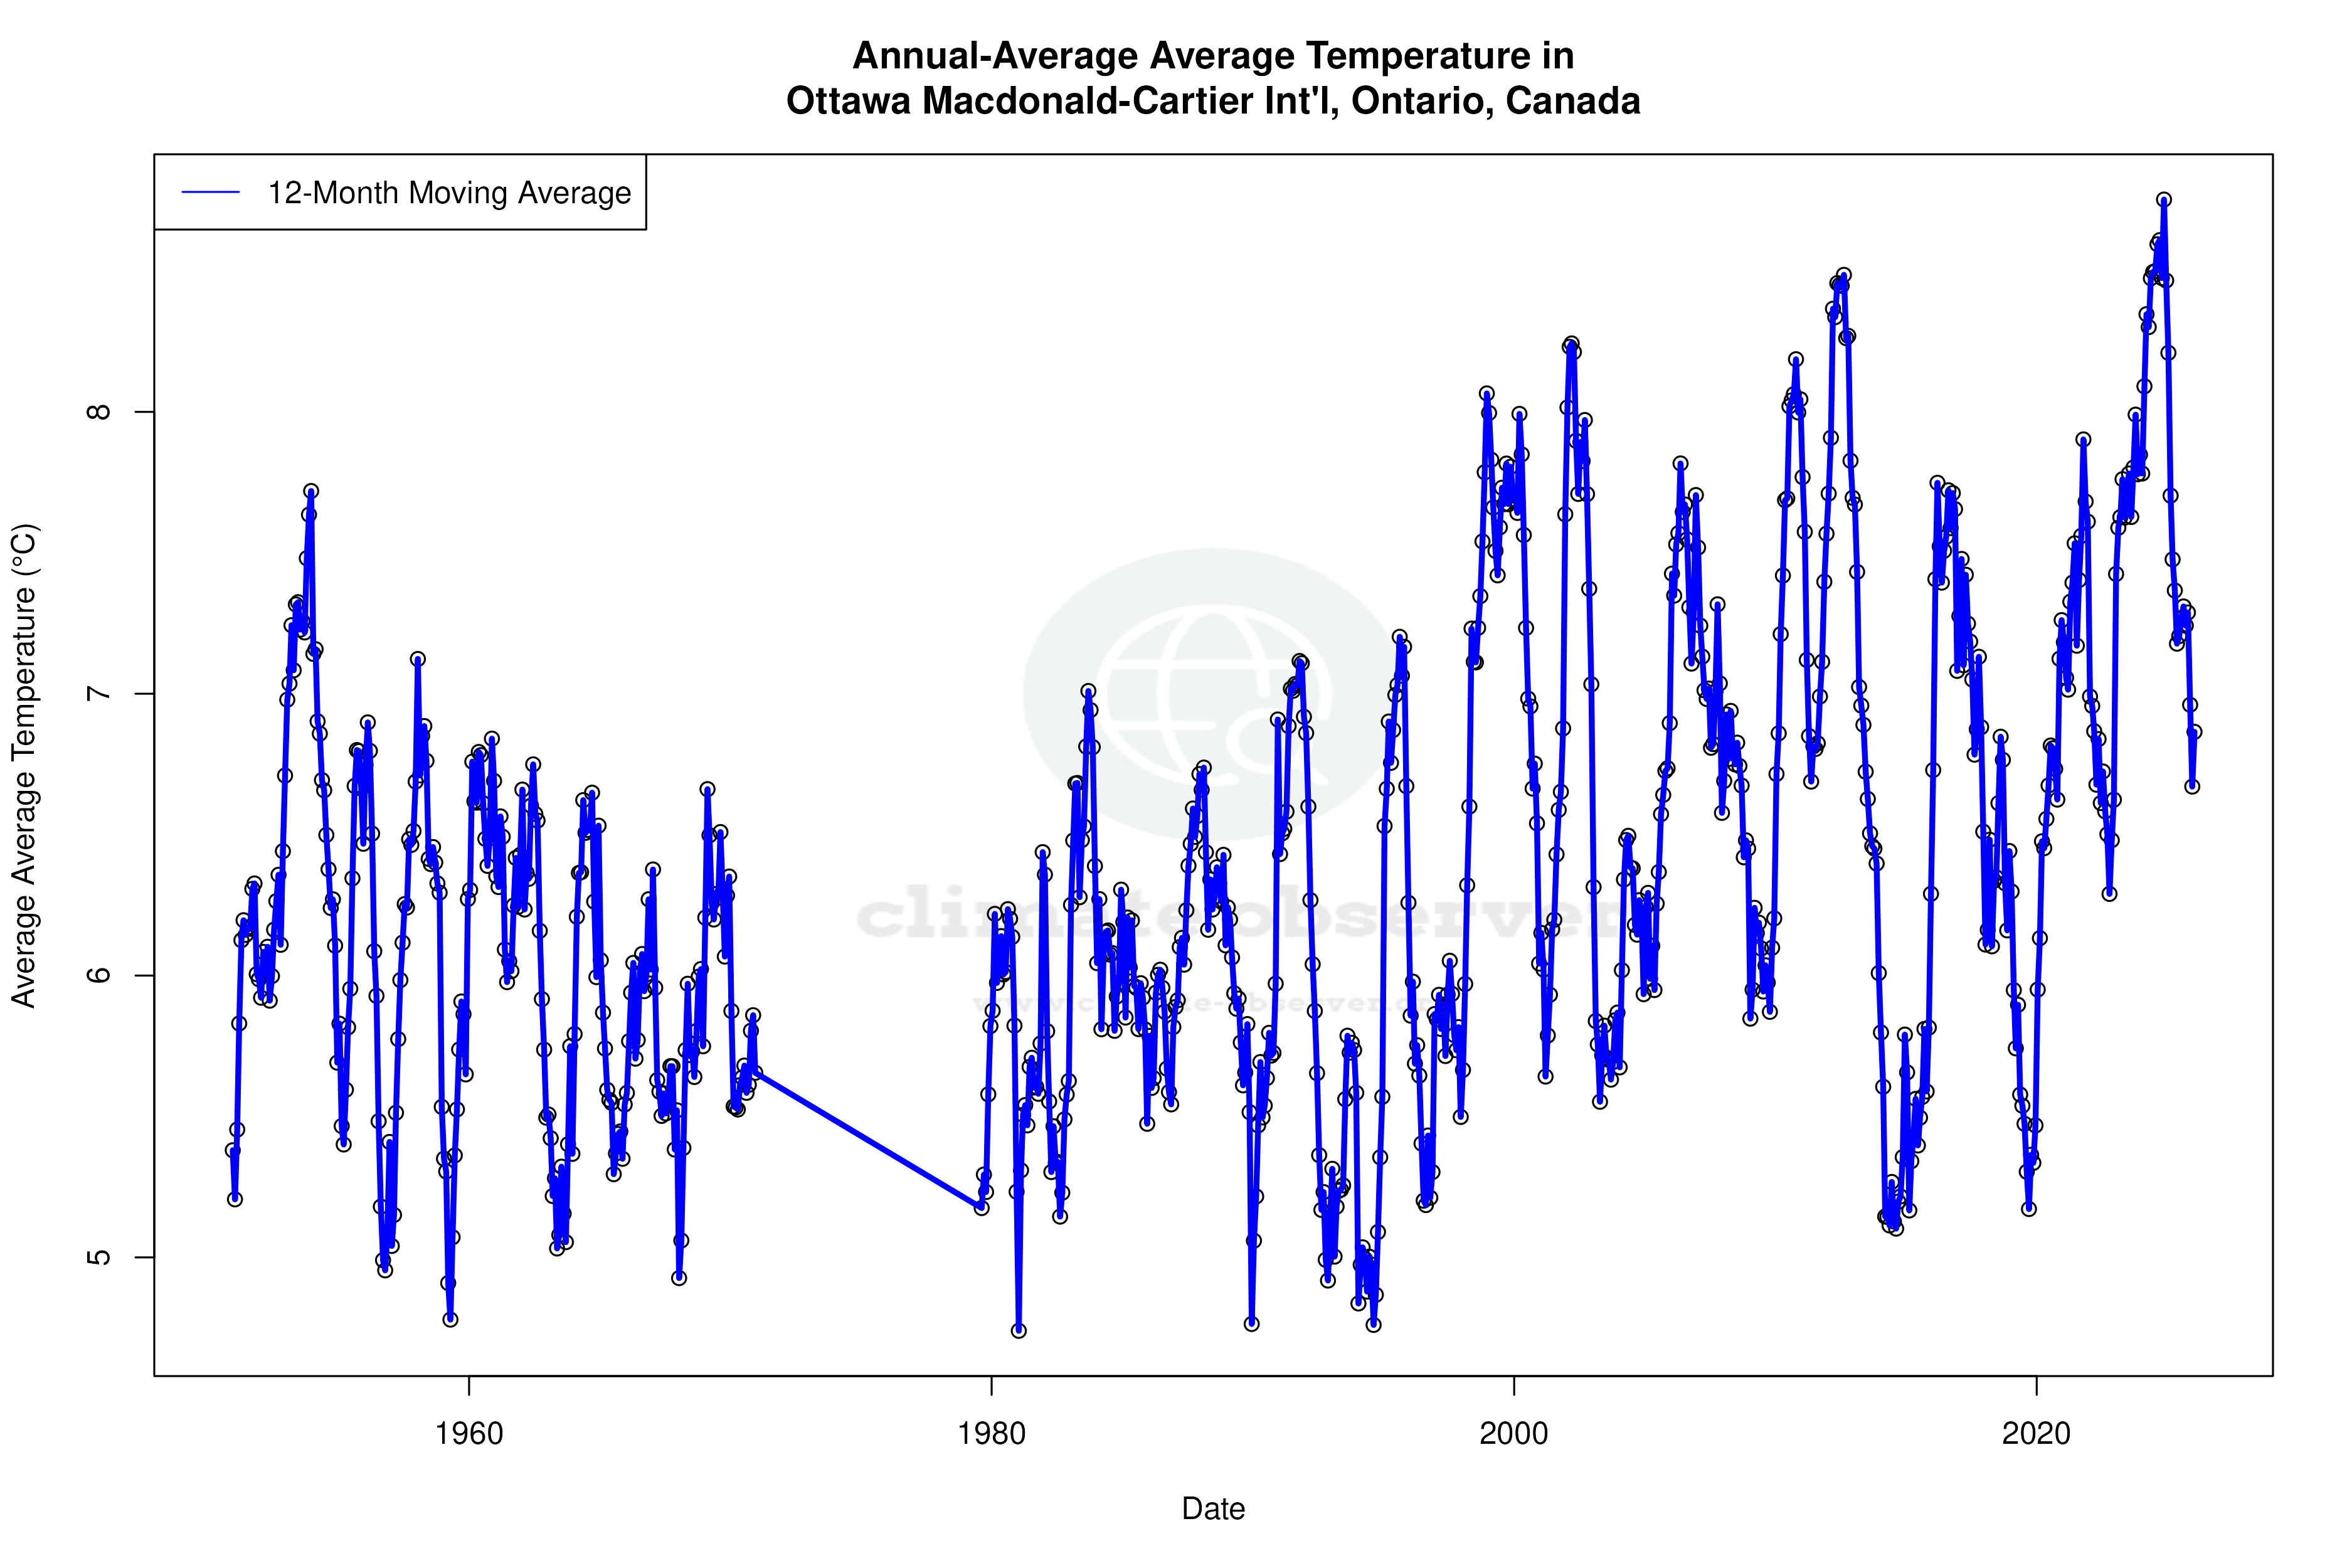


Max Temperature 12-Month MA | 1 of 6
Daily Data Points and Averages Throughout the Year


Average Max Temperature Throughout Year | 1 of 5
